Estimated zip code population in 2022: 29,493 Zip code population in 2010: 27,387 Zip code population in 2000: 25,178
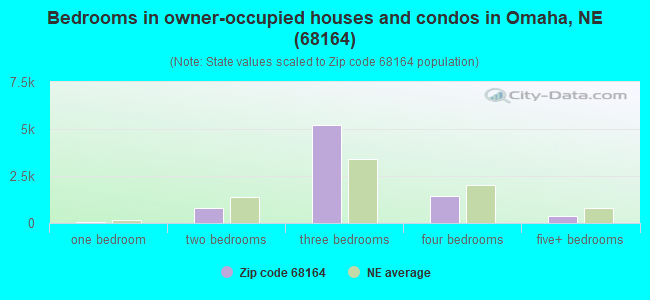
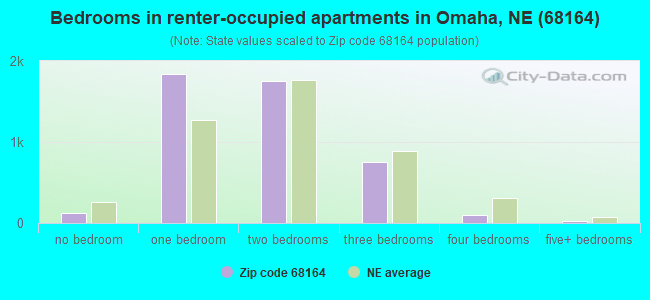
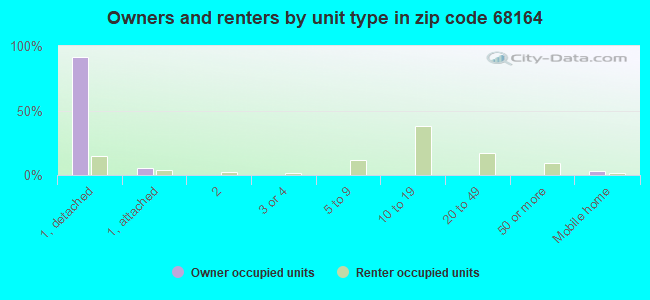
Houses and condos: 12,816 Renter-occupied apartments: 4,562
% of renters here:
37%
State:
34%
March 2022 cost of living index in zip code 68164: 90.0 (less than average, U.S. average is 100)
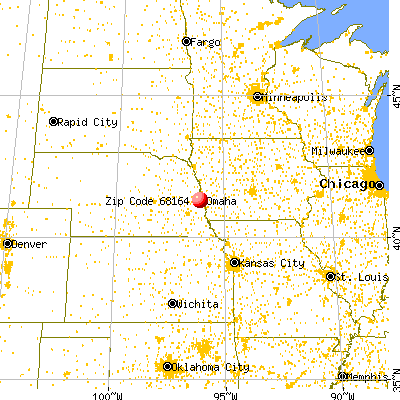
Land area: 8.9 sq. mi. Water area: 0.2 sq. mi.
Population density: 3,318 people per square mile
(average).
OSM Map
General Map
Google Map
MSN Map
OSM Map
General Map
Google Map
MSN Map
OSM Map
General Map
Google Map
MSN Map
OSM Map
General Map
Google Map
MSN Map
Please wait while loading the map...
Real estate property taxes paid for housing units in 2022:
This zip code:
1.6% ($3,966)
Nebraska:
1.4% ($3,313)
Median real estate property taxes paid for housing units with mortgages in 2022: $3,910 (1.6%) Median real estate property taxes paid for housing units with no mortgage in 2022: $4,032 (1.6%)
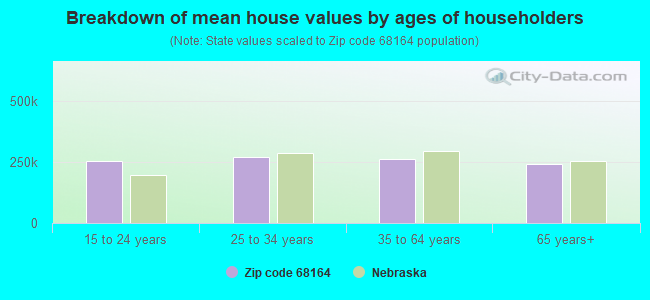
Estimated median house/condo value in 2022: $249,355
68164:
$249,355
Nebraska:
$232,400
According to our research of Nebraska and other state lists, there were 38 registered sex offenders living in 68164 zip code as of April 27, 2024. The ratio of all residents to sex offenders in zip code 68164 is 752 to 1. The ratio of registered sex offenders to all residents in this zip code is lower than the state average.
Median resident age:
This zip code:
36.7 years
Nebraska median age:
37.4 years
Average household size:
This zip code:
2.4 people
Nebraska:
2.4 people
Averages for the 2020 tax year for zip code 68164, filed in 2021:
Average Adjusted Gross Income (AGI) in 2020: $76,627 (Individual Income Tax Returns)
Here:
$76,627
State:
$73,874
Salary/wage: $59,963 (reported on 86.2% of returns)
Here:
$59,963
State:
$58,268
(% of AGI for various income ranges: 1182.7% for AGIs below $25k, 3748.4% for AGIs $25k-50k, 6621.2% for AGIs $50k-75k, 9582.7% for AGIs $75k-100k, 17499.0% for AGIs $100k-200k, 75651.2% for AGIs over 200k)
Taxable interest for individuals: $1,263 (reported on 28.2% of returns)
This zip code:
$1,263
Nebraska:
$1,748
(% of AGI for various income ranges: 11.1% for AGIs below $25k, 15.0% for AGIs $25k-50k, 27.2% for AGIs $50k-75k, 44.6% for AGIs $75k-100k, 75.1% for AGIs $100k-200k, 1398.2% for AGIs over 200k)
Ordinary dividends: $8,193 (reported on 20.8% of returns)
Here:
$8,193
State:
$7,841
(% of AGI for various income ranges: 27.0% for AGIs below $25k, 46.0% for AGIs $25k-50k, 81.7% for AGIs $50k-75k, 115.1% for AGIs $75k-100k, 258.4% for AGIs $100k-200k, 9759.4% for AGIs over 200k)
Net capital gain/loss in AGI: +$18,543 (reported on 19.6% of returns)
Here:
+$18,543
State:
+$21,703
(% of AGI for various income ranges: 14.7% for AGIs below $25k, 26.8% for AGIs $25k-50k, 71.5% for AGIs $50k-75k, 120.9% for AGIs $75k-100k, 408.3% for AGIs $100k-200k, 26094.1% for AGIs over 200k)
Profit/loss from business: +$11,773 (reported on 13.0% of returns)
Here:
+$11,773
State:
+$11,239
(% of AGI for various income ranges: 100.2% for AGIs below $25k, 102.9% for AGIs $25k-50k, 161.4% for AGIs $50k-75k, 178.8% for AGIs $75k-100k, 339.5% for AGIs $100k-200k, 3848.2% for AGIs over 200k)
Taxable individual retirement arrangement distribution: $19,941 (reported on 9.9% of returns)
68164:
$19,941
Nebraska:
$18,251
(% of AGI for various income ranges: 72.5% for AGIs below $25k, 89.1% for AGIs $25k-50k, 204.9% for AGIs $50k-75k, 334.5% for AGIs $75k-100k, 746.7% for AGIs $100k-200k, 3518.2% for AGIs over 200k)
Self-employed (Keogh) retirement plans: $15,975 (reported on 0.3% of returns)
68164:
$15,975
Nebraska:
$23,519
(% of AGI for various income ranges: 46.3% for AGIs $100k-200k)
Total itemized deductions: $28,424 (reported on 7.5% of returns)
Here:
$28,424
State:
$37,704
(% of AGI for various income ranges: 41.4% for AGIs below $25k, 92.4% for AGIs $25k-50k, 277.1% for AGIs $50k-75k, 389.3% for AGIs $75k-100k, 596.6% for AGIs $100k-200k, 5311.2% for AGIs over 200k)
Charity contributions: $10,410 (reported on 5.9% of returns)
Here:
$10,410
State:
$15,251
(% of AGI for various income ranges: 2.6% for AGIs below $25k, 10.8% for AGIs $25k-50k, 40.4% for AGIs $50k-75k, 73.6% for AGIs $75k-100k, 168.4% for AGIs $100k-200k, 2782.9% for AGIs over 200k)
Taxes paid: $7,870 (reported on 7.3% of returns)
68164:
$7,870
State:
$8,015
(% of AGI for various income ranges: 6.4% for AGIs below $25k, 19.5% for AGIs $25k-50k, 80.1% for AGIs $50k-75k, 145.4% for AGIs $75k-100k, 203.3% for AGIs $100k-200k, 955.3% for AGIs over 200k)
Earned income credit: $2,165 (reported on 10.8% of returns)
Here:
$2,165
State:
$2,260
(% of AGI for various income ranges: 70.2% for AGIs below $25k, 44.8% for AGIs $25k-50k, 0.9% for AGIs $50k-75k)
Percentage of individuals using paid preparers for their 2020 taxes: 94.5%
Here:
94%
State:
95%
(% for various income ranges: 93.4% for AGIs below $25k, 95.1% for AGIs $25k-50k, 94.2% for AGIs $50k-75k, 94.3% for AGIs $75k-100k, 95.2% for AGIs $100k-200k, 96.6% for AGIs over 200k)
Averages for the 2012 tax year for zip code 68164, filed in 2013:
Average Adjusted Gross Income (AGI) in 2012: $62,325 (Individual Income Tax Returns)
Here:
$62,325
State:
$60,572
Salary/wage: $53,802 (reported on 89.7% of returns)
Here:
$53,802
State:
$47,046
(% of AGI for various income ranges: 81.9% for AGIs below $25k, 85.9% for AGIs $25k-50k, 81.7% for AGIs $50k-75k, 83.6% for AGIs $75k-100k, 79.9% for AGIs $100k-200k, 57.9% for AGIs over 200k)
Taxable interest for individuals: $957 (reported on 34.5% of returns)
This zip code:
$957
Nebraska:
$1,535
(% of AGI for various income ranges: 0.8% for AGIs below $25k, 0.4% for AGIs $25k-50k, 0.4% for AGIs $50k-75k, 0.5% for AGIs $75k-100k, 0.3% for AGIs $100k-200k, 1.0% for AGIs over 200k)
Ordinary dividends: $4,279 (reported on 21.9% of returns)
Here:
$4,279
State:
$5,776
(% of AGI for various income ranges: 1.6% for AGIs below $25k, 0.9% for AGIs $25k-50k, 0.8% for AGIs $50k-75k, 0.9% for AGIs $75k-100k, 1.3% for AGIs $100k-200k, 3.2% for AGIs over 200k)
Net capital gain/loss in AGI: +$7,740 (reported on 17.8% of returns)
Here:
+$7,740
State:
+$16,171
(% of AGI for various income ranges: 0.2% for AGIs $25k-50k, 0.5% for AGIs $50k-75k, 0.4% for AGIs $75k-100k, 1.3% for AGIs $100k-200k, 8.6% for AGIs over 200k)
Profit/loss from business: +$10,953 (reported on 12.7% of returns)
Here:
+$10,953
State:
+$9,897
(% of AGI for various income ranges: 5.2% for AGIs below $25k, 2.2% for AGIs $25k-50k, 2.2% for AGIs $50k-75k, 1.8% for AGIs $75k-100k, 2.0% for AGIs $100k-200k, 2.1% for AGIs over 200k)
Taxable individual retirement arrangement distribution: $15,656 (reported on 9.9% of returns)
68164:
$15,656
Nebraska:
$12,804
(% of AGI for various income ranges: 3.2% for AGIs below $25k, 1.8% for AGIs $25k-50k, 2.5% for AGIs $50k-75k, 2.5% for AGIs $75k-100k, 2.6% for AGIs $100k-200k, 2.6% for AGIs over 200k)
Self-employment retirement plans: $14,600 (reported on 0.5% of returns)
68164:
$14,600
Nebraska:
$18,457
(% of AGI for various income ranges: 0.1% for AGIs $50k-75k, 0.2% for AGIs $100k-200k, 0.3% for AGIs over 200k)
Total itemized deductions: $21,237 (20% of AGI, reported on 40.5% of returns)
Here:
$21,237
State:
$23,343
Here:
19.8% of AGI
State:
18.7% of AGI
(% of AGI for various income ranges: 10.0% for AGIs below $25k, 9.5% for AGIs $25k-50k, 14.0% for AGIs $50k-75k, 15.1% for AGIs $75k-100k, 15.7% for AGIs $100k-200k, 14.4% for AGIs over 200k)
Charity contributions: $3,592 (reported on 34.5% of returns)
Here:
$3,592
State:
$4,921
(% of AGI for various income ranges: 0.8% for AGIs below $25k, 0.9% for AGIs $25k-50k, 1.7% for AGIs $50k-75k, 2.0% for AGIs $75k-100k, 2.4% for AGIs $100k-200k, 2.8% for AGIs over 200k)
Taxes paid: $9,561 (reported on 40.4% of returns)
68164:
$9,561
State:
$9,758
(% of AGI for various income ranges: 2.3% for AGIs below $25k, 3.1% for AGIs $25k-50k, 5.3% for AGIs $50k-75k, 6.3% for AGIs $75k-100k, 7.5% for AGIs $100k-200k, 8.6% for AGIs over 200k)
Earned income credit: $2,012 (reported on 11.7% of returns)
Here:
$2,012
State:
$2,188
(% of AGI for various income ranges: 4.5% for AGIs below $25k, 0.7% for AGIs $25k-50k)
Percentage of individuals using paid preparers for their 2012 taxes: 46.2%
Here:
46%
State:
57%
(% for various income ranges: 42.0% for AGIs below $25k, 40.3% for AGIs $25k-50k, 47.8% for AGIs $50k-75k, 51.2% for AGIs $75k-100k, 55.0% for AGIs $100k-200k, 77.5% for AGIs over 200k)
Averages for the 2004 tax year for zip code 68164, filed in 2005:
Average Adjusted Gross Income (AGI) in 2004: $55,350 (Individual Income Tax Returns)
Here:
$55,350
State:
$44,271
Salary/wage: $49,840 (reported on 91.2% of returns)
Here:
$49,840
State:
$38,230
(% of AGI for various income ranges: 143.8% for AGIs below $10k, 83.5% for AGIs $10k-25k, 88.1% for AGIs $25k-50k, 87.7% for AGIs $50k-75k, 88.7% for AGIs $75k-100k, 72.0% for AGIs over 100k)
Taxable interest for individuals: $1,193 (reported on 48.0% of returns)
This zip code:
$1,193
Nebraska:
$1,759
(% of AGI for various income ranges: 6.5% for AGIs below $10k, 1.7% for AGIs $10k-25k, 1.1% for AGIs $25k-50k, 0.7% for AGIs $50k-75k, 0.6% for AGIs $75k-100k, 1.2% for AGIs over 100k)
Taxable dividends: $2,091 (reported on 28.2% of returns)
Here:
$2,091
State:
$2,804
(% of AGI for various income ranges: 4.2% for AGIs below $10k, 1.3% for AGIs $10k-25k, 0.8% for AGIs $25k-50k, 0.6% for AGIs $50k-75k, 0.6% for AGIs $75k-100k, 1.5% for AGIs over 100k)
Net capital gain/loss: +$6,413 (reported on 24.4% of returns)
Here:
+$6,413
State:
+$7,887
(% of AGI for various income ranges: -3.3% for AGIs below $10k, 0.1% for AGIs $10k-25k, 0.2% for AGIs $25k-50k, 0.4% for AGIs $50k-75k, 0.7% for AGIs $75k-100k, 6.8% for AGIs over 100k)
Profit/loss from business: +$9,465 (reported on 13.1% of returns)
Here:
+$9,465
State:
+$7,743
(% of AGI for various income ranges: 7.9% for AGIs below $10k, 3.2% for AGIs $10k-25k, 2.4% for AGIs $25k-50k, 1.9% for AGIs $50k-75k, 1.6% for AGIs $75k-100k, 2.4% for AGIs over 100k)
IRA payment deduction: $2,788 (reported on 2.9% of returns)
68164:
$2,788
Nebraska:
$2,902
(% of AGI for various income ranges: 0.3% for AGIs $10k-25k, 0.3% for AGIs $25k-50k, 0.2% for AGIs $50k-75k, 0.1% for AGIs $75k-100k, 0.1% for AGIs over 100k)
Self-employed pension: $12,583 (reported on 0.8% of returns)
Here:
$12,583
Nebraska:
$12,366
(% of AGI for various income ranges: 0.1% for AGIs $25k-50k, 0.1% for AGIs $50k-75k, 0.1% for AGIs $75k-100k, 0.3% for AGIs over 100k)
Total itemized deductions: $18,220 (21% of AGI, reported on 47.9% of returns)
Here:
$18,220
State:
$18,692
Here:
20.6% of AGI
State:
21.1% of AGI
(% of AGI for various income ranges: 14.2% for AGIs below $10k, 10.2% for AGIs $10k-25k, 13.5% for AGIs $25k-50k, 17.5% for AGIs $50k-75k, 18.3% for AGIs $75k-100k, 15.5% for AGIs over 100k)
Charity contributions deductions: $2,808 (3% of AGI, reported on 44.4% of returns)
Here:
$2,808
State:
$3,500
Here:
3.1% of AGI
State:
3.8% of AGI
(% of AGI for various income ranges: 0.8% for AGIs below $10k, 1.0% for AGIs $10k-25k, 1.5% for AGIs $25k-50k, 2.0% for AGIs $50k-75k, 2.4% for AGIs $75k-100k, 2.8% for AGIs over 100k)
Total tax: $7,973 (reported on 83.1% of returns)
68164:
$7,973
State:
$6,550
(% of AGI for various income ranges: 3.8% for AGIs below $10k, 4.8% for AGIs $10k-25k, 7.7% for AGIs $25k-50k, 8.9% for AGIs $50k-75k, 9.8% for AGIs $75k-100k, 17.8% for AGIs over 100k)
Earned income credit: $1,501 (reported on 7.4% of returns)
Here:
$1,501
State:
$1,643
Percentage of individuals using paid preparers for their 2004 taxes: 49.2%
Here:
49%
State:
62%
(% for various income ranges: 38.2% for AGIs below $10k, 47.5% for AGIs $10k-25k, 49.7% for AGIs $25k-50k, 51.4% for AGIs $50k-75k, 50.0% for AGIs $75k-100k, 60.6% for AGIs over 100k)
Likely homosexual households (counted as self-reported same-sex unmarried-partner households)
Lesbian couples: 0.5% of all households
Gay men: 0.0% of all households
Household received Food Stamps/SNAP in the past 12 months: 788 Household did not receive Food Stamps/SNAP in the past 12 months: 11,626
Women who had a birth in the past 12 months: 485 (326 now married, 148 unmarried) Women who did not have a birth in the past 12 months: 6,671 (2,887 now married, 3,784 unmarried)
Housing units in zip code 68164 with a mortgage: 5,693 (349 second mortgage, 313 both second mortgage and home equity loan) Houses without a mortgage: 155
Median monthly owner costs for units with a mortgage: $1,651 Median monthly owner costs for units without a mortgage: $744
Residents with income below the poverty level in 2022:
This zip code:
6.9%
Whole state:
11.2%
Residents with income below 50% of the poverty level in 2022:
This zip code:
3.4%
Whole state:
6.1%
Median number of rooms in houses and condos:
Here:
7.0
State:
7.1
Median number of rooms in apartments:
Here:
3.7
State:
4.2
Notable locations in this zip code not listed on our city pages
Notable locations in zip code 68164: Hillsborough Plaza (A), The Champions Club (B), Eagle Run Golf Course (C), Knolls Golf Course (D), Omaha Fire and Rescue Station 44 (E), West Maple Pediatric Clinic (F), Hillsborough Family Dentistry Center (G), University Medical Associates Building - Eagle Run (H), Aesthetic Dental Care Center (I), Eagle Run West Dental Group Building (J), Creighton Family Healthcare Building - Eagle Run (K), Mapleview Dental Center (L), Dialysis Clinic Incorporated (M). Display/hide their locations on the map
Churches in zip code 68164 include: Saint Elizabeth Ann Church (A), Sunny Slope Church of Christ (B), Presbyterian Church of the Master (C), Gethsemane Lutheran Church (D), Zion Church (E), Saint Vincent Catholic Church (F), Saint Michael Lutheran Church (G), Miracle Hills Community Baptist Church (H), Prairie View Community Church (I). Display/hide their locations on the map
Parks in zip code 68164 include: Papio Dam Site Sixteen Park (1), Standing Bear Lake Park (2), Tranquility Park (3), Roanoake Park (4), Hefflinger Softball - Baseball Complex (5). Display/hide their locations on the map
Tourist attraction (not listed on the city page) : Tim Moylan Tranquility Ice Plex (Amusement & Theme Parks; 12550 West Maple Road).
4,734 married couples with children.
1,942 single-parent households (603 men, 1,339 women).
89.4% of residents of 68164 zip code speak English at home.
4.5% of residents speak Spanish at home (68% very well, 21% well, 5% not well, 6% not at all).
2.7% of residents speak other Indo-European language at home (75% very well, 23% well, 1% not well).
2.8% of residents speak Asian or Pacific Island language at home (58% very well, 27% well, 12% not well, 3% not at all).
1.1% of residents speak other language at home (95% very well, 5% well).
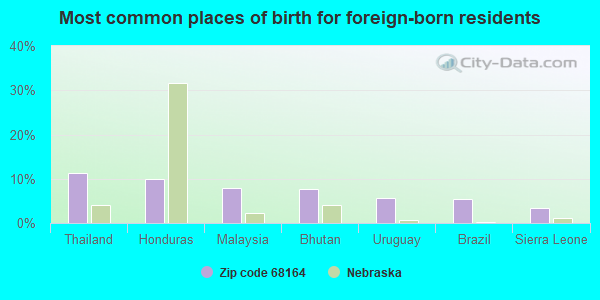
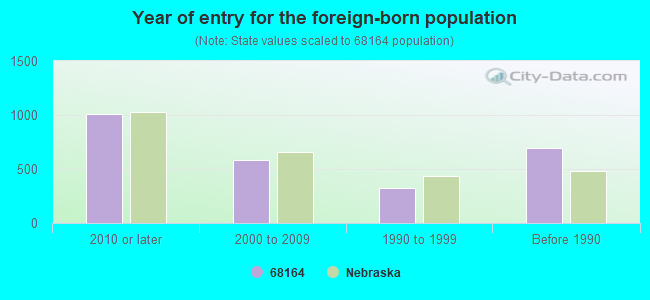
Foreign born population: 2,306 (7.8%) (59.1% of them are naturalized citizens)
Major facilities with environmental interests located in this zip code:
CULLUM, BRUCE LEMAR AND PRINCESS (4629 NORTH 140TH STREET in OMAHA, NE)
(Integrated Compliance Information System) - ICIS-, ENFORCEMENT/COMPLIANCE ACTIVITY, ICIS-07-2005-0152, FORMAL ENFORCEMENT ACTION (Integrated Compliance Information System) - ICIS-, ENFORCEMENT/COMPLIANCE ACTIVITY, ICIS-07-2005-0152, Business SIC classification: OPERATORS OF DWELLINGS OTHER THAN APARTMENT BUILDINGS Alternative names: BRUCE LEMAR CULLUM & PRINCESS CULLUM
METROPOLITAN UTILITIES DIST (11710 FORT ST in OMAHA, NE)
AIR MINOR (AIRS/AFS) AIR SYNTHETIC MINOR (AIRS/AFS) STATE MASTER (Nebraska tracking) - AIR PROGRAM, -022290-99-0000, LEAKING STORAGE TANK, -081992-99-0004, -0002800251, EPCRA Business SIC classification: MIXED, MANUFACTURED, OR LIQUEFIED PETROLEUM GAS PRODUCTION AND/OR DISTRIBUTION
A A PORTABLE SANDBLASTING (13560 1/2 LAKE ST in OMAHA, NE)
AIR MINOR (AIRS/AFS) STATE MASTER (Nebraska tracking) - AIR PROGRAM Business SIC classification: SPECIAL TRADE CONTRACTORS
HEFLINGER PARK (112 W MAPLE RD in OMAHA, NE)
AIR MINOR (AIRS/AFS) STATE MASTER (Nebraska tracking) - AIR PROGRAM, REFUSE DISPOSAL, SUPERFUND Business SIC classification: AMUSEMENT AND RECREATION SERVICES Alternative names: HEFFLINGER PARK
BAXTER AUTO BODY (10921 EMMET in OMAHA, NE)
STATE MASTER (Nebraska tracking) - HAZARDOUS WASTE PROGRAM Small Quantity Generators, between 100 kg and 1000 kg of hazardous waste/month (Resource Conservation and Recovery Act (tracking hazardous waste)) - notification Organizations: BAXTER CHRY PLY INC (CONTACT/OWNER)
EZRA MILLARD ELEMENTARY SCH ( in OMAHA, NE)
(Geographic Names Information System) (National Center for Education Statistics) - STATE ID-280017027 Organizations: MILLARD PUBLIC SCHOOLS (SCHOOL DISTRICT)
FULLERTON ELEMENTARY SCHOOL ( in OMAHA, NE)
(National Center for Education Statistics) - STATE ID-280001104 Organizations: OMAHA PUBLIC SCHOOLS (SCHOOL DISTRICT)
DOUGLAS COUNTY GARAGE (15445 W MAPLE in OMAHA, NE)
(Integrated Compliance Information System) - ICIS-07-2000-0192, FORMAL ENFORCEMENT ACTION
GOLD'S GYM AEROBIC AND FITNESS (10930 EMMET STREET in OMAHA, NE)
(Resource Conservation and Recovery Act (tracking hazardous waste))
ECOLAB INC (GONKA, DUANE) (12212 ERSKINE CIRCLE in OMAHA, NE)
COMPLIANCE ACTIVITY (Tracking inspections of insecticide, fungicide, and rodenticide, and toxic substances)
DAVID T KROFT (6428 NORTH 131ST STREET in OMAHA, NE)
ENFORCEMENT/COMPLIANCE ACTIVITY (Integrated Compliance Information System)
GONKA, DUANE (12212 EXSKIN CIR in OMAHA, NE)
COMPLIANCE ACTIVITY (Tracking inspections of insecticide, fungicide, and rodenticide, and toxic substances)
Housing units lacking complete plumbing facilities: 0.0% Housing units lacking complete kitchen facilities: 1.1%
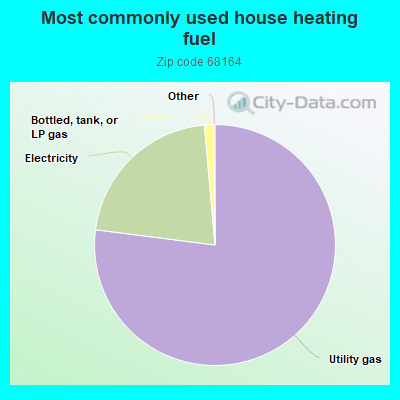
77.1%Utility gas
21.6%Electricity
1.2%Bottled, tank, or LP gas
Population in 1990: 16,301. Population change in the 1990s: +8,877 (+54.5%).
Place of birth for U.S.-born residents:
This state: 18,053
Northeast: 522
Midwest: 4,924
South: 1,463
West: 1,877
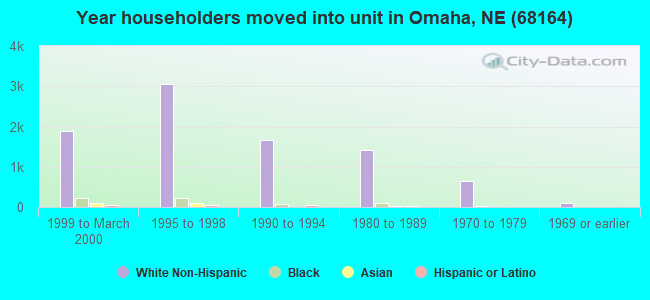
49% of the 68164 zip code residents lived in the same house 5 years ago. Out of people who lived in different houses, 62% lived in this county. Out of people who lived in different counties, 50% lived in Nebraska.
87% of the 68164 zip code residents lived in the same house 1 year ago. Out of people who lived in different houses, 62% moved from this county. Out of people who lived in different houses, 6% moved from different county within same state. Out of people who lived in different houses, 26% moved from different state. Out of people who lived in different houses, 4% moved from abroad.
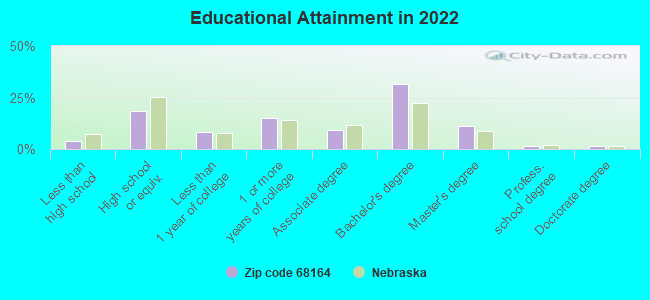
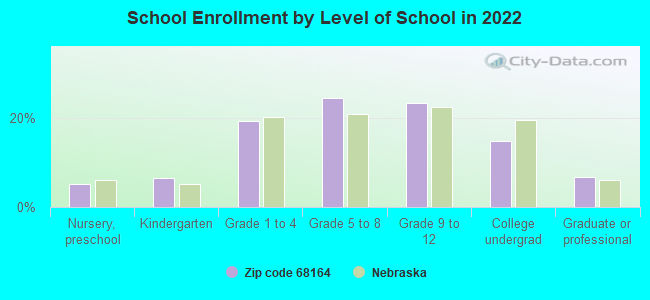
Private vs. public school enrollment:
Students in private schools in grades 1 to 8 (elementary and middle school): 699
Here:
22.6%
Nebraska:
14.1%
Students in private schools in grades 9 to 12 (high school): 388
Here:
23.3%
Nebraska:
12.5%
Students in private undergraduate colleges: 116
Here:
11.1%
Nebraska:
18.0%
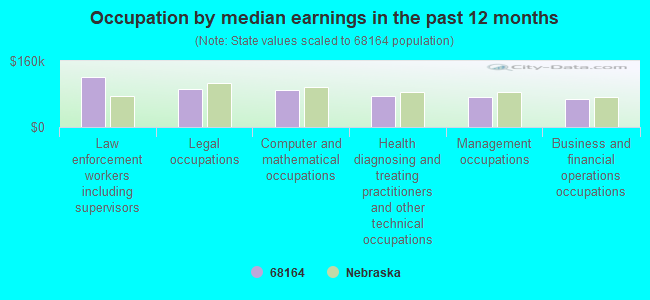
Occupation by median earnings in the past 12 months ($)
121,069Law enforcement workers including supervisors
92,539Legal occupations
89,115Computer and mathematical occupations
74,537Health diagnosing and treating practitioners and other technical occupations
73,878Management occupations
67,498Business and financial operations occupations
Companies with federal contracts located in this zip code (OMAHA, NE):
UTILICORP ENERGY SOLUTIONS, IN (2533 N 117TH AVE)
$50,000 with Defense Logistics Agency for Gas Services. Taking place in KS. Signed on 2000-09-30. Completion date: 2000-09-30.
PAT'S IRISH GREEN LAWN SERVICE (13560 LAKE ST; small business) : $43,464 in 2 contractsin 2006
$30,101 with Army for Construction of Structures and Facilities -- Highways, Roads, Streets, Bridges, and Railways (includes resurfacing). Signed on 2006-04-11. Completion date: 2006-05-16.
$13,363 with Army for Landscaping/Groundskeeping Services. Signed on 2006-05-18. Completion date: 2006-06-01.
URODYNAMICS, INC (11108 LARIMORE AVENUE; small business) : $10,158 in 5 contractsfrom 2000 to 2006
Contracts for Maintenance, Repair and Rebuilding of Equipment -- Medical, Dental, and Veterinary Equipment and Supplies, Urology Services by Air Force Signed by year:2000: $61,190; 2001: $0; 2002: -$31,826; 2003: $0; 2004: -$13,017; 2005: $0; 2006: -$6,189.
Biggest contracts:
$61,190 with Air Force for Maintenance, Repair and Rebuilding of Equipment -- Medical, Dental, and Veterinary Equipment and Supplies. Signed on 2000-10-01. Completion date: 2000-10-01.
$0 with Air Force for Urology Services. Signed on 2004-09-21. Completion date: 2004-09-30.
-$6,189, same as above.Signed on 2006-04-11. Completion date: 2004-09-30.
-$13,017, same as above.Signed on 2004-09-21. Completion date: 2004-09-30.
MULHALLS NURSERY INC (3615 N 120TH ST; small business) : $5,640 in 2 contractsfrom 2003 to 2004
$15,186 with Air Force for Landscaping/Groundskeeping Services. Signed on 2003-12-12. Completion date: 2004-03-08.
-$9,546, same as above.Signed on 2004-04-21. Completion date: 2004-04-16.
PATRICK SULLIVAN (12732 FOWLER CIRCLE; small business) : -$5,343 in 2 contractsin 2002
$0 with U.S. Army Corps of Engineers - civil program financing only for Technical Assistance. Signed on 2002-09-05. Completion date: 2002-05-01.
-$5,343, same as above.Signed on 2002-09-05. Completion date: 2002-05-01.
CHRISTINA R ALICDAN (11022 CROWNPOINT AVE; small business) : -$9,018 in 2 contractsin 2002
$0 with U.S. Army Corps of Engineers - civil program financing only for Technical Assistance. Signed on 2002-09-05. Completion date: 2002-04-30.
-$9,018, same as above.Signed on 2002-09-05. Completion date: 2002-04-30.
Top industries in this zip code by the number of employees in 2005:
Administrative and Support and Waste Management and Remediation Services: Telemarketing Bureaus (500-999 employees: 1 establishment, 100-249 employees: 1 establishment, 20-49 employees: 1 establishment, 5-9 employees: 1 establishment)
Administrative and Support and Waste Management and Remediation Services: Travel Agencies (500-999: 1, 5-9: 2, 1-4: 2)
2002 - 2018 National Fire Incident Reporting System (NFIRS) incidents
According to the data from the years 2002 - 2018 the average number of fire incidents per year is 44. The highest number of reported fires - 59 took place in 2012, and the least - 32 in 2006. The data has an increasing trend.
When looking into fire subcategories, the most incidents belonged to: Structure Fires (42.1%), and Outside Fires (40.0%).
Fire incident types reported to NFIRS in Zip Code 68164


 Nearest zip codes: 68154, 68010, 68134, 68116, 68144, 68114.


 According to the data from the years 2002 - 2018 the average number of fire incidents per year is 44. The highest number of reported fires - 59 took place in 2012, and the least - 32 in 2006. The data has an increasing trend.
 When looking into fire subcategories, the most incidents belonged to: Structure Fires (42.1%), and Outside Fires (40.0%).