Estimated zip code population in 2022: 18,244 Zip code population in 2010: 15,911 Zip code population in 2000: 12,054
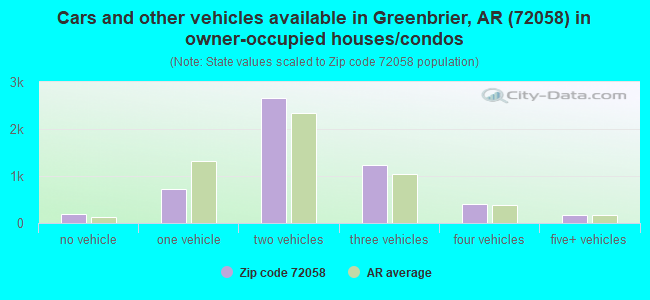
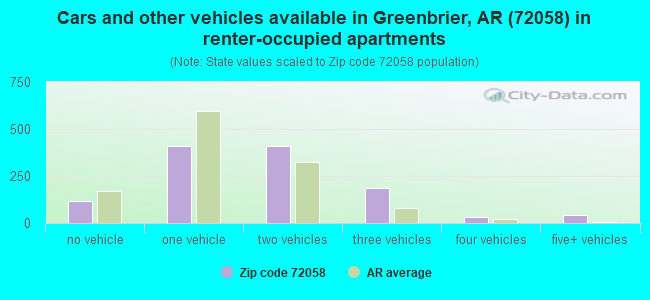
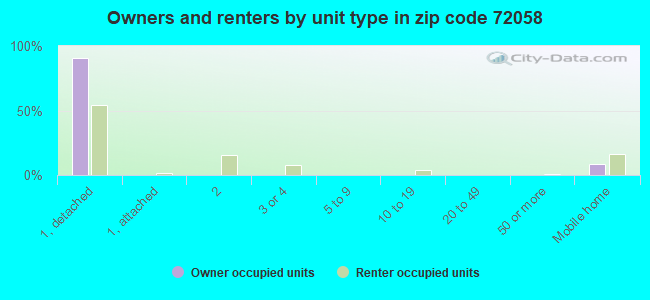
Houses and condos: 7,180 Renter-occupied apartments: 1,228
% of renters here:
19%
State:
34%
March 2022 cost of living index in zip code 72058: 79.3 (low, U.S. average is 100)
Land area: 156.1 sq. mi. Water area: 0.1 sq. mi.
Population density: 117 people per square mile
(very low).
OSM Map
General Map
Google Map
MSN Map
OSM Map
General Map
Google Map
MSN Map
OSM Map
General Map
Google Map
MSN Map
OSM Map
General Map
Google Map
MSN Map
Please wait while loading the map...
Real estate property taxes paid for housing units in 2022:
This zip code:
0.5% ($1,079)
Arkansas:
0.5% ($977)
Median real estate property taxes paid for housing units with mortgages in 2022: $1,185 (0.5%) Median real estate property taxes paid for housing units with no mortgage in 2022: $907 (0.5%)
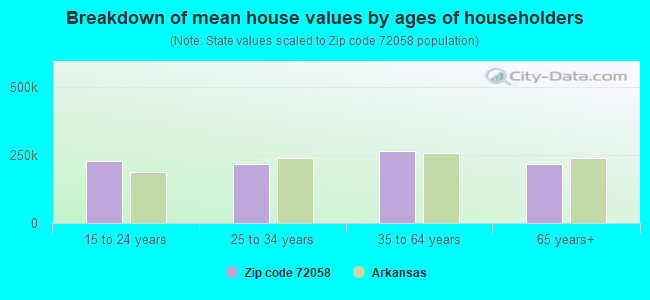
Estimated median house/condo value in 2022: $213,014
72058:
$213,014
Arkansas:
$179,800
According to our research of Arkansas and other state lists, there were 28 registered sex offenders living in 72058 zip code as of April 27, 2024. The ratio of all residents to sex offenders in zip code 72058 is 581 to 1. The ratio of registered sex offenders to all residents in this zip code is near the state average.
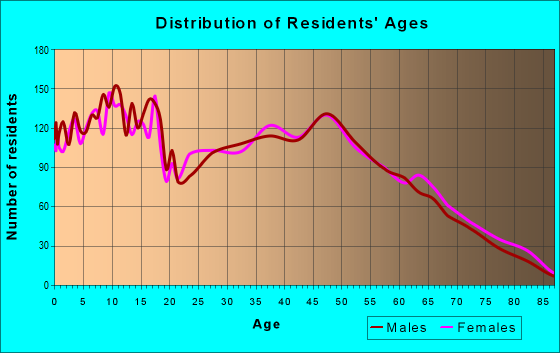
Median resident age:
This zip code:
36.0 years
Arkansas median age:
38.9 years
Average household size:
This zip code:
2.8 people
Arkansas:
2.4 people
Averages for the 2020 tax year for zip code 72058, filed in 2021:
Average Adjusted Gross Income (AGI) in 2020: $66,658 (Individual Income Tax Returns)
Here:
$66,658
State:
$64,872
Salary/wage: $60,765 (reported on 83.0% of returns)
Here:
$60,765
State:
$50,644
(% of AGI for various income ranges: 1165.5% for AGIs below $25k, 3592.1% for AGIs $25k-50k, 6480.9% for AGIs $50k-75k, 8967.4% for AGIs $75k-100k, 17517.3% for AGIs $100k-200k, 60934.4% for AGIs over 200k)
Taxable interest for individuals: $1,252 (reported on 27.5% of returns)
This zip code:
$1,252
Arkansas:
$1,857
(% of AGI for various income ranges: 16.0% for AGIs below $25k, 17.3% for AGIs $25k-50k, 62.3% for AGIs $50k-75k, 47.9% for AGIs $75k-100k, 60.1% for AGIs $100k-200k, 888.9% for AGIs over 200k)
Ordinary dividends: $3,163 (reported on 13.2% of returns)
Here:
$3,163
State:
$21,681
(% of AGI for various income ranges: 17.4% for AGIs below $25k, 20.0% for AGIs $25k-50k, 41.4% for AGIs $50k-75k, 44.7% for AGIs $75k-100k, 102.1% for AGIs $100k-200k, 1275.6% for AGIs over 200k)
Net capital gain/loss in AGI: +$12,964 (reported on 13.6% of returns)
Here:
+$12,964
State:
+$22,815
(% of AGI for various income ranges: 10.4% for AGIs below $25k, 20.9% for AGIs $25k-50k, 70.7% for AGIs $50k-75k, 124.0% for AGIs $75k-100k, 356.7% for AGIs $100k-200k, 9833.3% for AGIs over 200k)
Profit/loss from business: +$8,128 (reported on 19.1% of returns)
Here:
+$8,128
State:
+$9,743
(% of AGI for various income ranges: 145.1% for AGIs below $25k, 148.2% for AGIs $25k-50k, 221.5% for AGIs $50k-75k, 147.2% for AGIs $75k-100k, 323.1% for AGIs $100k-200k, 2102.2% for AGIs over 200k)
Taxable individual retirement arrangement distribution: $19,580 (reported on 6.9% of returns)
72058:
$19,580
Arkansas:
$18,502
(% of AGI for various income ranges: 36.6% for AGIs below $25k, 87.3% for AGIs $25k-50k, 181.0% for AGIs $50k-75k, 237.6% for AGIs $75k-100k, 510.9% for AGIs $100k-200k, 1225.6% for AGIs over 200k)
Total itemized deductions: $32,243 (reported on 6.4% of returns)
Here:
$32,243
State:
$52,840
(% of AGI for various income ranges: 23.0% for AGIs below $25k, 53.0% for AGIs $25k-50k, 140.6% for AGIs $50k-75k, 270.8% for AGIs $75k-100k, 747.5% for AGIs $100k-200k, 6101.1% for AGIs over 200k)
Charity contributions: $14,476 (reported on 5.3% of returns)
Here:
$14,476
State:
$35,735
(% of AGI for various income ranges: 19.6% for AGIs $25k-50k, 25.4% for AGIs $50k-75k, 68.5% for AGIs $75k-100k, 271.6% for AGIs $100k-200k, 2982.2% for AGIs over 200k)
Taxes paid: $7,275 (reported on 6.4% of returns)
72058:
$7,275
State:
$7,196
(% of AGI for various income ranges: 3.6% for AGIs below $25k, 7.1% for AGIs $25k-50k, 27.6% for AGIs $50k-75k, 56.0% for AGIs $75k-100k, 190.0% for AGIs $100k-200k, 1350.0% for AGIs over 200k)
Earned income credit: $2,442 (reported on 16.2% of returns)
Here:
$2,442
State:
$2,546
(% of AGI for various income ranges: 106.4% for AGIs below $25k, 90.9% for AGIs $25k-50k, 2.1% for AGIs $50k-75k)
Percentage of individuals using paid preparers for their 2020 taxes: 94.8%
Here:
95%
State:
94%
(% for various income ranges: 93.8% for AGIs below $25k, 94.7% for AGIs $25k-50k, 94.1% for AGIs $50k-75k, 96.8% for AGIs $75k-100k, 95.8% for AGIs $100k-200k, 96.3% for AGIs over 200k)
Averages for the 2012 tax year for zip code 72058, filed in 2013:
Average Adjusted Gross Income (AGI) in 2012: $54,393 (Individual Income Tax Returns)
Here:
$54,393
State:
$52,148
Salary/wage: $48,889 (reported on 86.1% of returns)
Here:
$48,889
State:
$41,669
(% of AGI for various income ranges: 73.3% for AGIs below $25k, 81.1% for AGIs $25k-50k, 82.3% for AGIs $50k-75k, 83.6% for AGIs $75k-100k, 82.7% for AGIs $100k-200k, 46.6% for AGIs over 200k)
Taxable interest for individuals: $1,003 (reported on 30.0% of returns)
This zip code:
$1,003
Arkansas:
$1,648
(% of AGI for various income ranges: 1.0% for AGIs below $25k, 0.6% for AGIs $25k-50k, 0.4% for AGIs $50k-75k, 0.5% for AGIs $75k-100k, 0.3% for AGIs $100k-200k, 1.0% for AGIs over 200k)
Ordinary dividends: $1,576 (reported on 12.5% of returns)
Here:
$1,576
State:
$20,675
(% of AGI for various income ranges: 0.6% for AGIs below $25k, 0.4% for AGIs $25k-50k, 0.3% for AGIs $50k-75k, 0.4% for AGIs $75k-100k, 0.3% for AGIs $100k-200k, 0.3% for AGIs over 200k)
Net capital gain/loss in AGI: +$9,336 (reported on 10.5% of returns)
Here:
+$9,336
State:
+$15,222
(% of AGI for various income ranges: 0.3% for AGIs below $25k, 0.3% for AGIs $25k-50k, 0.3% for AGIs $50k-75k, 0.6% for AGIs $75k-100k, 1.4% for AGIs $100k-200k, 9.9% for AGIs over 200k)
Profit/loss from business: +$11,028 (reported on 18.0% of returns)
Here:
+$11,028
State:
+$9,665
(% of AGI for various income ranges: 9.6% for AGIs below $25k, 3.1% for AGIs $25k-50k, 2.6% for AGIs $50k-75k, 1.2% for AGIs $75k-100k, 1.2% for AGIs $100k-200k, 11.3% for AGIs over 200k)
Taxable individual retirement arrangement distribution: $13,014 (reported on 7.5% of returns)
72058:
$13,014
Arkansas:
$13,644
(% of AGI for various income ranges: 3.0% for AGIs below $25k, 1.6% for AGIs $25k-50k, 1.8% for AGIs $50k-75k, 1.6% for AGIs $75k-100k, 2.4% for AGIs $100k-200k)
Total itemized deductions: $20,605 (21% of AGI, reported on 33.0% of returns)
Here:
$20,605
State:
$23,276
Here:
21.2% of AGI
State:
19.1% of AGI
(% of AGI for various income ranges: 7.0% for AGIs below $25k, 9.0% for AGIs $25k-50k, 11.4% for AGIs $50k-75k, 13.5% for AGIs $75k-100k, 15.1% for AGIs $100k-200k, 15.0% for AGIs over 200k)
Charity contributions: $5,101 (reported on 26.2% of returns)
Here:
$5,101
State:
$5,996
(% of AGI for various income ranges: 1.0% for AGIs below $25k, 1.6% for AGIs $25k-50k, 2.0% for AGIs $50k-75k, 2.6% for AGIs $75k-100k, 3.0% for AGIs $100k-200k, 3.7% for AGIs over 200k)
Taxes paid: $6,585 (reported on 33.0% of returns)
72058:
$6,585
State:
$7,941
(% of AGI for various income ranges: 1.0% for AGIs below $25k, 1.8% for AGIs $25k-50k, 2.8% for AGIs $50k-75k, 4.2% for AGIs $75k-100k, 5.9% for AGIs $100k-200k, 6.1% for AGIs over 200k)
Earned income credit: $2,335 (reported on 19.8% of returns)
Here:
$2,335
State:
$2,455
(% of AGI for various income ranges: 7.7% for AGIs below $25k, 1.4% for AGIs $25k-50k)
Percentage of individuals using paid preparers for their 2012 taxes: 66.5%
Here:
67%
State:
61%
(% for various income ranges: 63.7% for AGIs below $25k, 64.4% for AGIs $25k-50k, 69.8% for AGIs $50k-75k, 68.8% for AGIs $75k-100k, 70.1% for AGIs $100k-200k, 81.8% for AGIs over 200k)
Averages for the 2004 tax year for zip code 72058, filed in 2005:
Average Adjusted Gross Income (AGI) in 2004: $39,494 (Individual Income Tax Returns)
Here:
$39,494
State:
$39,270
Salary/wage: $36,832 (reported on 87.2% of returns)
Here:
$36,832
State:
$34,079
(% of AGI for various income ranges: 91.4% for AGIs below $10k, 81.5% for AGIs $10k-25k, 86.7% for AGIs $25k-50k, 84.6% for AGIs $50k-75k, 82.9% for AGIs $75k-100k, 68.4% for AGIs over 100k)
Taxable interest for individuals: $1,454 (reported on 33.1% of returns)
This zip code:
$1,454
Arkansas:
$1,904
(% of AGI for various income ranges: 3.6% for AGIs below $10k, 1.7% for AGIs $10k-25k, 0.8% for AGIs $25k-50k, 0.8% for AGIs $50k-75k, 0.7% for AGIs $75k-100k, 2.2% for AGIs over 100k)
Taxable dividends: $1,242 (reported on 15.8% of returns)
Here:
$1,242
State:
$5,995
(% of AGI for various income ranges: 1.1% for AGIs below $10k, 0.5% for AGIs $10k-25k, 0.3% for AGIs $25k-50k, 0.3% for AGIs $50k-75k, 0.2% for AGIs $75k-100k, 1.2% for AGIs over 100k)
Net capital gain/loss: +$5,481 (reported on 14.8% of returns)
Here:
+$5,481
State:
+$10,430
(% of AGI for various income ranges: 0.4% for AGIs below $10k, 0.5% for AGIs $10k-25k, 0.5% for AGIs $25k-50k, 1.3% for AGIs $50k-75k, 1.7% for AGIs $75k-100k, 6.0% for AGIs over 100k)
Profit/loss from business: +$6,040 (reported on 19.7% of returns)
Here:
+$6,040
State:
+$7,823
(% of AGI for various income ranges: 9.8% for AGIs below $10k, 6.7% for AGIs $10k-25k, 2.9% for AGIs $25k-50k, 2.6% for AGIs $50k-75k, 1.9% for AGIs $75k-100k, 1.9% for AGIs over 100k)
IRA payment deduction: $2,714 (reported on 2.0% of returns)
72058:
$2,714
Arkansas:
$3,204
(% of AGI for various income ranges: 0.1% for AGIs $10k-25k, 0.1% for AGIs $25k-50k, 0.1% for AGIs $50k-75k, 0.1% for AGIs $75k-100k, 0.1% for AGIs over 100k)
Total itemized deductions: $17,276 (24% of AGI, reported on 29.4% of returns)
Here:
$17,276
State:
$18,389
Here:
24.1% of AGI
State:
21.0% of AGI
(% of AGI for various income ranges: 10.5% for AGIs below $10k, 7.0% for AGIs $10k-25k, 9.4% for AGIs $25k-50k, 12.8% for AGIs $50k-75k, 15.5% for AGIs $75k-100k, 18.2% for AGIs over 100k)
Charity contributions deductions: $3,561 (5% of AGI, reported on 25.7% of returns)
Here:
$3,561
State:
$4,725
Here:
4.9% of AGI
State:
5.1% of AGI
(% of AGI for various income ranges: 0.5% for AGIs below $10k, 1.1% for AGIs $10k-25k, 1.6% for AGIs $25k-50k, 2.6% for AGIs $50k-75k, 3.2% for AGIs $75k-100k, 3.0% for AGIs over 100k)
Total tax: $4,585 (reported on 73.2% of returns)
72058:
$4,585
State:
$6,047
(% of AGI for various income ranges: 3.3% for AGIs below $10k, 3.8% for AGIs $10k-25k, 5.6% for AGIs $25k-50k, 7.7% for AGIs $50k-75k, 9.5% for AGIs $75k-100k, 15.0% for AGIs over 100k)
Earned income credit: $1,868 (reported on 20.1% of returns)
Here:
$1,868
State:
$1,909
Percentage of individuals using paid preparers for their 2004 taxes: 66.3%
Here:
66%
State:
67%
(% for various income ranges: 56.2% for AGIs below $10k, 69.1% for AGIs $10k-25k, 68.3% for AGIs $25k-50k, 68.3% for AGIs $50k-75k, 68.6% for AGIs $75k-100k, 71.7% for AGIs over 100k)
Household received Food Stamps/SNAP in the past 12 months: 353 Household did not receive Food Stamps/SNAP in the past 12 months: 6,285
Women who had a birth in the past 12 months: 304 (212 now married, 93 unmarried) Women who did not have a birth in the past 12 months: 3,948 (2,364 now married, 1,593 unmarried)
Housing units in zip code 72058 with a mortgage: 3,446 (243 second mortgage, 1 home equity loan, 214 both second mortgage and home equity loan) Houses without a mortgage: 7
Median monthly owner costs for units with a mortgage: $1,315 Median monthly owner costs for units without a mortgage: $439
Residents with income below the poverty level in 2022:
This zip code:
8.7%
Whole state:
16.8%
Residents with income below 50% of the poverty level in 2022:
This zip code:
5.6%
Whole state:
8.5%
Median number of rooms in houses and condos:
Here:
6.3
State:
6.1
Median number of rooms in apartments:
Here:
4.9
State:
4.3
Notable locations in this zip code not listed on our city pages
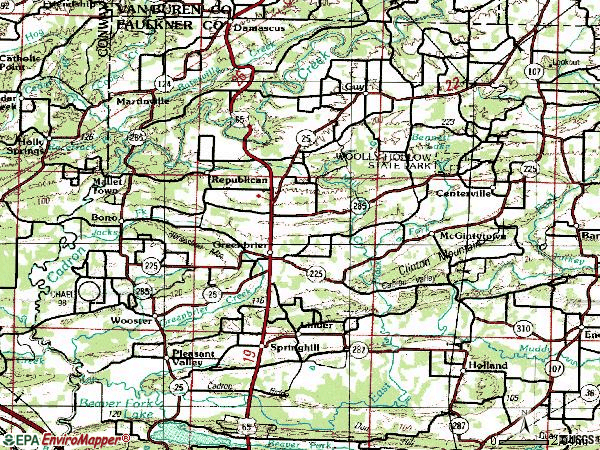
Notable locations in zip code 72058: Greenbrier Police Department (A), Guy Police Department (B), Centerville Volunteer Fire Department (C), Wooster Volunteer Fire Department (D), Greenbrier Volunteer Fire Department (E), Greenbrier Volunteer Fire Station (F), Guy Volunteer Fire Department (G), Metropolitan Emergency Medical Service - Greenbrier (H). Display/hide their locations on the map
Churches in zip code 72058 include: Pleasant Valley Baptist Church (A), Soda Valley Free Will Baptist Church (B), Pleasant Hill Methodist Church (C), Pilgrim Rest Missionary Baptist Church (D), Needs Creek Baptist Church (E), Mountain Grove Baptist Church (F), Pinnacle Spring Tabernacle (G), Black Fork Missionary Baptist Church (H), Bethlehem Baptist Church (I). Display/hide their locations on the map
Cemeteries: Henderson Cemetery (1), McGinty Cemetery (2), Needs Creek Cemetery (3), Mode Cemetery (4), Estep Cemetery (5), McNew Cemetery (6), Copperas Springs Cemetery (7). Display/hide their locations on the map
Reservoirs and swamps: Dears Pond (A), Lawrences Lake (B), Lake Bennett (C), Montgomery Lake (D), Brushy Pond (E), Duck Pond (F), Goose Pond (G). Display/hide their locations on the map
Streams, rivers, and creeks: Needs Creek (A), Muddy Bayou (B), Mill Creek (C), Lost Creek (D), Wolf Branch (E), Greenbrier Creek (F), Jacks Fork (G), Stillhouse Branch (H), Cedar Branch (I). Display/hide their locations on the map
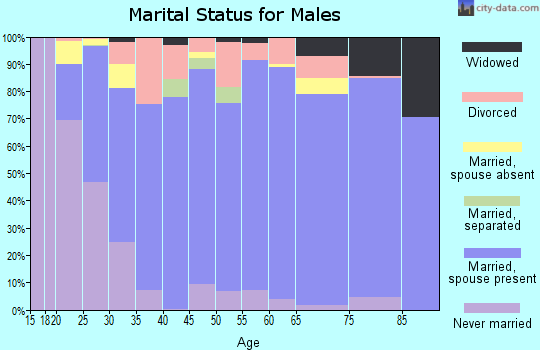
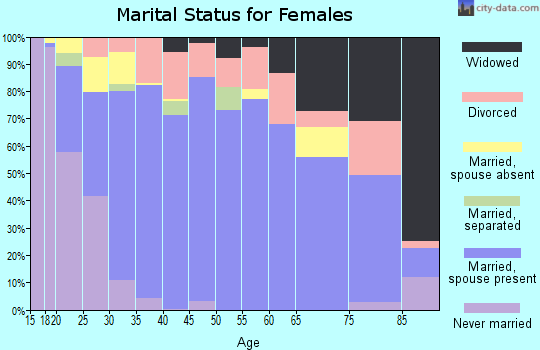
3,979 married couples with children.
603 single-parent households (133 men, 470 women).
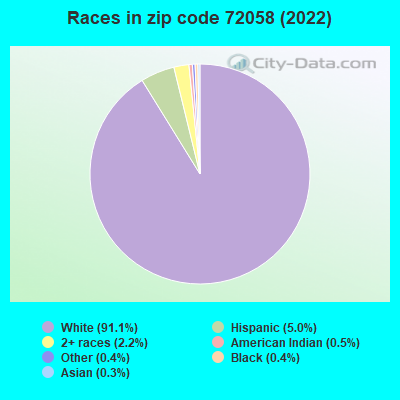
96.2% of residents of 72058 zip code speak English at home.
2.6% of residents speak Spanish at home (96% very well, 4% well).
0.6% of residents speak other Indo-European language at home (96% very well, 4% not well).
0.4% of residents speak Asian or Pacific Island language at home (100% very well).
0.1% of residents speak other language at home (100% very well).
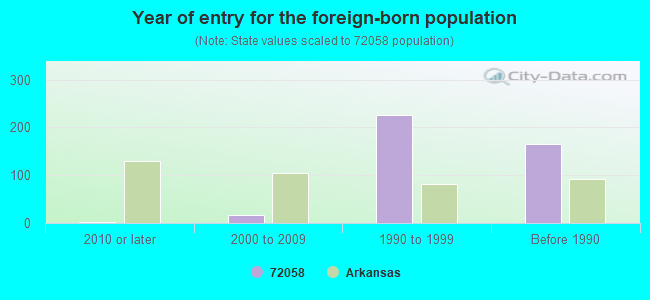
Foreign born population: 355 (1.9%) (41.1% of them are naturalized citizens)
This zip code:
1.9%
Whole state:
5.1%
25%Honduras
14%Japan
11%Brazil
1%Thailand
1%North Macedonia (Macedonia)
1%Guatemala
0%El Salvador
12%American
9%English
6%German
5%Irish
2%Italian
1%Canadian
1%European
Year of entry for the foreign-born population
32010 or later
162000 to 2009
2261990 to 1999
165Before 1990
Major facilities with environmental interests located in this zip code:
GREENBRIER, CITY OF (40 AMBER RD in GREENBRIER, AR)
National Pollutant Discharge Elimination System NON-MAJOR (Tracking pollutant discharge elimination systems) - permit STATE MASTER (PDS) - WATER-AR0036536, National Pollutant Discharge Elimination System Permit COMMUNITY WATER SYSTEM (SDWIS) - SDWIS-AR0000097 1, WATER TREATMENT PLANT COMMUNITY WATER SYSTEM (SDWIS) - SDWIS-AR0000191 1, WATER TREATMENT PLANT, SDWIS-AR0000191 2, SDWIS-AR0000191 3, SDWIS-AR0000191 4, Business SIC classification: SEWERAGE SYSTEMS Alternative names: GREENBRIER WATERWORKS, GREENWAY WATERWORKS
JEFFREY SAND & GRAVEL CO. (77 EAST REPUBLICAN ROAD in GREENBRIER, AR)
AIR MINOR (AIRS/AFS) STATE MASTER (PDS) - AIR-1790-AR-1, AIR MINOR, WATER-ARR00C002, NPDES STORMWATER PERMIT Business SIC classification: DIMENSION STONE Alternative names: GILBERT CENTRAL CORP-PYRAMID PIT, JEFFREY GREENBRIER QUARRY, JEFFREY SAND COMPANY, PYRAMID ROCK AND TIMBER, PYRAMID ROCK L.L.C.
KOUNTRY JUNCTION CAR WASH (1110 HWY 65N in GREENBRIER, AR)
National Pollutant Discharge Elimination System NON-MAJOR (Tracking pollutant discharge elimination systems) - permit STATE MASTER (PDS) - RST-23000086, UNDERGROUND STORAGE TANK PROGRAM, WATER-AR0043877, National Pollutant Discharge Elimination System Permit, WATER-ARG750041, Business SIC classification: CARWASHES Organizations: MCNESPY, ALEX SR. (CONTACT/GENERAL)
GREENBRIER SPORTS PARK (132 HIGHWAY #225 in GREENBRIER, AR)
National Pollutant Discharge Elimination System NON-MAJOR (Tracking pollutant discharge elimination systems) - permit STATE MASTER (PDS) - WATER-AR0050440, National Pollutant Discharge Elimination System Permit, WATER-AR0050440C, Business SIC classification: EATING PLACES
HUNTINGTON ESTATES SUBDIVISION (121 ELLIOT RD in GREENBRIER, AR)
National Pollutant Discharge Elimination System NON-MAJOR (Tracking pollutant discharge elimination systems) - permit STATE MASTER (PDS) - WATER-AR0050598, National Pollutant Discharge Elimination System Permit, WATER-ARR151340, NPDES STORMWATER PERMIT Business SIC classification: LAND SUBDIVIDERS AND DEVELOPERS, EXCEPT CEMETERIES
SPRINGHIL BAPTIST CHURCH (25 HWY 287 in GREENBRIER, AR)
National Pollutant Discharge Elimination System NON-MAJOR (Tracking pollutant discharge elimination systems) - permit STATE MASTER (PDS) - WATER-ARG550274, National Pollutant Discharge Elimination System Permit Business SIC classification: RELIGIOUS ORGANIZATIONS Alternative names: SPRINGHILL BAPTIST CHURCH
GREENBRIER HIGH SCHOOL (72 GREEN VALLEY DRIVE in GREENBRIER, AR)
(Geographic Names Information System) (National Center for Education Statistics) - STATE ID-2303017
GREENBRIER JUNIOR HIGH SCHOOL (10 SCHOOL DRIVE in GREENBRIER, AR)
(Geographic Names Information System) (National Center for Education Statistics) - STATE ID-2303020
GREENBRIER MIDDLE SCHOOL (13 SCHOOL DRIVE in GREENBRIER, AR)
(Geographic Names Information System) (National Center for Education Statistics) - STATE ID-2303018
GREENBRIER EASTSIDE ELEMENTARY (50 WILSON FARM ROAD in GREENBRIER, AR)
(National Center for Education Statistics) - STATE ID-2303016
GREENBRIER WESTSIDE ELEMENTARY (65 GARRETT ROAD in GREENBRIER, AR)
(National Center for Education Statistics) - STATE ID-2303019
ALLTEL (P.O. BOX 37 in GREENBRIER, AR)
(Integrated Compliance Information System) - ICIS-HQ-2000-6004, FORMAL ENFORCEMENT ACTION
(Integrated Compliance Information System) - ICIS-06-1999-0175, FORMAL ENFORCEMENT ACTION Business SIC classification: GROCERY STORES; GASOLINE SERVICE STATIONS
Housing units lacking complete plumbing facilities: 2.1% Housing units lacking complete kitchen facilities: 1.9%
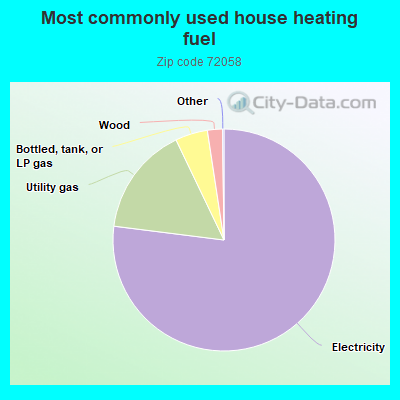
77.0%Electricity
15.9%Utility gas
4.7%Bottled, tank, or LP gas
2.2%Wood
Population in 1990: 5,532. Population change in the 1990s: +6,522 (+117.9%).
Place of birth for U.S.-born residents:
This state: 12,477
Northeast: 227
Midwest: 1,524
South: 2,234
West: 1,298
52% of the 72058 zip code residents lived in the same house 5 years ago. Out of people who lived in different houses, 58% lived in this county. Out of people who lived in different counties, 50% lived in Arkansas.
93% of the 72058 zip code residents lived in the same house 1 year ago. Out of people who lived in different houses, 60% moved from this county. Out of people who lived in different houses, 24% moved from different county within same state. Out of people who lived in different houses, 15% moved from different state.
Private vs. public school enrollment:
Students in private schools in grades 1 to 8 (elementary and middle school): 57
Here:
2.4%
Arkansas:
10.5%
Students in private schools in grades 9 to 12 (high school): 19
Here:
1.9%
Arkansas:
8.7%
Students in private undergraduate colleges: 34
Here:
6.9%
Arkansas:
19.4%
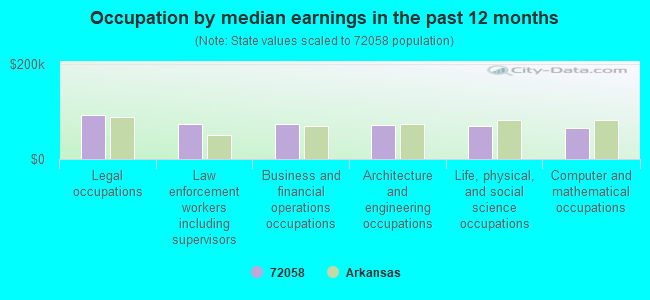
Occupation by median earnings in the past 12 months ($)
92,170Legal occupations
74,987Law enforcement workers including supervisors
74,685Business and financial operations occupations
71,207Architecture and engineering occupations
69,239Life, physical, and social science occupations
65,671Computer and mathematical occupations
Companies with federal contracts located in this zip code:
VONIA FAY DUNCAN (377 BURKETT FLAT RD in GREENBRIER, AR; small business) : $44,970 in 9 contractsfrom 2002 to 2006
Contracts for Facilities Operations Support Services, Operation of Government-Owned Facilities -- Recreation Facilities (Non-Building) by U.S. Army Corps of Engineers - civil program financing only, Army Signed by year:2000: $0; 2001: $0; 2002: $11,100; 2003: $0; 2004: $22,110; 2005: $1,329; 2006: $10,431.
Biggest contracts:
$11,100 with U.S. Army Corps of Engineers - civil program financing only for Facilities Operations Support Services. Signed on 2002-11-13. Completion date: 2002-10-31.
$9,625 with U.S. Army Corps of Engineers - civil program financing only for Operation of Government-Owned Facilities -- Recreation Facilities (Non-Building). Signed on 2004-03-11. Completion date: 2004-10-31.
$9,625 with Army for Operation of Government-Owned Facilities -- Recreation Facilities (Non-Building). Signed on 2004-03-11. Completion date: 2004-10-31.
$8,949, same as above.Signed on 2006-04-28. Completion date: 2005-10-31.
Top industries in this zip code by the number of employees in 2005:
2007 - 2018 National Fire Incident Reporting System (NFIRS) incidents
According to the data from the years 2007 - 2018 the average number of fires per year is 78. The highest number of reported fire incidents - 163 took place in 2015, and the least - 8 in 2009. The data has an increasing trend.
When looking into fire subcategories, the most reports belonged to: Outside Fires (59.3%), and Structure Fires (32.3%).
Fire incident types reported to NFIRS in Zip Code 72058


 Nearest zip codes: 72061, 72181, 72039, 72047, 72032, 72157.


 According to the data from the years 2007 - 2018 the average number of fires per year is 78. The highest number of reported fire incidents - 163 took place in 2015, and the least - 8 in 2009. The data has an increasing trend.
 When looking into fire subcategories, the most reports belonged to: Outside Fires (59.3%), and Structure Fires (32.3%).