Estimated zip code population in 2022: 11,866 Zip code population in 2010: 10,727 Zip code population in 2000: 10,120
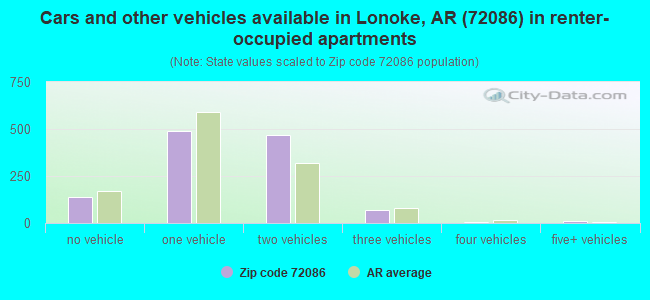
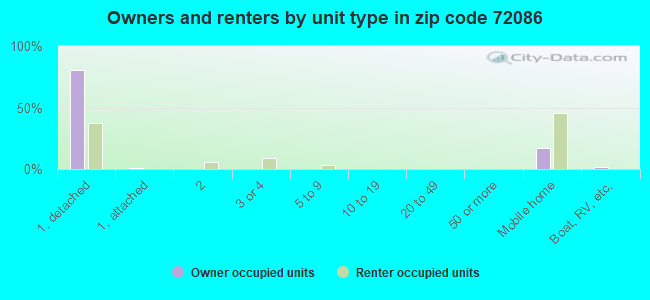
Houses and condos: 4,957 Renter-occupied apartments: 1,191
% of renters here:
26%
State:
34%
March 2022 cost of living index in zip code 72086: 79.3 (low, U.S. average is 100)
Land area: 145.4 sq. mi. Water area: 14.6 sq. mi.
Population density: 82 people per square mile
(very low).
OSM Map
General Map
Google Map
MSN Map
OSM Map
General Map
Google Map
MSN Map
OSM Map
General Map
Google Map
MSN Map
OSM Map
General Map
Google Map
MSN Map
Please wait while loading the map...
Real estate property taxes paid for housing units in 2022:
This zip code:
0.7% ($1,079)
Arkansas:
0.5% ($977)
Median real estate property taxes paid for housing units with mortgages in 2022: $1,187 (0.7%) Median real estate property taxes paid for housing units with no mortgage in 2022: $910 (0.9%)
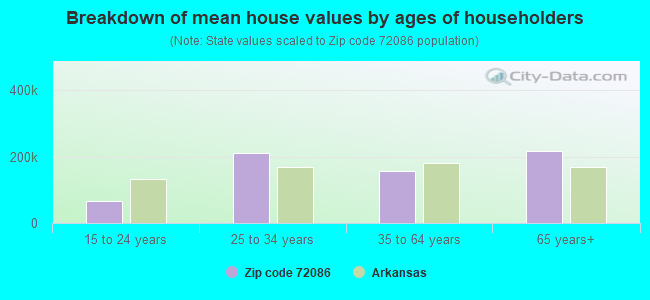
Estimated median house/condo value in 2022: $145,589
72086:
$145,589
Arkansas:
$179,800
According to our research of Arkansas and other state lists, there were 23 registered sex offenders living in 72086 zip code as of April 26, 2024. The ratio of all residents to sex offenders in zip code 72086 is 440 to 1. The ratio of registered sex offenders to all residents in this zip code is near the state average.
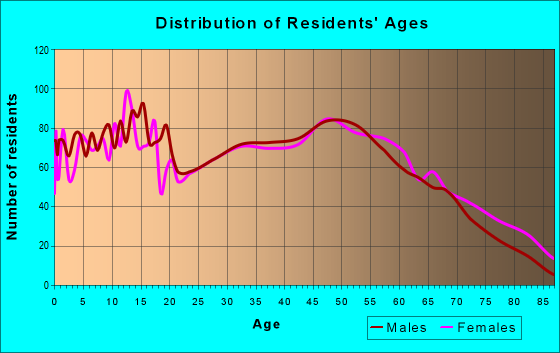
Median resident age:
This zip code:
38.9 years
Arkansas median age:
38.9 years
Average household size:
This zip code:
2.5 people
Arkansas:
2.4 people
Averages for the 2020 tax year for zip code 72086, filed in 2021:
Average Adjusted Gross Income (AGI) in 2020: $53,105 (Individual Income Tax Returns)
Here:
$53,105
State:
$64,872
Salary/wage: $47,027 (reported on 82.1% of returns)
Here:
$47,027
State:
$50,644
(% of AGI for various income ranges: 1258.6% for AGIs below $25k, 3726.1% for AGIs $25k-50k, 6578.8% for AGIs $50k-75k, 9962.4% for AGIs $75k-100k, 17823.4% for AGIs $100k-200k, 48600.0% for AGIs over 200k)
Taxable interest for individuals: $933 (reported on 22.1% of returns)
This zip code:
$933
Arkansas:
$1,857
(% of AGI for various income ranges: 6.9% for AGIs below $25k, 12.2% for AGIs $25k-50k, 48.0% for AGIs $50k-75k, 36.9% for AGIs $75k-100k, 79.7% for AGIs $100k-200k, 563.3% for AGIs over 200k)
Ordinary dividends: $3,189 (reported on 9.8% of returns)
Here:
$3,189
State:
$21,681
(% of AGI for various income ranges: 4.8% for AGIs below $25k, 12.5% for AGIs $25k-50k, 43.8% for AGIs $50k-75k, 34.1% for AGIs $75k-100k, 173.8% for AGIs $100k-200k, 1476.7% for AGIs over 200k)
Net capital gain/loss in AGI: +$10,723 (reported on 8.5% of returns)
Here:
+$10,723
State:
+$22,815
(% of AGI for various income ranges: 4.0% for AGIs below $25k, 18.2% for AGIs $25k-50k, 68.2% for AGIs $50k-75k, 36.9% for AGIs $75k-100k, 326.6% for AGIs $100k-200k, 8583.3% for AGIs over 200k)
Profit/loss from business: +$8,599 (reported on 15.5% of returns)
Here:
+$8,599
State:
+$9,743
(% of AGI for various income ranges: 139.1% for AGIs below $25k, 149.1% for AGIs $25k-50k, 93.2% for AGIs $50k-75k, 239.7% for AGIs $75k-100k, 406.2% for AGIs $100k-200k, 2380.0% for AGIs over 200k)
Taxable individual retirement arrangement distribution: $16,838 (reported on 6.3% of returns)
72086:
$16,838
Arkansas:
$18,502
(% of AGI for various income ranges: 21.2% for AGIs below $25k, 65.1% for AGIs $25k-50k, 203.4% for AGIs $50k-75k, 302.8% for AGIs $75k-100k, 740.0% for AGIs $100k-200k)
Total itemized deductions: $29,895 (reported on 4.6% of returns)
Here:
$29,895
State:
$52,840
(% of AGI for various income ranges: 78.3% for AGIs $25k-50k, 185.6% for AGIs $50k-75k, 387.6% for AGIs $75k-100k, 744.5% for AGIs $100k-200k, 4566.7% for AGIs over 200k)
Charity contributions: $12,394 (reported on 3.7% of returns)
Here:
$12,394
State:
$35,735
(% of AGI for various income ranges: 79.4% for AGIs $50k-75k, 72.1% for AGIs $75k-100k, 271.0% for AGIs $100k-200k, 2383.3% for AGIs over 200k)
Taxes paid: $6,467 (reported on 4.6% of returns)
72086:
$6,467
State:
$7,196
(% of AGI for various income ranges: 7.1% for AGIs $25k-50k, 31.0% for AGIs $50k-75k, 73.4% for AGIs $75k-100k, 203.8% for AGIs $100k-200k, 1120.0% for AGIs over 200k)
Earned income credit: $2,496 (reported on 20.7% of returns)
Here:
$2,496
State:
$2,546
(% of AGI for various income ranges: 135.2% for AGIs below $25k, 78.0% for AGIs $25k-50k)
Percentage of individuals using paid preparers for their 2020 taxes: 93.2%
Here:
93%
State:
94%
(% for various income ranges: 91.6% for AGIs below $25k, 94.8% for AGIs $25k-50k, 94.4% for AGIs $50k-75k, 93.3% for AGIs $75k-100k, 94.2% for AGIs $100k-200k, 88.9% for AGIs over 200k)
Averages for the 2012 tax year for zip code 72086, filed in 2013:
Average Adjusted Gross Income (AGI) in 2012: $45,535 (Individual Income Tax Returns)
Here:
$45,535
State:
$52,148
Salary/wage: $40,104 (reported on 87.6% of returns)
Here:
$40,104
State:
$41,669
(% of AGI for various income ranges: 80.8% for AGIs below $25k, 82.7% for AGIs $25k-50k, 80.7% for AGIs $50k-75k, 82.7% for AGIs $75k-100k, 76.8% for AGIs $100k-200k, 40.8% for AGIs over 200k)
Taxable interest for individuals: $952 (reported on 21.9% of returns)
This zip code:
$952
Arkansas:
$1,648
(% of AGI for various income ranges: 0.6% for AGIs below $25k, 0.4% for AGIs $25k-50k, 0.4% for AGIs $50k-75k, 0.4% for AGIs $75k-100k, 0.5% for AGIs $100k-200k, 0.8% for AGIs over 200k)
Ordinary dividends: $2,385 (reported on 10.4% of returns)
Here:
$2,385
State:
$20,675
(% of AGI for various income ranges: 0.6% for AGIs below $25k, 0.2% for AGIs $25k-50k, 0.3% for AGIs $50k-75k, 0.5% for AGIs $75k-100k, 1.1% for AGIs $100k-200k, 0.5% for AGIs over 200k)
Net capital gain/loss in AGI: +$7,782 (reported on 7.4% of returns)
Here:
+$7,782
State:
+$15,222
(% of AGI for various income ranges: 0.1% for AGIs $75k-100k, 5.7% for AGIs $100k-200k)
Profit/loss from business: +$8,942 (reported on 15.1% of returns)
Here:
+$8,942
State:
+$9,665
(% of AGI for various income ranges: 7.9% for AGIs below $25k, 2.6% for AGIs $25k-50k, 1.8% for AGIs $50k-75k, 1.7% for AGIs $75k-100k, 3.9% for AGIs $100k-200k)
Taxable individual retirement arrangement distribution: $12,319 (reported on 6.1% of returns)
72086:
$12,319
Arkansas:
$13,644
(% of AGI for various income ranges: 1.7% for AGIs below $25k, 1.3% for AGIs $25k-50k, 2.0% for AGIs $50k-75k, 1.6% for AGIs $75k-100k, 2.3% for AGIs $100k-200k)
Total itemized deductions: $18,639 (21% of AGI, reported on 24.6% of returns)
Here:
$18,639
State:
$23,276
Here:
21.1% of AGI
State:
19.1% of AGI
(% of AGI for various income ranges: 4.4% for AGIs below $25k, 7.5% for AGIs $25k-50k, 10.7% for AGIs $50k-75k, 11.3% for AGIs $75k-100k, 13.6% for AGIs $100k-200k, 11.1% for AGIs over 200k)
Charity contributions: $4,589 (reported on 18.7% of returns)
Here:
$4,589
State:
$5,996
(% of AGI for various income ranges: 0.6% for AGIs below $25k, 1.2% for AGIs $25k-50k, 1.9% for AGIs $50k-75k, 2.1% for AGIs $75k-100k, 2.7% for AGIs $100k-200k, 2.7% for AGIs over 200k)
Taxes paid: $5,917 (reported on 24.6% of returns)
72086:
$5,917
State:
$7,941
(% of AGI for various income ranges: 0.6% for AGIs below $25k, 1.5% for AGIs $25k-50k, 2.8% for AGIs $50k-75k, 3.5% for AGIs $75k-100k, 5.3% for AGIs $100k-200k, 5.9% for AGIs over 200k)
Earned income credit: $2,413 (reported on 24.4% of returns)
Here:
$2,413
State:
$2,455
(% of AGI for various income ranges: 8.4% for AGIs below $25k, 1.4% for AGIs $25k-50k)
Percentage of individuals using paid preparers for their 2012 taxes: 63.0%
Here:
63%
State:
61%
(% for various income ranges: 60.5% for AGIs below $25k, 62.9% for AGIs $25k-50k, 65.0% for AGIs $50k-75k, 64.3% for AGIs $75k-100k, 68.6% for AGIs $100k-200k, 80.0% for AGIs over 200k)
Averages for the 2004 tax year for zip code 72086, filed in 2005:
Average Adjusted Gross Income (AGI) in 2004: $36,449 (Individual Income Tax Returns)
Here:
$36,449
State:
$39,270
Salary/wage: $33,176 (reported on 87.7% of returns)
Here:
$33,176
State:
$34,079
(% of AGI for various income ranges: 115.5% for AGIs below $10k, 82.8% for AGIs $10k-25k, 83.4% for AGIs $25k-50k, 83.9% for AGIs $50k-75k, 81.6% for AGIs $75k-100k, 61.4% for AGIs over 100k)
Taxable interest for individuals: $1,226 (reported on 32.4% of returns)
This zip code:
$1,226
Arkansas:
$1,904
(% of AGI for various income ranges: 3.0% for AGIs below $10k, 1.1% for AGIs $10k-25k, 1.1% for AGIs $25k-50k, 0.7% for AGIs $50k-75k, 1.1% for AGIs $75k-100k, 1.4% for AGIs over 100k)
Taxable dividends: $2,456 (reported on 13.6% of returns)
Here:
$2,456
State:
$5,995
(% of AGI for various income ranges: 1.3% for AGIs below $10k, 0.4% for AGIs $10k-25k, 0.4% for AGIs $25k-50k, 0.4% for AGIs $50k-75k, 0.6% for AGIs $75k-100k, 2.8% for AGIs over 100k)
Net capital gain/loss: +$5,181 (reported on 11.4% of returns)
Here:
+$5,181
State:
+$10,430
(% of AGI for various income ranges: -1.6% for AGIs below $10k, 0.7% for AGIs $10k-25k, 0.5% for AGIs $25k-50k, 1.2% for AGIs $50k-75k, 1.2% for AGIs $75k-100k, 5.1% for AGIs over 100k)
Profit/loss from business: +$6,063 (reported on 15.9% of returns)
Here:
+$6,063
State:
+$7,823
(% of AGI for various income ranges: 11.3% for AGIs below $10k, 4.8% for AGIs $10k-25k, 2.8% for AGIs $25k-50k, 2.3% for AGIs $50k-75k, -0.1% for AGIs $75k-100k, 2.6% for AGIs over 100k)
IRA payment deduction: $3,541 (reported on 2.1% of returns)
72086:
$3,541
Arkansas:
$3,204
(% of AGI for various income ranges: 0.2% for AGIs $10k-25k, 0.3% for AGIs $25k-50k, 0.2% for AGIs $50k-75k, 0.3% for AGIs $75k-100k)
Total itemized deductions: $16,438 (24% of AGI, reported on 23.8% of returns)
Here:
$16,438
State:
$18,389
Here:
23.7% of AGI
State:
21.0% of AGI
(% of AGI for various income ranges: 8.9% for AGIs below $10k, 5.3% for AGIs $10k-25k, 8.1% for AGIs $25k-50k, 9.8% for AGIs $50k-75k, 13.4% for AGIs $75k-100k, 17.7% for AGIs over 100k)
Charity contributions deductions: $3,745 (5% of AGI, reported on 20.1% of returns)
Here:
$3,745
State:
$4,725
Here:
5.1% of AGI
State:
5.1% of AGI
(% of AGI for various income ranges: 0.8% for AGIs below $10k, 1.0% for AGIs $10k-25k, 1.7% for AGIs $25k-50k, 2.0% for AGIs $50k-75k, 2.6% for AGIs $75k-100k, 3.2% for AGIs over 100k)
Total tax: $4,460 (reported on 71.0% of returns)
72086:
$4,460
State:
$6,047
(% of AGI for various income ranges: 3.9% for AGIs below $10k, 3.5% for AGIs $10k-25k, 6.2% for AGIs $25k-50k, 8.5% for AGIs $50k-75k, 10.0% for AGIs $75k-100k, 15.8% for AGIs over 100k)
Earned income credit: $1,813 (reported on 23.1% of returns)
Here:
$1,813
State:
$1,909
Percentage of individuals using paid preparers for their 2004 taxes: 68.0%
Here:
68%
State:
67%
(% for various income ranges: 62.3% for AGIs below $10k, 71.8% for AGIs $10k-25k, 68.2% for AGIs $25k-50k, 67.5% for AGIs $50k-75k, 63.6% for AGIs $75k-100k, 78.6% for AGIs over 100k)
Household received Food Stamps/SNAP in the past 12 months: 514 Household did not receive Food Stamps/SNAP in the past 12 months: 4,089
Women who had a birth in the past 12 months: 162 (135 now married, 29 unmarried) Women who did not have a birth in the past 12 months: 2,747 (1,130 now married, 1,615 unmarried)
Housing units in zip code 72086 with a mortgage: 1,959 (53 second mortgage, 36 both second mortgage and home equity loan) Houses without a mortgage: 66
Median monthly owner costs for units with a mortgage: $1,134 Median monthly owner costs for units without a mortgage: $357
Residents with income below the poverty level in 2022:
This zip code:
13.4%
Whole state:
16.8%
Residents with income below 50% of the poverty level in 2022:
This zip code:
8.7%
Whole state:
8.5%
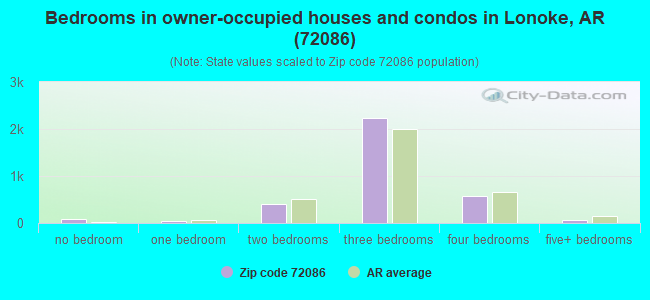
Median number of rooms in houses and condos:
Here:
6.0
State:
6.1
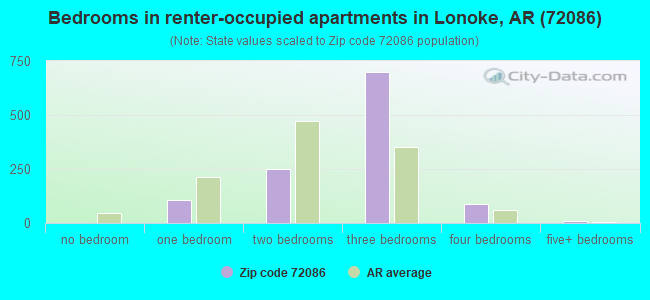
Median number of rooms in apartments:
Here:
5.0
State:
4.3
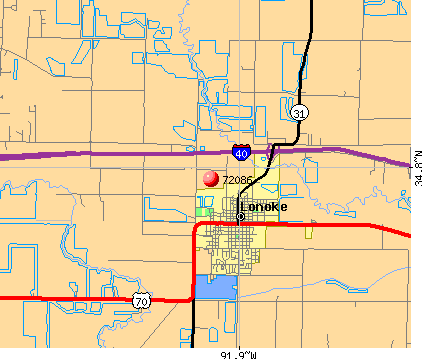
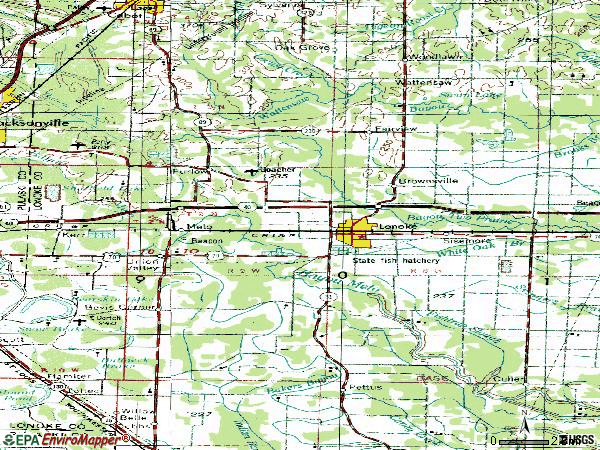
Notable locations in this zip code not listed on our city pages
Notable locations in zip code 72086: Hogan State Fish Hatchery (A), Lonoke Police Department (B), Lonoke County Sheriff's Office (C), South Bend Fire Department Station 2 (D), South Bend Fire Department Station 3 (E), Lonoke County Courthouse (F), Lonoke Nursing Home (G), Lonoke City Hall (H), Tri - Community Volunteer Fire Department Station 2 (I), Campground Sylvania and Mount Zion Volunteer Fire Department 2 (J), Metropolitan Emergency Medical Service - Lonoke (K), Lonoke Volunteer Fire Station (L). Display/hide their locations on the map
Churches in zip code 72086 include: Brownsville Church (A), Concord Church (B), Bethlehem Church (C), Bell Grove Church (D), Bethel African Methodist Episcopal Church (E), Church of Christ (F), Eastside Baptist Church (G), First Assembly of God Church (H), First Presbyterian Church (I). Display/hide their locations on the map
Cemeteries: Beard Cemetery (1), Glover Cemetery (2), Sunset Memorial Gardens (3), Hicks Cemetery (4), Hester Cemetery (5), Brownsville Cemetery (6), Legate Cemetery (7). Display/hide their locations on the map
In group quarters: 359 (-1 institutionalized population)
Size of family households: 1,146 2-persons, 586 3-persons, 449 4-persons, 493 5-persons, 113 6-persons
Size of nonfamily households: 1,675 1-person, 133 2-persons, 7 3-persons
1,725 married couples with children.
393 single-parent households (61 men, 332 women).
92.8% of residents of 72086 zip code speak English at home.
6.1% of residents speak Spanish at home (81% very well, 9% well, 10% not well).
0.2% of residents speak other Indo-European language at home (100% very well).
0.7% of residents speak Asian or Pacific Island language at home (70% very well, 22% well, 8% not well).
Foreign born population: 507 (4.3%) (52.5% of them are naturalized citizens)
This zip code:
4.3%
Whole state:
5.1%
77%Honduras
10%Micronesia
2%France
2%Nicaragua
2%Indonesia
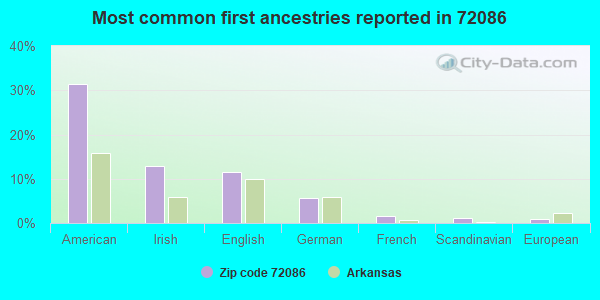
31%American
13%Irish
12%English
6%German
2%French
1%Scandinavian
1%European
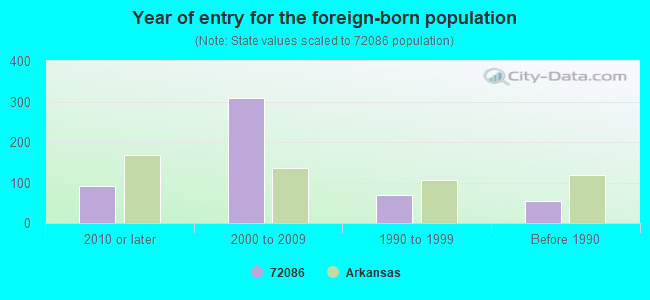
Year of entry for the foreign-born population
922010 or later
3092000 to 2009
701990 to 1999
54Before 1990
Major facilities with environmental interests located in this zip code:
BP SPEEDY MART #504 (1021 N CENTER in LONOKE, AR)
(Integrated Compliance Information System) - ICIS-06-1999-0227, FORMAL ENFORCEMENT ACTION STATE MASTER (PDS) - RST-43000082, UNDERGROUND STORAGE TANK PROGRAM Business SIC classification: GROCERY STORES; GASOLINE SERVICE STATIONS Organizations: SOUTH ARKANSAS PETROLEUM CO INC (CONTACT/GENERAL)
(Integrated Compliance Information System) - ICIS-06-1999-0504, FORMAL ENFORCEMENT ACTION STATE MASTER (PDS) - RST-43000023, FACILITY Business SIC classification: GROCERY STORES; GASOLINE SERVICE STATIONS Organizations: COULSON OIL CO INC (CONTACT/GENERAL)
FAYE WHITE REALTY (420 N. CENTER STREET in LONOKE, AR)
ENFORCEMENT/COMPLIANCE ACTIVITY (Integrated Compliance Information System) - ICIS-06-2003-0755, FORMAL ENFORCEMENT ACTION (Integrated Compliance Information System) - ICIS-06-2003-0755, FORMAL ENFORCEMENT ACTION Business SIC classification: REAL ESTATE AGENTS AND MANAGERS
LONOKE, CITY OF (1219 BARNES ST & HWY 31 N in LONOKE, AR)
National Pollutant Discharge Elimination System NON-MAJOR (Tracking pollutant discharge elimination systems) - permit STATE MASTER (PDS) - WATER-AR0034746, National Pollutant Discharge Elimination System Permit, RST-43001606, FACILITY Business SIC classification: SEWERAGE SYSTEMS
CABOT WATER TREATMENT PLANT (1126 HIGHWAY 236 EAST in LONOKE, AR)
National Pollutant Discharge Elimination System NON-MAJOR (Tracking pollutant discharge elimination systems) - permit STATE MASTER (PDS) - WATER-ARG640142, NPDES GENERAL PERMIT, National Pollutant Discharge Elimination System Permit Business SIC classification: WATER SUPPLY Alternative names: CABOT, CITY OF-PWTP, CABOT, CITY OF-WATER DEPT.
LONOKE PRIMARY SCHOOL (800 LINCOLN STREET in LONOKE, AR)
(Geographic Names Information System) ENFORCEMENT/COMPLIANCE ACTIVITY (Integrated Compliance Information System) (National Center for Education Statistics) - STATE ID-4301030
LONOKE ELEMENTARY SCHOOL (900 W. PALM ST. in LONOKE, AR)
(Geographic Names Information System) (National Center for Education Statistics) - STATE ID-4301027
LONOKE HIGH SCHOOL (501 W. ACADEMY ST in LONOKE, AR)
(Geographic Names Information System) (National Center for Education Statistics) - STATE ID-4301029
LONOKE MIDDLE SCHOOL (200 E. LOCUST ST in LONOKE, AR)
(Geographic Names Information System) (National Center for Education Statistics) - STATE ID-4301028
ARKANSAS GAME & FISH COMM (23 JOE HOGAN LN in LONOKE, AR)
(Integrated Compliance Information System) - ICIS-06-2000-0561, FORMAL ENFORCEMENT ACTION Business SIC classification: HUNTING AND TRAPPING, AND GAME PROPAGATION
AMERICAN TEL & TEL CO LONG LINES (.4M S LONOKE in LONOKE, AR)
(Resource Conservation and Recovery Act (tracking hazardous waste))
EXXON CO USA 50728 (2101 CENTER ST in LONOKE, AR)
(Resource Conservation and Recovery Act (tracking hazardous waste))
JAMES DX TRAVELMART (I40 & HWY 31N in LONOKE, AR)
(Resource Conservation and Recovery Act (tracking hazardous waste)) Organizations: JAMES WILLIAM-H (CONTACT/OWNER)
Housing units lacking complete plumbing facilities: 2.6% Housing units lacking complete kitchen facilities: 3.4%
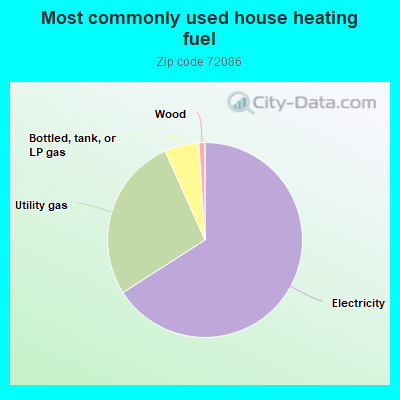
65.8%Electricity
27.3%Utility gas
5.7%Bottled, tank, or LP gas
1.0%Wood
Population in 1990: 6,733. Population change in the 1990s: +3,387 (+50.3%).
Place of birth for U.S.-born residents:
This state: 9,135
Northeast: 131
Midwest: 525
South: 1,046
West: 409
59% of the 72086 zip code residents lived in the same house 5 years ago. Out of people who lived in different houses, 58% lived in this county. Out of people who lived in different counties, 50% lived in Arkansas.
89% of the 72086 zip code residents lived in the same house 1 year ago. Out of people who lived in different houses, 59% moved from this county. Out of people who lived in different houses, 31% moved from different county within same state. Out of people who lived in different houses, 4% moved from different state.
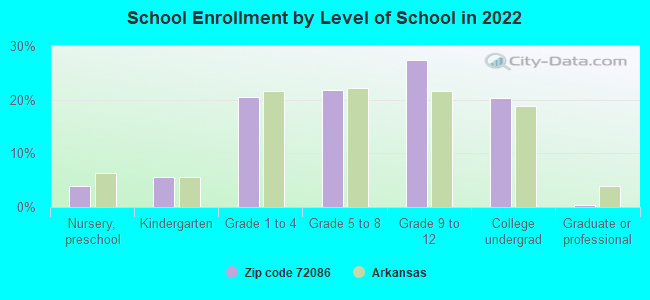
Private vs. public school enrollment:
Students in private schools in grades 1 to 8 (elementary and middle school): 81
Here:
8.5%
Arkansas:
10.5%
Students in private schools in grades 9 to 12 (high school): 38
Here:
6.2%
Arkansas:
8.7%
Students in private undergraduate colleges: 11
Here:
2.6%
Arkansas:
19.4%
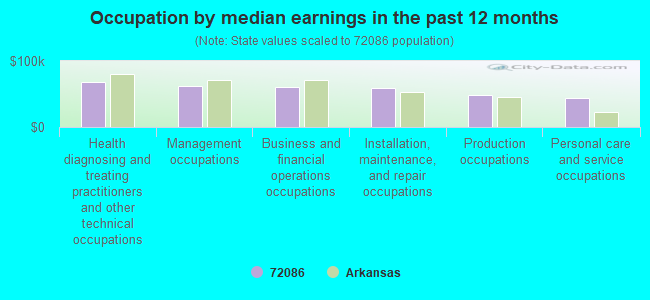
Occupation by median earnings in the past 12 months ($)
68,753Health diagnosing and treating practitioners and other technical occupations
62,575Management occupations
60,681Business and financial operations occupations
59,506Installation, maintenance, and repair occupations
48,594Production occupations
44,493Personal care and service occupations
Companies with federal contracts located in this zip code (LONOKE, AR):
MURIEL PENNINGTON (416 WEST ACADEMY; small business) : $27,755 in 10 contractsfrom 2002 to 2004
Contracts for Facilities Operations Support Services by U.S. Army Corps of Engineers - civil program financing only, Army Signed by year:2000: $0; 2001: $0; 2002: $1,625; 2003: $26,390; 2004: -$260; 2005: $0; 2006: $0.
Biggest contracts:
$12,090 with U.S. Army Corps of Engineers - civil program financing only for Facilities Operations Support Services. Signed on 2003-03-18. Completion date: 2003-09-30.
$11,635, same as above.Signed on 2003-09-18. Completion date: 2003-09-30.
$1,495, same as above.Signed on 2003-10-27. Completion date: 2003-09-30.
$1,495 with Army for Facilities Operations Support Services. Signed on 2003-10-27. Completion date: 2003-09-30.
HOPPER STEPHENS HATCHERIES INC (989 JOHNSON RD; small business) : $10,600 in 2 contractsfrom 2004 to 2006
$6,600 with Army for Live Animals, Raised for Food. Signed on 2006-03-23. Completion date: 2006-04-20.
$4,000, same as above.Signed on 2004-05-06. Completion date: 2004-05-17.
PERRY''S MOTEL & RESTAURANT (55 ACCESS RD; small business)
$9,450 with Army for Food Items For Resale. Signed on 2003-10-31. Completion date: 2003-10-23.
BARNHILL ORCHARDS INC (277 SANDHILL RD; small business)
$2,950 with Defense Logistics Agency for Fruits and Vegetables. Signed on 2005-07-20. Completion date: 2005-07-20.
TOMPKINS, CLAYTON (112 N E 8TH ST) : $0 in 4 contractsin 2005
$9,648 with U.S. Army Corps of Engineers - civil program financing only for Operation of Government-Owned Facilities -- Recreation Facilities (Non-Building). Signed on 2005-03-14. Completion date: 2005-11-01.
$9,648 with Army for Operation of Government-Owned Facilities -- Recreation Facilities (Non-Building). Signed on 2005-03-14. Completion date: 2005-11-01.
-$9,648, same as above.Signed on 2005-04-06. Completion date: 2005-11-01.
-$9,648 with U.S. Army Corps of Engineers - civil program financing only for Operation of Government-Owned Facilities -- Recreation Facilities (Non-Building). Signed on 2005-04-06. Completion date: 2005-11-01.
Top industries in this zip code by the number of employees in 2005:
2002 - 2018 National Fire Incident Reporting System (NFIRS) incidents
According to the data from the years 2002 - 2018 the average number of fires per year is 99. The highest number of reported fire incidents - 151 took place in 2012, and the least - 6 in 2003. The data has an increasing trend.
When looking into fire subcategories, the most reports belonged to: Outside Fires (54.2%), and Structure Fires (28.5%).
Fire incident types reported to NFIRS in Zip Code 72086
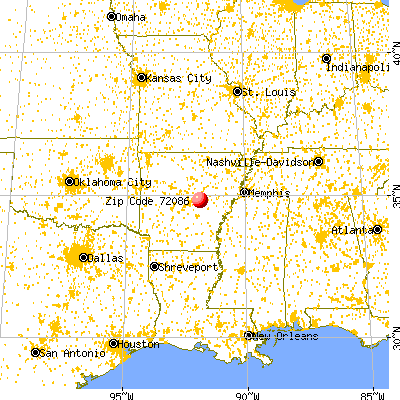


 Nearest zip codes: 72024, 72142, 72176, 72007, 72023, 72083.
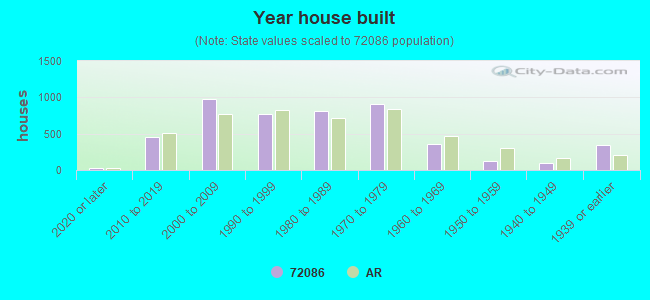


 According to the data from the years 2002 - 2018 the average number of fires per year is 99. The highest number of reported fire incidents - 151 took place in 2012, and the least - 6 in 2003. The data has an increasing trend.
 When looking into fire subcategories, the most reports belonged to: Outside Fires (54.2%), and Structure Fires (28.5%).