Estimated zip code population in 2022: 40,641 Zip code population in 2010: 38,455 Zip code population in 2000: 36,200
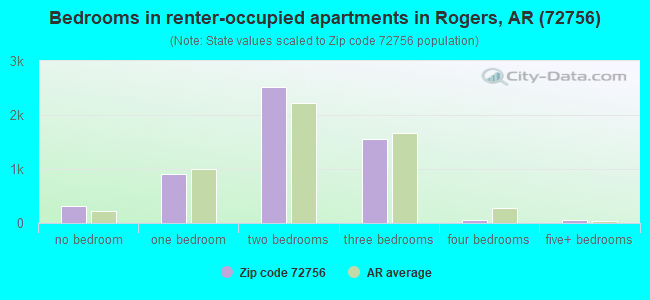
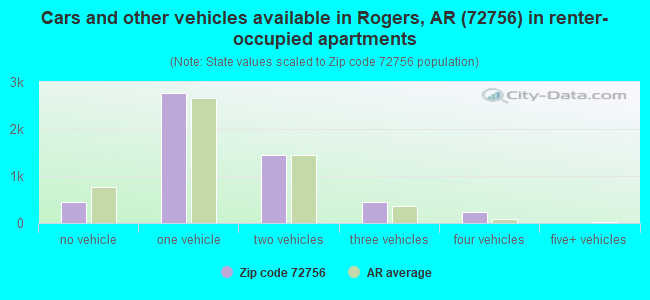
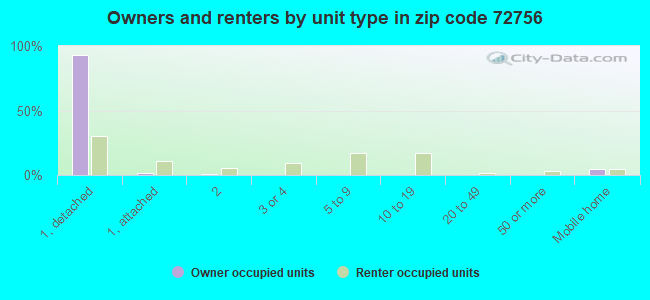
Houses and condos: 17,040 Renter-occupied apartments: 5,417
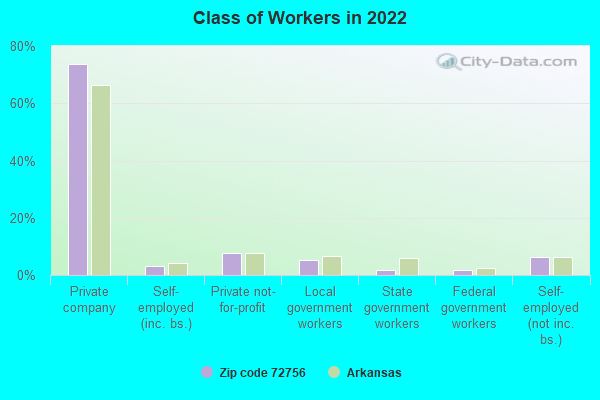
% of renters here:
35%
State:
34%
March 2022 cost of living index in zip code 72756: 82.2 (low, U.S. average is 100)
Land area: 139.3 sq. mi. Water area: 15.5 sq. mi.
Population density: 292 people per square mile
(very low).
OSM Map
General Map
Google Map
MSN Map
OSM Map
General Map
Google Map
MSN Map
OSM Map
General Map
Google Map
MSN Map
OSM Map
General Map
Google Map
MSN Map
Please wait while loading the map...
Real estate property taxes paid for housing units in 2022:
This zip code:
0.5% ($1,292)
Arkansas:
0.5% ($977)
Median real estate property taxes paid for housing units with mortgages in 2022: $1,338 (0.5%) Median real estate property taxes paid for housing units with no mortgage in 2022: $1,257 (0.5%)
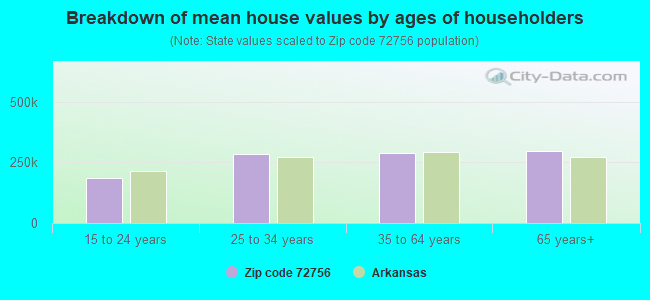
Estimated median house/condo value in 2022: $238,036
72756:
$238,036
Arkansas:
$179,800
According to our research of Arkansas and other state lists, there were 55 registered sex offenders living in 72756 zip code as of April 27, 2024. The ratio of all residents to sex offenders in zip code 72756 is 741 to 1. The ratio of registered sex offenders to all residents in this zip code is lower than the state average.
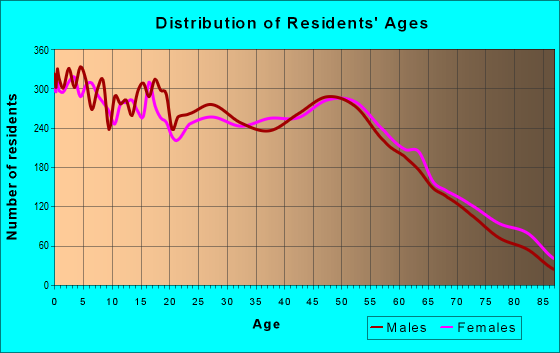
Median resident age:
This zip code:
38.7 years
Arkansas median age:
38.9 years
Average household size:
This zip code:
2.6 people
Arkansas:
2.4 people
Averages for the 2020 tax year for zip code 72756, filed in 2021:
Average Adjusted Gross Income (AGI) in 2020: $59,616 (Individual Income Tax Returns)
Here:
$59,616
State:
$64,872
Salary/wage: $51,351 (reported on 83.5% of returns)
Here:
$51,351
State:
$50,644
(% of AGI for various income ranges: 1313.9% for AGIs below $25k, 3836.1% for AGIs $25k-50k, 7064.8% for AGIs $50k-75k, 10059.1% for AGIs $75k-100k, 19464.1% for AGIs $100k-200k, 74096.7% for AGIs over 200k)
Taxable interest for individuals: $1,717 (reported on 23.8% of returns)
This zip code:
$1,717
Arkansas:
$1,857
(% of AGI for various income ranges: 12.4% for AGIs below $25k, 16.8% for AGIs $25k-50k, 32.7% for AGIs $50k-75k, 65.6% for AGIs $75k-100k, 162.9% for AGIs $100k-200k, 1499.6% for AGIs over 200k)
Ordinary dividends: $5,966 (reported on 16.1% of returns)
Here:
$5,966
State:
$21,681
(% of AGI for various income ranges: 18.8% for AGIs below $25k, 26.0% for AGIs $25k-50k, 76.5% for AGIs $50k-75k, 153.7% for AGIs $75k-100k, 425.4% for AGIs $100k-200k, 3802.9% for AGIs over 200k)
Net capital gain/loss in AGI: +$17,347 (reported on 14.3% of returns)
Here:
+$17,347
State:
+$22,815
(% of AGI for various income ranges: 4.9% for AGIs below $25k, 27.7% for AGIs $25k-50k, 79.0% for AGIs $50k-75k, 194.8% for AGIs $75k-100k, 719.0% for AGIs $100k-200k, 14576.7% for AGIs over 200k)
Profit/loss from business: +$11,849 (reported on 16.5% of returns)
Here:
+$11,849
State:
+$9,743
(% of AGI for various income ranges: 199.2% for AGIs below $25k, 219.3% for AGIs $25k-50k, 281.7% for AGIs $50k-75k, 313.1% for AGIs $75k-100k, 580.9% for AGIs $100k-200k, 1867.1% for AGIs over 200k)
Taxable individual retirement arrangement distribution: $21,552 (reported on 7.1% of returns)
72756:
$21,552
Arkansas:
$18,502
(% of AGI for various income ranges: 47.7% for AGIs below $25k, 74.6% for AGIs $25k-50k, 193.1% for AGIs $50k-75k, 373.7% for AGIs $75k-100k, 988.0% for AGIs $100k-200k, 2807.1% for AGIs over 200k)
Self-employed (Keogh) retirement plans: $28,867 (reported on 0.2% of returns)
72756:
$28,867
Arkansas:
$24,438
(% of AGI for various income ranges: 88.4% for AGIs $100k-200k)
Total itemized deductions: $35,681 (reported on 5.8% of returns)
Here:
$35,681
State:
$52,840
(% of AGI for various income ranges: 26.5% for AGIs below $25k, 52.8% for AGIs $25k-50k, 131.0% for AGIs $50k-75k, 341.0% for AGIs $75k-100k, 1168.2% for AGIs $100k-200k, 7641.7% for AGIs over 200k)
Charity contributions: $16,285 (reported on 4.6% of returns)
Here:
$16,285
State:
$35,735
(% of AGI for various income ranges: 2.7% for AGIs below $25k, 9.0% for AGIs $25k-50k, 22.9% for AGIs $50k-75k, 77.0% for AGIs $75k-100k, 344.7% for AGIs $100k-200k, 3769.2% for AGIs over 200k)
Taxes paid: $7,519 (reported on 5.8% of returns)
72756:
$7,519
State:
$7,196
(% of AGI for various income ranges: 3.1% for AGIs below $25k, 6.7% for AGIs $25k-50k, 25.9% for AGIs $50k-75k, 82.3% for AGIs $75k-100k, 320.1% for AGIs $100k-200k, 1408.3% for AGIs over 200k)
Earned income credit: $2,541 (reported on 20.2% of returns)
Here:
$2,541
State:
$2,546
(% of AGI for various income ranges: 119.6% for AGIs below $25k, 87.9% for AGIs $25k-50k, 1.6% for AGIs $50k-75k)
Percentage of individuals using paid preparers for their 2020 taxes: 94.1%
Here:
94%
State:
94%
(% for various income ranges: 93.0% for AGIs below $25k, 94.9% for AGIs $25k-50k, 94.7% for AGIs $50k-75k, 94.2% for AGIs $75k-100k, 94.8% for AGIs $100k-200k, 94.9% for AGIs over 200k)
Averages for the 2012 tax year for zip code 72756, filed in 2013:
Average Adjusted Gross Income (AGI) in 2012: $49,219 (Individual Income Tax Returns)
Here:
$49,219
State:
$52,148
Salary/wage: $42,584 (reported on 86.4% of returns)
Here:
$42,584
State:
$41,669
(% of AGI for various income ranges: 79.9% for AGIs below $25k, 84.1% for AGIs $25k-50k, 79.9% for AGIs $50k-75k, 75.5% for AGIs $75k-100k, 77.2% for AGIs $100k-200k, 56.3% for AGIs over 200k)
Taxable interest for individuals: $1,443 (reported on 24.5% of returns)
This zip code:
$1,443
Arkansas:
$1,648
(% of AGI for various income ranges: 0.8% for AGIs below $25k, 0.5% for AGIs $25k-50k, 0.6% for AGIs $50k-75k, 0.8% for AGIs $75k-100k, 0.8% for AGIs $100k-200k, 0.8% for AGIs over 200k)
Ordinary dividends: $4,385 (reported on 18.1% of returns)
Here:
$4,385
State:
$20,675
(% of AGI for various income ranges: 1.1% for AGIs below $25k, 0.9% for AGIs $25k-50k, 1.2% for AGIs $50k-75k, 1.5% for AGIs $75k-100k, 1.5% for AGIs $100k-200k, 3.0% for AGIs over 200k)
Net capital gain/loss in AGI: +$8,240 (reported on 14.5% of returns)
Here:
+$8,240
State:
+$15,222
(% of AGI for various income ranges: 0.3% for AGIs $25k-50k, 0.7% for AGIs $50k-75k, 0.9% for AGIs $75k-100k, 1.9% for AGIs $100k-200k, 8.5% for AGIs over 200k)
Profit/loss from business: +$8,838 (reported on 15.3% of returns)
Here:
+$8,838
State:
+$9,665
(% of AGI for various income ranges: 8.8% for AGIs below $25k, 2.6% for AGIs $25k-50k, 2.0% for AGIs $50k-75k, 2.1% for AGIs $75k-100k, 2.5% for AGIs $100k-200k, 0.6% for AGIs over 200k)
Taxable individual retirement arrangement distribution: $13,929 (reported on 8.1% of returns)
72756:
$13,929
Arkansas:
$13,644
(% of AGI for various income ranges: 2.3% for AGIs below $25k, 1.9% for AGIs $25k-50k, 2.2% for AGIs $50k-75k, 3.0% for AGIs $75k-100k, 3.0% for AGIs $100k-200k, 1.5% for AGIs over 200k)
Self-employment retirement plans: $22,675 (reported on 0.2% of returns)
72756:
$22,675
Arkansas:
$20,153
Total itemized deductions: $23,248 (21% of AGI, reported on 25.0% of returns)
Here:
$23,248
State:
$23,276
Here:
21.1% of AGI
State:
19.1% of AGI
(% of AGI for various income ranges: 6.4% for AGIs below $25k, 7.8% for AGIs $25k-50k, 10.3% for AGIs $50k-75k, 13.3% for AGIs $75k-100k, 14.7% for AGIs $100k-200k, 15.5% for AGIs over 200k)
Charity contributions: $5,255 (reported on 18.9% of returns)
Here:
$5,255
State:
$5,996
(% of AGI for various income ranges: 0.6% for AGIs below $25k, 1.2% for AGIs $25k-50k, 1.7% for AGIs $50k-75k, 2.4% for AGIs $75k-100k, 2.7% for AGIs $100k-200k, 2.9% for AGIs over 200k)
Taxes paid: $8,100 (reported on 24.7% of returns)
72756:
$8,100
State:
$7,941
(% of AGI for various income ranges: 1.0% for AGIs below $25k, 1.5% for AGIs $25k-50k, 3.5% for AGIs $50k-75k, 4.1% for AGIs $75k-100k, 5.8% for AGIs $100k-200k, 6.6% for AGIs over 200k)
Earned income credit: $2,511 (reported on 24.2% of returns)
Here:
$2,511
State:
$2,455
(% of AGI for various income ranges: 7.9% for AGIs below $25k, 1.6% for AGIs $25k-50k)
Percentage of individuals using paid preparers for their 2012 taxes: 63.5%
Here:
64%
State:
61%
(% for various income ranges: 61.7% for AGIs below $25k, 64.7% for AGIs $25k-50k, 64.5% for AGIs $50k-75k, 61.9% for AGIs $75k-100k, 65.7% for AGIs $100k-200k, 75.6% for AGIs over 200k)
Averages for the 2004 tax year for zip code 72756, filed in 2005:
Average Adjusted Gross Income (AGI) in 2004: $44,691 (Individual Income Tax Returns)
Here:
$44,691
State:
$39,270
Salary/wage: $38,533 (reported on 85.6% of returns)
Here:
$38,533
State:
$34,079
(% of AGI for various income ranges: 123.9% for AGIs below $10k, 81.9% for AGIs $10k-25k, 84.3% for AGIs $25k-50k, 79.1% for AGIs $50k-75k, 79.4% for AGIs $75k-100k, 59.9% for AGIs over 100k)
Taxable interest for individuals: $1,756 (reported on 33.0% of returns)
This zip code:
$1,756
Arkansas:
$1,904
(% of AGI for various income ranges: 5.7% for AGIs below $10k, 1.9% for AGIs $10k-25k, 1.0% for AGIs $25k-50k, 1.3% for AGIs $50k-75k, 1.0% for AGIs $75k-100k, 1.2% for AGIs over 100k)
Taxable dividends: $3,150 (reported on 23.4% of returns)
Here:
$3,150
State:
$5,995
(% of AGI for various income ranges: 4.5% for AGIs below $10k, 1.1% for AGIs $10k-25k, 0.8% for AGIs $25k-50k, 1.2% for AGIs $50k-75k, 1.2% for AGIs $75k-100k, 2.5% for AGIs over 100k)
Net capital gain/loss: +$15,221 (reported on 19.6% of returns)
Here:
+$15,221
State:
+$10,430
(% of AGI for various income ranges: -0.4% for AGIs below $10k, 0.7% for AGIs $10k-25k, 0.7% for AGIs $25k-50k, 1.9% for AGIs $50k-75k, 2.4% for AGIs $75k-100k, 15.2% for AGIs over 100k)
Profit/loss from business: +$8,788 (reported on 14.9% of returns)
Here:
+$8,788
State:
+$7,823
(% of AGI for various income ranges: 7.2% for AGIs below $10k, 5.0% for AGIs $10k-25k, 3.0% for AGIs $25k-50k, 1.9% for AGIs $50k-75k, 2.2% for AGIs $75k-100k, 2.8% for AGIs over 100k)
IRA payment deduction: $3,200 (reported on 2.0% of returns)
72756:
$3,200
Arkansas:
$3,204
(% of AGI for various income ranges: 0.3% for AGIs below $10k, 0.1% for AGIs $10k-25k, 0.2% for AGIs $25k-50k, 0.2% for AGIs $50k-75k, 0.2% for AGIs $75k-100k, 0.1% for AGIs over 100k)
Self-employed pension: $12,617 (reported on 0.3% of returns)
Here:
$12,617
Arkansas:
$14,742
Total itemized deductions: $20,349 (21% of AGI, reported on 28.1% of returns)
Here:
$20,349
State:
$18,389
Here:
21.3% of AGI
State:
21.0% of AGI
(% of AGI for various income ranges: 16.3% for AGIs below $10k, 6.6% for AGIs $10k-25k, 9.3% for AGIs $25k-50k, 12.4% for AGIs $50k-75k, 15.3% for AGIs $75k-100k, 15.9% for AGIs over 100k)
Charity contributions deductions: $4,932 (5% of AGI, reported on 23.5% of returns)
Here:
$4,932
State:
$4,725
Here:
4.9% of AGI
State:
5.1% of AGI
(% of AGI for various income ranges: 1.0% for AGIs below $10k, 0.8% for AGIs $10k-25k, 1.5% for AGIs $25k-50k, 2.2% for AGIs $50k-75k, 2.8% for AGIs $75k-100k, 3.9% for AGIs over 100k)
Total tax: $7,019 (reported on 71.0% of returns)
72756:
$7,019
State:
$6,047
(% of AGI for various income ranges: 4.0% for AGIs below $10k, 3.7% for AGIs $10k-25k, 5.8% for AGIs $25k-50k, 8.5% for AGIs $50k-75k, 10.2% for AGIs $75k-100k, 18.0% for AGIs over 100k)
Earned income credit: $1,861 (reported on 20.6% of returns)
Here:
$1,861
State:
$1,909
Percentage of individuals using paid preparers for their 2004 taxes: 69.7%
Here:
70%
State:
67%
(% for various income ranges: 61.7% for AGIs below $10k, 74.7% for AGIs $10k-25k, 71.6% for AGIs $25k-50k, 67.9% for AGIs $50k-75k, 61.3% for AGIs $75k-100k, 72.0% for AGIs over 100k)
Likely homosexual households (counted as self-reported same-sex unmarried-partner households)
Lesbian couples: 0.0% of all households
Gay men: 0.3% of all households
Household received Food Stamps/SNAP in the past 12 months: 992 Household did not receive Food Stamps/SNAP in the past 12 months: 14,588
Women who had a birth in the past 12 months: 366 (243 now married, 123 unmarried) Women who did not have a birth in the past 12 months: 9,252 (4,048 now married, 5,202 unmarried)
Housing units in zip code 72756 with a mortgage: 5,981 (357 second mortgage, 242 both second mortgage and home equity loan) Houses without a mortgage: 25
Median monthly owner costs for units with a mortgage: $1,261 Median monthly owner costs for units without a mortgage: $447
Residents with income below the poverty level in 2022:
This zip code:
12.6%
Whole state:
16.8%
Residents with income below 50% of the poverty level in 2022:
This zip code:
8.5%
Whole state:
8.5%
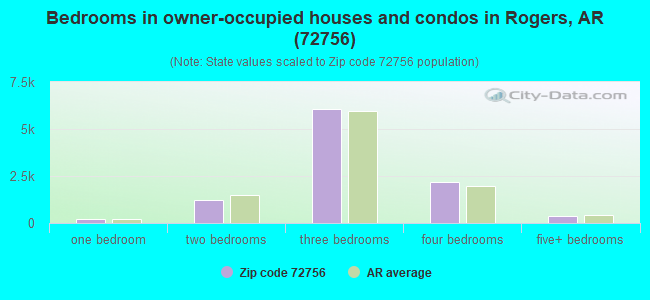
Median number of rooms in houses and condos:
Here:
6.2
State:
6.1
Median number of rooms in apartments:
Here:
3.9
State:
4.3
Notable locations in this zip code not listed on our city pages
5,762 married couples with children.
1,989 single-parent households (424 men, 1,565 women).
75.6% of residents of 72756 zip code speak English at home.
24.3% of residents speak Spanish at home (54% very well, 14% well, 18% not well, 14% not at all).
0.2% of residents speak other Indo-European language at home (69% very well, 9% well, 22% not well).
0.8% of residents speak Asian or Pacific Island language at home (30% very well, 30% well, 23% not well, 17% not at all).
0.1% of residents speak other language at home (100% very well).
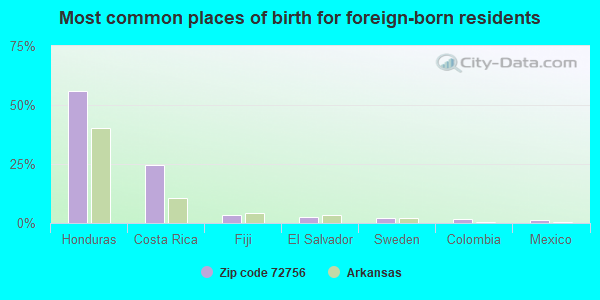
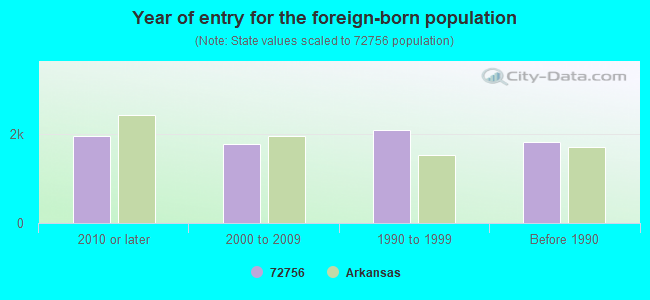
Foreign born population: 7,172 (17.6%) (29.5% of them are naturalized citizens)
Major facilities with environmental interests located in this zip code:
GLAD MANUFACTURING COMPANY (1700 NORTH 13TH STREET in ROGERS, AR)
AIR MINOR (AIRS/AFS) CRITERIA AND HAZARDOUS AIR POLLUTANT INVENTORY (Inventory of air pollution sources) STATE MASTER (PDS) - AIR-0407-AR-3, AIR PROGRAM, AIR-0407-AR-4, AIR-0407-AR-5, AIR-0407-AR-6, AIR MINOR, AIR-0407-AR-7, AIR-0407-AR-8, WATER-ARR00A175, NPDES STORMWATER PERMIT, RST-04000068, FACILITY HAZARDOUS WASTE BIENNIAL REPORTER (Resource Conservation and Recovery Act (tracking hazardous waste)) Small Quantity Generators, between 100 kg and 1000 kg of hazardous waste/month (Resource Conservation and Recovery Act (tracking hazardous waste)) - notification Business SIC classification: PLASTICS, FOIL, AND COATED PAPER BAGS Business NAICS classification: UNSUPPORTED PLASTICS BAG MANUFACTURING. Organizations: FIRST BRANDS CORP. (CONTACT/GENERAL)
, THE CLOROX COMPANY (CONTACT/OPERATOR)
, PAUL SIEDSMA (CONTACT/OPERATOR)
Alternative names: FIRST BRANDS CORPORATION
MAFCO (1203 N. 6TH ST. in ROGERS, AR)
AIR MINOR (AIRS/AFS) CRITERIA AND HAZARDOUS AIR POLLUTANT INVENTORY (Inventory of air pollution sources) STATE MASTER (PDS) - AIR-1487-AR-1, AIR PROGRAM, AIR-1487-AR-2, AIR-1487-AR-3, AIR MINOR, WATER-ARR00A534, NPDES STORMWATER PERMIT, WATER-ARR00B857, AIR-1487-A, AIR PROGRAM HAZARDOUS WASTE BIENNIAL REPORTER (Resource Conservation and Recovery Act (tracking hazardous waste)) Small Quantity Generators, between 100 kg and 1000 kg of hazardous waste/month (Resource Conservation and Recovery Act (tracking hazardous waste)) - notification TRI REPORTER (Tracking of toxic chemicals releasing facilities) Business SIC classification: FABRICATED METAL PRODUCTS Business NAICS classification: OTHER METAL CONTAINER MANUFACTURING.; ELECTROPLATING, PLATING, POLISHING, ANODIZING, AND COLORING.; INDUSTRIAL VALVE MANUFACTURING.; ALL OTHER MISCELLANEOUS FABRICATED METAL PRODUCT MANUFACTURING. Organizations: MAFCO INC (CONTACT/OPERATOR)
, RL BROWN (CONTACT/OWNER)
Alternative names: MAFCO INC.
EMERSON ELECTRIC COMPANY (1315 N. 13TH in ROGERS, AR)
AIR SYNTHETIC MINOR (AIRS/AFS) CRITERIA AND HAZARDOUS AIR POLLUTANT INVENTORY (Inventory of air pollution sources) STATE MASTER (PDS) - AIR-1005-A, AIR PROGRAM, AIR-1005-AR-1, AIR-1005-AR-2, AIR-1005-AR-3, AIR-1005-AR-4, AIR MINOR, AIR-1005-AR-5, AIR-1005-AR-6, WATER-ARR00A808, NPDES STORMWATER PERMIT, AIR-0191-I, INCINERATOR, RST-04000062, FACILITY HAZARDOUS WASTE BIENNIAL REPORTER (Resource Conservation and Recovery Act (tracking hazardous waste)) (Resource Conservation and Recovery Act (tracking hazardous waste)) TRI REPORTER (Tracking of toxic chemicals releasing facilities) Business SIC classification: MOTORS AND GENERATORS Business NAICS classification: MOTOR AND GENERATOR MANUFACTURING.; MOTOR AND GENERATOR MANUFACTURING. Organizations: EMERSON MOTOR COMPANY (CONTACT/GENERAL)
BEAVER LAKE AVIATION #8038 (1 CASS HOUGH DR in ROGERS, AR)
National Pollutant Discharge Elimination System NON-MAJOR (Tracking pollutant discharge elimination systems) - permit STATE MASTER (PDS) - RST-04001686, UNDERGROUND STORAGE TANK PROGRAM, WATER-ARG340074, National Pollutant Discharge Elimination System Permit, RST-04000152, FACILITY Conditionally Exempt Small Quantity Generators, less than 100 kg/month of hazardous waste (Resource Conservation and Recovery Act (tracking hazardous waste)) Business SIC classification: AIRPORTS, FLYING FIELDS, AND AIRPORT TERMINAL SERVICES Business NAICS classification: OTHER AIRPORT OPERATIONS. Organizations: WAL-MART STORES INC (CONTACT/GENERAL)
, WAL-MART STORES EAST LP (CONTACT/OPERATOR)
Alternative names: BEAVER LAKE AVIATION FACILITY 8038, FUEL FARM #8005, WAL-MART STORES, INC
CHICK-N-QUICK - TYSON FOODS, INC. (110 W. OLRICH STREET in ROGERS, AR)
ENFORCEMENT/COMPLIANCE ACTIVITY (Integrated Compliance Information System) - ICIS-06-1999-0742, FORMAL ENFORCEMENT ACTION (Integrated Compliance Information System) - ICIS-06-1999-0742, FORMAL ENFORCEMENT ACTION
HARRIS BAKING COMPANY (114 W ELM in ROGERS, AR)
STATE MASTER (PDS) - RST-04001663, UNDERGROUND STORAGE TANK PROGRAM, WATER-4260-W, NPDES STORMWATER PERMIT, RST-04000097, FACILITY, RST-04000098, (Resource Conservation and Recovery Act (tracking hazardous waste)) Organizations: HARRIS BAKING CO. ATTN: JOHN (CONTACT/GENERAL)
, OZARK EMPIRE DISTRIBUTORS INC (CONTACT/OWNER)
CLYDE SCOTT DX STATION (1301 W WALNUT in ROGERS, AR)
STATE MASTER (PDS) - RST-04000099, FACILITY (Resource Conservation and Recovery Act (tracking hazardous waste)) Organizations: MEREDITH JR., JOHN W. (CONTACT/GENERAL)
, SCOTT CLYDE (CONTACT/OWNER)
E-Z MART 382 (1600 S. 8TH ST. in ROGERS, AR)
STATE MASTER (PDS) - RST-04000194, FACILITY Large Quantity Generators, more that 1000 kg of hazardous waste/month (Resource Conservation and Recovery Act (tracking hazardous waste)) Organizations: E-Z MART STORES INC (CONTACT/GENERAL)
A N B OFFICE (PLEASANT GROVE & I-540 in ROGERS, AR)
National Pollutant Discharge Elimination System NON-MAJOR (Tracking pollutant discharge elimination systems) - permit STATE MASTER (PDS) - WATER-ARR10C669, NPDES STORMWATER PERMIT Business SIC classification: MANAGEMENT SERVICES Alternative names: CEI ENG. ASSOC. INC-ANB OFFICE, CEI ENGINEERING ASSOCIATES,, SOUTHERN HILLS BUSINESS PARK
6-12 MART (451 HUDSON in ROGERS, AR)
ENFORCEMENT/COMPLIANCE ACTIVITY (Integrated Compliance Information System) FORMAL ENFORCEMENT ACTION (Integrated Compliance Information System) STATE MASTER (PDS) - RST-04000093, FACILITY Business SIC classification: GASOLINE SERVICE STATIONS Business NAICS classification: GASOLINE STATIONS WITH CONVENIENCE STORES. Organizations: FUELS & SUPPLIES INC (CONTACT/GENERAL)
BEAVER LAKE CARWASH (14491 EAST HIGHWAY 12 in ROGERS, AR)
National Pollutant Discharge Elimination System NON-MAJOR (Tracking pollutant discharge elimination systems) - permit STATE MASTER (PDS) - WATER-ARG750043, National Pollutant Discharge Elimination System Permit, WATER-ARG750083, Business SIC classification: CARWASHES Alternative names: BEAVER LAKE CAR WASH, SINDA, INC.
National Pollutant Discharge Elimination System NON-MAJOR (Tracking pollutant discharge elimination systems) - permit COMMUNITY WATER SYSTEM (SDWIS) - SDWIS-AR0000871 1, WATER TREATMENT PLANT Business SIC classification: WATER SUPPLY Alternative names: BENTON-WASHINGTON CO WATER, BENTON/WASHINGTON CO WTR ASSN, BENTON/WASHINGTON COUNTY, BENTON WASHINGTON REGIONAL PUB, BENTON WASHINGTON REGIONAL PUBLIC WATER
GUARDIAN FABRICATION INC (1412 SOUTH 1ST STREET in ROGERS, AR)
STATE MASTER (PDS) - WATER-ARR00A320, NPDES STORMWATER PERMIT Conditionally Exempt Small Quantity Generators, less than 100 kg/month of hazardous waste (Resource Conservation and Recovery Act (tracking hazardous waste)) Business NAICS classification: GLASS PRODUCT MANUFACTURING MADE OF PURCHASED GLASS. Organizations: GAURDIAN GLASS OF ROGERS INC (CONTACT/OPERATOR)
, GUARDIAN INDUSTRIES (CONTACT/OWNER)
Alternative names: GUARDIAN GLASS OF ROGERS INCORPORATED, GUARDIAN INDUSTRIES
Housing units lacking complete plumbing facilities: 2.6% Housing units lacking complete kitchen facilities: 3.7%
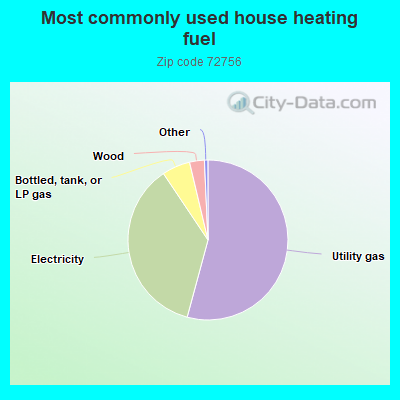
54.2%Utility gas
36.4%Electricity
5.7%Bottled, tank, or LP gas
3.0%Wood
Population in 1990: 34,081. Population change in the 1990s: +2,119 (+6.2%).
Place of birth for U.S.-born residents:
This state: 15,948
Northeast: 973
Midwest: 5,669
South: 5,907
West: 4,831
46% of the 72756 zip code residents lived in the same house 5 years ago. Out of people who lived in different houses, 45% lived in this county. Out of people who lived in different counties, 50% lived in Arkansas.
92% of the 72756 zip code residents lived in the same house 1 year ago. Out of people who lived in different houses, 43% moved from this county. Out of people who lived in different houses, 23% moved from different county within same state. Out of people who lived in different houses, 39% moved from different state.
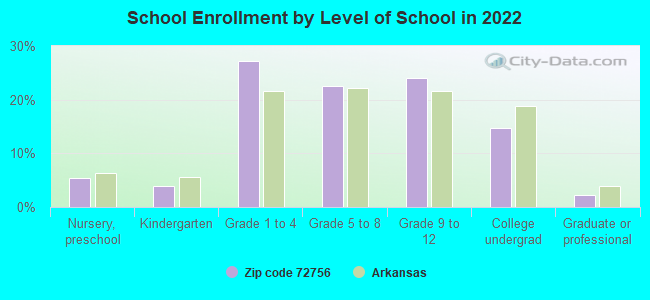
Private vs. public school enrollment:
Students in private schools in grades 1 to 8 (elementary and middle school): 218
Here:
5.4%
Arkansas:
10.5%
Students in private schools in grades 9 to 12 (high school): 144
Here:
7.3%
Arkansas:
8.7%
Students in private undergraduate colleges: 253
Here:
20.9%
Arkansas:
19.4%
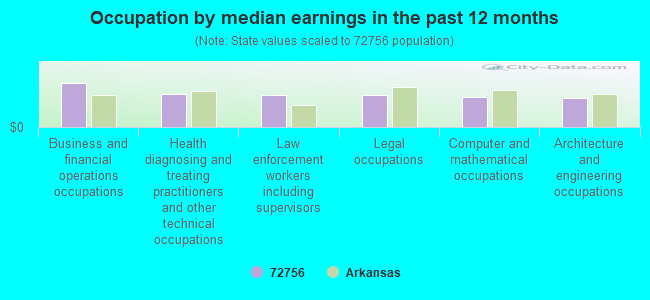
Occupation by median earnings in the past 12 months ($)
100,039Business and financial operations occupations
76,023Health diagnosing and treating practitioners and other technical occupations
72,321Law enforcement workers including supervisors
72,183Legal occupations
67,886Computer and mathematical occupations
66,615Architecture and engineering occupations
Companies with biggest federal contracts located in this zip code (ROGERS, AR):
DAISY MANUFACTURING COMPANY, I (400 WEST STRIBLING DRIVE; small business) : $8,836,768 in 10 contractsfrom 2002 to 2005
Contracts for Athletic and Sporting Equipment, Miscellaneous Weapons by Navy Signed by year:2000: $0; 2001: $0; 2002: $972,000; 2003: $989,279; 2004: $6,499,130; 2005: $376,359; 2006: $0.
Biggest contracts:
$5,281,152 with Navy for Athletic and Sporting Equipment. Signed on 2004-08-12. Completion date: 2004-10-29.
$972,000, same as above.Signed on 2002-04-15. Completion date: 2003-04-14.
$841,152, same as above.Signed on 2004-09-28. Completion date: 2004-12-31.
$770,289, same as above.Signed on 2003-06-30. Completion date: 2003-03-04.
ENGELS, WILLIAM (922 N 11TH ST; small business) : $915,409 in 70 contractsfrom 2002 to 2006
Contracts for Landscaping/Groundskeeping Services, Other Housekeeping Services by Army, U.S. Army Corps of Engineers - civil program financing only Signed by year:2000: $0; 2001: $0; 2002: $46,925; 2003: $116,990; 2004: $319,045; 2005: $359,870; 2006: $72,579.
Biggest contracts:
$30,000 with Army for Landscaping/Groundskeeping Services. Taking place in MO. Signed on 2006-05-16. Completion date: 2006-05-16.
$26,300 with U.S. Army Corps of Engineers - civil program financing only for Landscaping/Groundskeeping Services. Signed on 2003-09-16. Completion date: 2003-09-26.
$25,000 with Army for Landscaping/Groundskeeping Services. Taking place in MO. Signed on 2006-05-05. Completion date: 2006-05-05.
$24,950 with U.S. Army Corps of Engineers - civil program financing only for Landscaping/Groundskeeping Services. Taking place in MO. Signed on 2005-02-10. Completion date: 2005-02-10.
MUNDO-TECH, INC (1745 S 1ST ST; small business) : $527,338 in 5 contractsfrom 2004 to 2006
Contracts for Pipe, Tube and Rigid Tubing, Flight Instruments by Defense Logistics Agency Signed by year:2000: $0; 2001: $0; 2002: $0; 2003: $0; 2004: $499,332; 2005: $0; 2006: $28,006.
Biggest contracts:
$484,164 with Defense Logistics Agency for Pipe, Tube and Rigid Tubing. Signed on 2004-04-28. Completion date: 2005-04-23.
$24,240 with Defense Logistics Agency for Flight Instruments. Signed on 2006-05-22. Completion date: 2006-07-12.
$10,614, same as above.Signed on 2004-10-07. Completion date: 2005-01-11.
$4,554, same as above.Signed on 2004-12-24. Completion date: 2005-03-28.
FRANK HAWES (4410 NE HUDSON ROAD; small business) : $451,189 in 31 contractsfrom 2002 to 2004
Contracts for Other Housekeeping Services, Maintenance, Repair or Alteration of Real Property -- Recreation Facilities (Non-Building) by U.S. Army Corps of Engineers - civil program financing only, Army Signed by year:2000: $0; 2001: $0; 2002: $43,078; 2003: $237,917; 2004: $170,194; 2005: $0; 2006: $0.
Biggest contracts:
$57,431 with U.S. Army Corps of Engineers - civil program financing only for Other Housekeeping Services. Signed on 2003-06-16. Completion date: 2003-08-01.
$29,600, same as above.Signed on 2003-04-28. Completion date: 2003-06-30.
$27,735, same as above.Signed on 2003-07-10. Completion date: 2003-08-31.
$24,975, same as above.Signed on 2003-12-22. Completion date: 2003-12-24.
EARTH SCIENCE LABORATORIES, IN (106 B N 37TH STREET; small business) : $419,018 in 4 contractsfrom 2003 to 2004
$109,952 with U.S. Army Corps of Engineers - civil program financing only for Chemicals. Taking place in DC. Signed on 2003-04-23. Completion date: 2003-09-30.
$106,734 with U.S. Army Corps of Engineers - civil program financing only for Chemicals. Signed on 2003-09-12. Completion date: 2004-09-30.
$101,166 with Army for Chemicals. Taking place in DC. Signed on 2004-09-29. Completion date: 2005-09-30.
$101,166 with U.S. Army Corps of Engineers - civil program financing only for Chemicals. Taking place in DC. Signed on 2004-09-29. Completion date: 2005-09-30.
VISION TECHNOLOGIES,INC (114 WEST ELM STREET; small business) : $145,491 in 2 contractsfrom 2001 to 2006
$98,850 with Navy for Other Defense -- Operational Systems Development (R&D). Signed on 2001-02-01. Completion date: 2001-04-01.
$46,641 with Navy for Communications Security Equipment and Components. Signed on 2006-04-13. Completion date: 2006-05-05.
C & M MACHINE INC (207 BUTTRY RD; small business) : $88,638 in 3 contractsfrom 2000 to 2002
$29,958 with Defense Logistics Agency for Hardware, Commercial. Signed on 2000-09-19. Completion date: 2001-07-31.
$29,340 with Defense Logistics Agency for Airframe Structural Components. Signed on 2002-04-08. Completion date: 2002-06-03.
$29,340, same as above.Signed on 2002-04-02. Completion date: 2002-05-27.
GENEVA YOUSEY (8405 NAVAJO TRAIL; small business) : $76,482 in 13 contractsfrom 2002 to 2006
Contracts for Operation of Government-Owned Facilities -- Recreation Facilities (Non-Building) by U.S. Army Corps of Engineers - civil program financing only, Army Signed by year:2000: $0; 2001: $0; 2002: $2,470; 2003: $20,520; 2004: $17,860; 2005: $24,112; 2006: $11,520.
Biggest contracts:
$15,485 with U.S. Army Corps of Engineers - civil program financing only for Operation of Government-Owned Facilities -- Recreation Facilities (Non-Building). Signed on 2003-01-21. Completion date: 2002-10-02.
$12,730 with Army for Operation of Government-Owned Facilities -- Recreation Facilities (Non-Building). Signed on 2004-02-04. Completion date: 2002-10-02.
$11,520, same as above.Signed on 2006-02-28. Completion date: 2005-09-30.
$11,088, same as above.Signed on 2005-03-23. Completion date: 2005-09-30.
JOLAINE ELROD (PMB 249 100 NORTH DIXIELAN; small business) : $74,126 in 9 contractsfrom 2002 to 2006
Contracts for Facilities Operations Support Services, Operation of Government-Owned Facilities -- Recreation Facilities (Non-Building), Recreation Site Maintenance Services (non-construction) by Army, U.S. Army Corps of Engineers - civil program financing only Signed by year:2000: $0; 2001: $0; 2002: $1,625; 2003: $12,596; 2004: $42,855; 2005: $0; 2006: $17,050.
Biggest contracts:
$17,820 with Army for Facilities Operations Support Services. Taking place in KY. Signed on 2004-12-30. Completion date: 2005-12-31.
$17,820 with U.S. Army Corps of Engineers - civil program financing only for Facilities Operations Support Services. Taking place in KY. Signed on 2004-12-30. Completion date: 2005-12-31.
$17,050 with Army for Facilities Operations Support Services. Taking place in KY. Signed on 2006-03-07. Completion date: 2005-12-31.
$10,854 with U.S. Army Corps of Engineers - civil program financing only for Operation of Government-Owned Facilities -- Recreation Facilities (Non-Building). Signed on 2003-01-23. Completion date: 2003-09-30.
KATHRYN GARNER (9300 N PARK ROAD; small business) : $43,015 in 12 contractsfrom 2002 to 2006
Contracts for Operation of Government-Owned Facilities -- Other Conservation and Development Facilities, Operation of Government-Owned Facilities -- Recreation Facilities (Non-Building), Facilities Operations Support Services by Army, U.S. Army Corps of Engineers - civil program financing only Signed by year:2000: $0; 2001: $0; 2002: $448; 2003: $10,392; 2004: $9,525; 2005: $15,450; 2006: $7,200.
Biggest contracts:
$7,200 with Army for Operation of Government-Owned Facilities -- Other Conservation and Development Facilities. Signed on 2006-02-08. Completion date: 2006-10-31.
$7,125 with Army for Operation of Government-Owned Facilities -- Recreation Facilities (Non-Building). Signed on 2005-03-24. Completion date: 2005-09-30.
$7,125 with U.S. Army Corps of Engineers - civil program financing only for Operation of Government-Owned Facilities -- Recreation Facilities (Non-Building). Signed on 2005-03-24. Completion date: 2005-09-30.
$7,125 with Army for Facilities Operations Support Services. Signed on 2004-02-05. Completion date: 2003-09-30.
Top industries in this zip code by the number of employees in 2005:
Management of Companies and Enterprises: Corporate, Subsidiary, and Regional Managing Offices (100-249: 2, 50-99: 3, 20-49: 3, 10-19: 10, 5-9: 10, 1-4: 8)
Health Care and Social Assistance: General Medical and Surgical Hospitals (500-999: 1)
Wholesale Trade: Meat and Meat Product Merchant Wholesalers (500-999: 1)
Administrative and Support and Waste Management and Remediation Services: Temporary Help Services (250-499: 1, 100-249: 1, 50-99: 2, 20-49: 1, 10-19: 1, 1-4: 1)
People in group quarters in 2010:
93 people in nursing facilities/skilled-nursing facilities
17 people in residential treatment centers for adults
15 people in group homes for juveniles (non-correctional)
12 people in group homes intended for adults
5 people in emergency and transitional shelters (with sleeping facilities) for people experiencing homelessness
People in group quarters in 2000:
261 people in nursing homes
42 people in other noninstitutional group quarters
26 people in other nonhousehold living situations
9 people in religious group quarters
8 people in training schools for juvenile delinquents
4 people in other group homes
3 people in unknown juvenile institutions
Home Mortgage Disclosure Act Aggregated Statistics For Year 2009 (Based on 5 full and 20 partial tracts)
A) FHA, FSA/RHS & VA Home Purchase Loans
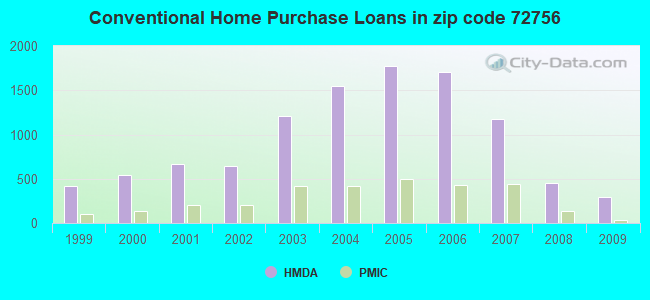
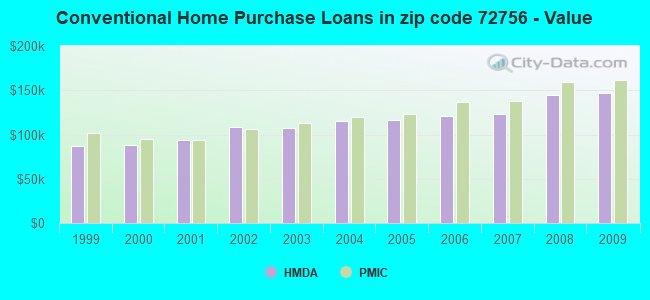
B) Conventional Home Purchase Loans
C) Refinancings
D) Home Improvement Loans
E) Loans on Dwellings For 5+ Families
F) Non-occupant Loans on < 5 Family Dwellings (A B C & D)
G) Loans On Manufactured Home Dwelling (A B C & D)
Number
Average Value
Number
Average Value
Number
Average Value
Number
Average Value
Number
Average Value
Number
Average Value
Number
Average Value
LOANS ORIGINATED
531
$112,653
296
$146,713
1,408
$138,903
141
$38,065
13
$1,756,927
266
$129,365
42
$36,676
APPLICATIONS APPROVED, NOT ACCEPTED
12
$112,531
17
$128,286
66
$163,015
19
$27,182
0
$0
8
$85,996
5
$71,800
APPLICATIONS DENIED
100
$106,248
70
$112,531
490
$147,417
69
$26,593
0
$0
50
$111,674
7
$119,556
APPLICATIONS WITHDRAWN
55
$103,704
39
$122,115
359
$152,325
13
$78,158
0
$0
35
$112,222
5
$58,338
FILES CLOSED FOR INCOMPLETENESS
14
$124,326
10
$186,693
54
$145,452
7
$24,030
0
$0
6
$78,903
0
$0
Aggregated Statistics For Year 2008 (Based on 5 full and 20 partial tracts)
A) FHA, FSA/RHS & VA Home Purchase Loans
B) Conventional Home Purchase Loans
C) Refinancings
D) Home Improvement Loans
E) Loans on Dwellings For 5+ Families
F) Non-occupant Loans on < 5 Family Dwellings (A B C & D)
G) Loans On Manufactured Home Dwelling (A B C & D)
Number
Average Value
Number
Average Value
Number
Average Value
Number
Average Value
Number
Average Value
Number
Average Value
Number
Average Value
LOANS ORIGINATED
362
$126,045
449
$144,550
1,110
$124,104
305
$42,541
6
$1,850,240
246
$143,338
34
$59,642
APPLICATIONS APPROVED, NOT ACCEPTED
18
$134,883
35
$129,553
88
$151,353
9
$41,483
0
$0
18
$150,292
12
$79,518
APPLICATIONS DENIED
98
$122,732
151
$127,241
544
$147,203
89
$44,874
4
$643,980
75
$146,330
25
$70,716
APPLICATIONS WITHDRAWN
50
$124,217
45
$192,332
237
$148,361
20
$60,502
0
$0
26
$117,049
0
$0
FILES CLOSED FOR INCOMPLETENESS
11
$120,963
14
$131,602
65
$150,943
6
$90,335
0
$0
4
$97,235
1
$79,210
Aggregated Statistics For Year 2007 (Based on 5 full and 20 partial tracts)
A) FHA, FSA/RHS & VA Home Purchase Loans
B) Conventional Home Purchase Loans
C) Refinancings
D) Home Improvement Loans
E) Loans on Dwellings For 5+ Families
F) Non-occupant Loans on < 5 Family Dwellings (A B C & D)
G) Loans On Manufactured Home Dwelling (A B C & D)
Number
Average Value
Number
Average Value
Number
Average Value
Number
Average Value
Number
Average Value
Number
Average Value
Number
Average Value
LOANS ORIGINATED
177
$127,614
1,176
$123,183
1,345
$127,757
337
$42,575
9
$315,018
476
$120,344
49
$66,075
APPLICATIONS APPROVED, NOT ACCEPTED
8
$123,320
79
$102,021
160
$134,003
39
$49,118
0
$0
30
$93,250
18
$76,683
APPLICATIONS DENIED
49
$132,198
334
$116,820
663
$137,052
124
$33,667
0
$0
116
$118,845
54
$61,305
APPLICATIONS WITHDRAWN
24
$133,603
143
$117,681
224
$152,004
61
$40,675
0
$0
43
$121,247
3
$49,160
FILES CLOSED FOR INCOMPLETENESS
3
$139,633
44
$127,256
88
$151,280
4
$55,108
0
$0
9
$112,637
0
$0
Aggregated Statistics For Year 2006 (Based on 5 full and 20 partial tracts)
A) FHA, FSA/RHS & VA Home Purchase Loans
B) Conventional Home Purchase Loans
C) Refinancings
D) Home Improvement Loans
E) Loans on Dwellings For 5+ Families
F) Non-occupant Loans on < 5 Family Dwellings (A B C & D)
G) Loans On Manufactured Home Dwelling (A B C & D)
Number
Average Value
Number
Average Value
Number
Average Value
Number
Average Value
Number
Average Value
Number
Average Value
Number
Average Value
LOANS ORIGINATED
148
$134,711
1,703
$120,947
1,306
$118,702
434
$43,109
4
$927,408
510
$119,155
73
$67,910
APPLICATIONS APPROVED, NOT ACCEPTED
9
$115,066
172
$111,578
156
$140,973
34
$56,022
0
$0
39
$124,161
33
$55,634
APPLICATIONS DENIED
26
$116,507
509
$104,143
542
$126,184
130
$32,851
3
$2,091,023
103
$104,109
89
$59,688
APPLICATIONS WITHDRAWN
28
$140,496
223
$115,889
383
$130,610
49
$43,496
2
$1,049,325
62
$138,271
10
$52,722
FILES CLOSED FOR INCOMPLETENESS
3
$119,733
61
$126,298
112
$127,092
3
$24,807
0
$0
9
$102,264
1
$168,900
Aggregated Statistics For Year 2005 (Based on 5 full and 20 partial tracts)
A) FHA, FSA/RHS & VA Home Purchase Loans
B) Conventional Home Purchase Loans
C) Refinancings
D) Home Improvement Loans
E) Loans on Dwellings For 5+ Families
F) Non-occupant Loans on < 5 Family Dwellings (A B C & D)
G) Loans On Manufactured Home Dwelling (A B C & D)
Number
Average Value
Number
Average Value
Number
Average Value
Number
Average Value
Number
Average Value
Number
Average Value
Number
Average Value
LOANS ORIGINATED
233
$119,061
1,775
$116,473
1,492
$110,729
497
$42,042
5
$152,084
508
$102,651
59
$73,282
APPLICATIONS APPROVED, NOT ACCEPTED
8
$89,941
165
$101,194
160
$137,767
21
$38,148
0
$0
29
$122,755
33
$54,003
APPLICATIONS DENIED
38
$103,369
416
$96,555
598
$109,115
140
$23,087
0
$0
55
$92,334
91
$51,874
APPLICATIONS WITHDRAWN
21
$113,961
274
$121,839
454
$127,567
71
$141,159
0
$0
50
$117,884
11
$67,472
FILES CLOSED FOR INCOMPLETENESS
8
$103,764
57
$114,848
90
$115,545
1
$124,880
0
$0
11
$97,972
4
$76,868
Aggregated Statistics For Year 2004 (Based on 5 full and 20 partial tracts)
A) FHA, FSA/RHS & VA Home Purchase Loans
B) Conventional Home Purchase Loans
C) Refinancings
D) Home Improvement Loans
E) Loans on Dwellings For 5+ Families
F) Non-occupant Loans on < 5 Family Dwellings (A B C & D)
G) Loans On Manufactured Home Dwelling (A B C & D)
Number
Average Value
Number
Average Value
Number
Average Value
Number
Average Value
Number
Average Value
Number
Average Value
Number
Average Value
LOANS ORIGINATED
306
$106,520
1,548
$115,367
1,539
$104,925
497
$40,743
5
$1,016,730
534
$101,971
73
$59,985
APPLICATIONS APPROVED, NOT ACCEPTED
10
$103,811
141
$111,457
191
$93,811
15
$44,415
0
$0
25
$94,423
27
$60,846
APPLICATIONS DENIED
46
$92,738
361
$95,884
518
$102,650
110
$38,037
0
$0
73
$82,681
93
$52,016
APPLICATIONS WITHDRAWN
21
$104,760
163
$115,698
356
$110,748
30
$37,977
0
$0
46
$100,247
9
$52,057
FILES CLOSED FOR INCOMPLETENESS
5
$104,248
44
$101,879
101
$110,672
0
$0
0
$0
7
$89,383
0
$0
Aggregated Statistics For Year 2003 (Based on 5 full and 20 partial tracts)
A) FHA, FSA/RHS & VA Home Purchase Loans
B) Conventional Home Purchase Loans
C) Refinancings
D) Home Improvement Loans
E) Loans on Dwellings For 5+ Families
F) Non-occupant Loans on < 5 Family Dwellings (A B C & D)
Number
Average Value
Number
Average Value
Number
Average Value
Number
Average Value
Number
Average Value
Number
Average Value
LOANS ORIGINATED
372
$96,715
1,205
$107,738
2,918
$96,687
268
$30,446
6
$598,158
470
$88,073
APPLICATIONS APPROVED, NOT ACCEPTED
13
$96,531
90
$102,361
213
$99,602
14
$33,811
0
$0
20
$86,638
APPLICATIONS DENIED
58
$85,932
215
$92,594
591
$90,081
73
$29,376
0
$0
70
$91,848
APPLICATIONS WITHDRAWN
21
$91,433
102
$127,155
330
$102,993
29
$34,653
0
$0
42
$99,107
FILES CLOSED FOR INCOMPLETENESS
12
$87,485
40
$115,794
111
$107,364
3
$50,513
0
$0
7
$88,061
Aggregated Statistics For Year 2002 (Based on 1 full and 18 partial tracts)
A) FHA, FSA/RHS & VA Home Purchase Loans
B) Conventional Home Purchase Loans
C) Refinancings
D) Home Improvement Loans
E) Loans on Dwellings For 5+ Families
F) Non-occupant Loans on < 5 Family Dwellings (A B C & D)
Number
Average Value
Number
Average Value
Number
Average Value
Number
Average Value
Number
Average Value
Number
Average Value
LOANS ORIGINATED
256
$88,008
646
$108,886
1,320
$100,668
222
$31,786
5
$111,932
251
$94,769
APPLICATIONS APPROVED, NOT ACCEPTED
8
$68,788
59
$72,155
125
$89,789
31
$20,027
0
$0
8
$61,062
APPLICATIONS DENIED
39
$88,589
165
$71,900
288
$85,347
45
$11,373
0
$0
20
$94,860
APPLICATIONS WITHDRAWN
20
$83,705
66
$96,460
166
$96,293
18
$20,932
0
$0
17
$90,563
FILES CLOSED FOR INCOMPLETENESS
5
$74,642
19
$111,971
58
$102,722
1
$12,340
0
$0
1
$52,500
Aggregated Statistics For Year 2001 (Based on 1 full and 18 partial tracts)
A) FHA, FSA/RHS & VA Home Purchase Loans
B) Conventional Home Purchase Loans
C) Refinancings
D) Home Improvement Loans
E) Loans on Dwellings For 5+ Families
F) Non-occupant Loans on < 5 Family Dwellings (A B C & D)
Number
Average Value
Number
Average Value
Number
Average Value
Number
Average Value
Number
Average Value
Number
Average Value
LOANS ORIGINATED
285
$82,508
666
$94,103
1,100
$94,432
143
$26,267
3
$198,000
234
$77,604
APPLICATIONS APPROVED, NOT ACCEPTED
8
$70,145
52
$73,036
71
$86,690
19
$32,775
0
$0
4
$49,328
APPLICATIONS DENIED
35
$82,714
203
$55,144
337
$78,667
57
$21,147
0
$0
34
$69,025
APPLICATIONS WITHDRAWN
19
$81,226
58
$111,472
203
$82,548
11
$28,514
1
$205,600
21
$82,005
FILES CLOSED FOR INCOMPLETENESS
0
$0
6
$115,807
33
$85,609
3
$37,443
1
$56,000
1
$69,690
Aggregated Statistics For Year 2000 (Based on 1 full and 18 partial tracts)
A) FHA, FSA/RHS & VA Home Purchase Loans
B) Conventional Home Purchase Loans
C) Refinancings
D) Home Improvement Loans
E) Loans on Dwellings For 5+ Families
F) Non-occupant Loans on < 5 Family Dwellings (A B C & D)
Number
Average Value
Number
Average Value
Number
Average Value
Number
Average Value
Number
Average Value
Number
Average Value
LOANS ORIGINATED
241
$76,256
546
$88,284
390
$76,229
142
$22,063
2
$87,895
107
$65,418
APPLICATIONS APPROVED, NOT ACCEPTED
13
$53,232
70
$58,321
48
$73,815
16
$22,326
0
$0
7
$42,217
APPLICATIONS DENIED
69
$67,091
265
$51,028
279
$66,152
50
$18,147
0
$0
20
$65,505
APPLICATIONS WITHDRAWN
18
$77,140
43
$98,592
144
$63,894
13
$34,628
0
$0
5
$95,072
FILES CLOSED FOR INCOMPLETENESS
3
$77,373
2
$78,940
33
$88,572
0
$0
0
$0
4
$69,545
Aggregated Statistics For Year 1999 (Based on 1 full and 10 partial tracts)
A) FHA, FSA/RHS & VA Home Purchase Loans
B) Conventional Home Purchase Loans
C) Refinancings
D) Home Improvement Loans
E) Loans on Dwellings For 5+ Families
F) Non-occupant Loans on < 5 Family Dwellings (A B C & D)
2002 - 2018 National Fire Incident Reporting System (NFIRS) incidents
Based on the data from the years 2002 - 2018 the average number of fires per year is 205. The highest number of reported fire incidents - 358 took place in 2006, and the least - 100 in 2002. The data has a rising trend.
When looking into fire subcategories, the most reports belonged to: Outside Fires (46.2%), and Structure Fires (37.8%).
Fire incident types reported to NFIRS in Zip Code 72756


 Nearest zip codes: 72732, 72745, 72758, 72764, 72738, 72751.


 Based on the data from the years 2002 - 2018 the average number of fires per year is 205. The highest number of reported fire incidents - 358 took place in 2006, and the least - 100 in 2002. The data has a rising trend.
 When looking into fire subcategories, the most reports belonged to: Outside Fires (46.2%), and Structure Fires (37.8%).