Estimated zip code population in 2022: 29,578 Zip code population in 2010: 27,758 Zip code population in 2000: 25,666
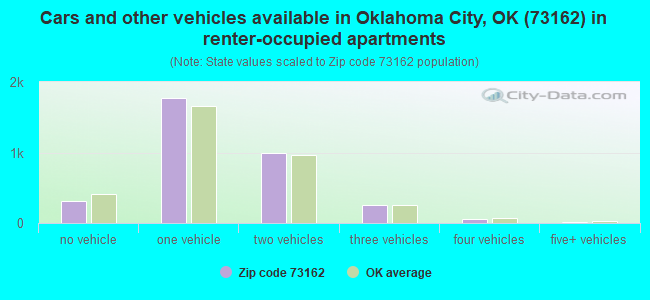
Houses and condos: 12,767 Renter-occupied apartments: 3,388
% of renters here:
28%
State:
35%
March 2022 cost of living index in zip code 73162: 85.4 (less than average, U.S. average is 100)
Land area: 7.0 sq. mi. Water area: 0.2 sq. mi.
Population density: 4,248 people per square mile
(average).
OSM Map
General Map
Google Map
MSN Map
OSM Map
General Map
Google Map
MSN Map
OSM Map
General Map
Google Map
MSN Map
OSM Map
General Map
Google Map
MSN Map
Please wait while loading the map...
Real estate property taxes paid for housing units in 2022:
This zip code:
1.0% ($2,551)
Oklahoma:
0.8% ($1,501)
Median real estate property taxes paid for housing units with mortgages in 2022: $2,592 (1.0%) Median real estate property taxes paid for housing units with no mortgage in 2022: $2,426 (1.0%)
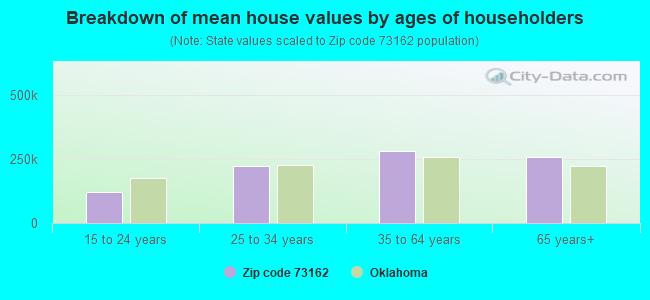
Estimated median house/condo value in 2022: $248,142
73162:
$248,142
Oklahoma:
$191,700
According to our research of Oklahoma and other state lists, there were 21 registered sex offenders living in 73162 zip code as of May 10, 2024. The ratio of all residents to sex offenders in zip code 73162 is 1,405 to 1. The ratio of registered sex offenders to all residents in this zip code is much lower than the state average.
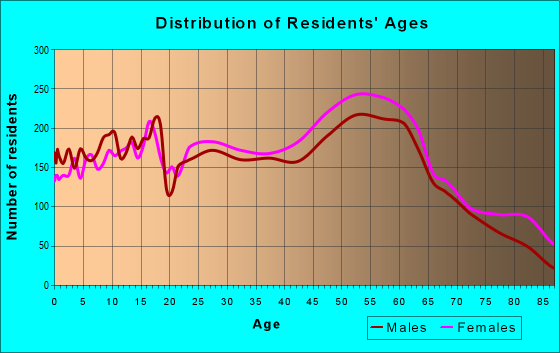
Median resident age:
This zip code:
42.1 years
Oklahoma median age:
37.1 years
Average household size:
This zip code:
2.4 people
Oklahoma:
2.5 people
Averages for the 2020 tax year for zip code 73162, filed in 2021:
Average Adjusted Gross Income (AGI) in 2020: $66,945 (Individual Income Tax Returns)
Here:
$66,945
State:
$63,060
Salary/wage: $56,758 (reported on 79.8% of returns)
Here:
$56,758
State:
$52,427
(% of AGI for various income ranges: 1106.9% for AGIs below $25k, 3494.2% for AGIs $25k-50k, 6329.4% for AGIs $50k-75k, 9388.1% for AGIs $75k-100k, 17413.1% for AGIs $100k-200k, 57036.3% for AGIs over 200k)
Taxable interest for individuals: $1,459 (reported on 34.6% of returns)
This zip code:
$1,459
Oklahoma:
$1,603
(% of AGI for various income ranges: 19.8% for AGIs below $25k, 28.3% for AGIs $25k-50k, 54.7% for AGIs $50k-75k, 102.2% for AGIs $75k-100k, 193.7% for AGIs $100k-200k, 811.1% for AGIs over 200k)
Ordinary dividends: $5,272 (reported on 19.7% of returns)
Here:
$5,272
State:
$7,001
(% of AGI for various income ranges: 28.2% for AGIs below $25k, 44.9% for AGIs $25k-50k, 117.1% for AGIs $50k-75k, 177.3% for AGIs $75k-100k, 339.1% for AGIs $100k-200k, 2624.2% for AGIs over 200k)
Net capital gain/loss in AGI: +$12,060 (reported on 18.3% of returns)
Here:
+$12,060
State:
+$19,855
(% of AGI for various income ranges: 10.8% for AGIs below $25k, 31.3% for AGIs $25k-50k, 87.4% for AGIs $50k-75k, 177.0% for AGIs $75k-100k, 580.2% for AGIs $100k-200k, 10685.8% for AGIs over 200k)
Profit/loss from business: +$10,427 (reported on 18.8% of returns)
Here:
+$10,427
State:
+$9,904
(% of AGI for various income ranges: 105.0% for AGIs below $25k, 132.1% for AGIs $25k-50k, 237.5% for AGIs $50k-75k, 370.4% for AGIs $75k-100k, 668.2% for AGIs $100k-200k, 2802.6% for AGIs over 200k)
Taxable individual retirement arrangement distribution: $20,953 (reported on 11.1% of returns)
73162:
$20,953
Oklahoma:
$20,476
(% of AGI for various income ranges: 64.0% for AGIs below $25k, 117.0% for AGIs $25k-50k, 275.8% for AGIs $50k-75k, 475.2% for AGIs $75k-100k, 939.5% for AGIs $100k-200k, 3895.8% for AGIs over 200k)
Self-employed (Keogh) retirement plans: $26,950 (reported on 0.3% of returns)
73162:
$26,950
Oklahoma:
$23,482
(% of AGI for various income ranges: 37.2% for AGIs $75k-100k, 377.4% for AGIs over 200k)
Total itemized deductions: $31,925 (reported on 9.2% of returns)
Here:
$31,925
State:
$39,736
(% of AGI for various income ranges: 60.3% for AGIs below $25k, 124.6% for AGIs $25k-50k, 350.8% for AGIs $50k-75k, 523.7% for AGIs $75k-100k, 1120.8% for AGIs $100k-200k, 6390.0% for AGIs over 200k)
Charity contributions: $11,982 (reported on 7.7% of returns)
Here:
$11,982
State:
$17,288
(% of AGI for various income ranges: 5.1% for AGIs below $25k, 22.7% for AGIs $25k-50k, 79.8% for AGIs $50k-75k, 128.9% for AGIs $75k-100k, 371.5% for AGIs $100k-200k, 2772.6% for AGIs over 200k)
Taxes paid: $6,637 (reported on 9.1% of returns)
73162:
$6,637
State:
$7,046
(% of AGI for various income ranges: 7.1% for AGIs below $25k, 20.5% for AGIs $25k-50k, 72.8% for AGIs $50k-75k, 114.9% for AGIs $75k-100k, 278.9% for AGIs $100k-200k, 1085.3% for AGIs over 200k)
Earned income credit: $2,204 (reported on 13.7% of returns)
Here:
$2,204
State:
$2,435
(% of AGI for various income ranges: 80.9% for AGIs below $25k, 61.7% for AGIs $25k-50k, 1.0% for AGIs $50k-75k)
Percentage of individuals using paid preparers for their 2020 taxes: 92.4%
Here:
92%
State:
94%
(% for various income ranges: 91.7% for AGIs below $25k, 93.8% for AGIs $25k-50k, 92.4% for AGIs $50k-75k, 92.1% for AGIs $75k-100k, 91.9% for AGIs $100k-200k, 93.0% for AGIs over 200k)
Averages for the 2012 tax year for zip code 73162, filed in 2013:
Average Adjusted Gross Income (AGI) in 2012: $67,164 (Individual Income Tax Returns)
Here:
$67,164
State:
$58,581
Salary/wage: $55,094 (reported on 82.6% of returns)
Here:
$55,094
State:
$45,973
(% of AGI for various income ranges: 71.8% for AGIs below $25k, 75.9% for AGIs $25k-50k, 72.4% for AGIs $50k-75k, 72.3% for AGIs $75k-100k, 73.2% for AGIs $100k-200k, 49.8% for AGIs over 200k)
Taxable interest for individuals: $1,245 (reported on 40.7% of returns)
This zip code:
$1,245
Oklahoma:
$1,625
(% of AGI for various income ranges: 1.3% for AGIs below $25k, 0.7% for AGIs $25k-50k, 0.7% for AGIs $50k-75k, 0.7% for AGIs $75k-100k, 0.6% for AGIs $100k-200k, 0.8% for AGIs over 200k)
Ordinary dividends: $4,479 (reported on 22.7% of returns)
Here:
$4,479
State:
$6,374
(% of AGI for various income ranges: 2.1% for AGIs below $25k, 1.4% for AGIs $25k-50k, 1.2% for AGIs $50k-75k, 1.2% for AGIs $75k-100k, 1.2% for AGIs $100k-200k, 2.3% for AGIs over 200k)
Net capital gain/loss in AGI: +$11,693 (reported on 18.5% of returns)
Here:
+$11,693
State:
+$24,023
(% of AGI for various income ranges: 0.3% for AGIs $25k-50k, 0.3% for AGIs $50k-75k, 0.4% for AGIs $75k-100k, 1.5% for AGIs $100k-200k, 11.3% for AGIs over 200k)
Profit/loss from business: +$15,391 (reported on 18.8% of returns)
Here:
+$15,391
State:
+$11,913
(% of AGI for various income ranges: 8.2% for AGIs below $25k, 4.2% for AGIs $25k-50k, 3.2% for AGIs $50k-75k, 3.3% for AGIs $75k-100k, 3.5% for AGIs $100k-200k, 5.8% for AGIs over 200k)
Taxable individual retirement arrangement distribution: $16,241 (reported on 12.0% of returns)
73162:
$16,241
Oklahoma:
$15,242
(% of AGI for various income ranges: 3.3% for AGIs below $25k, 2.8% for AGIs $25k-50k, 2.7% for AGIs $50k-75k, 3.5% for AGIs $75k-100k, 3.3% for AGIs $100k-200k, 2.1% for AGIs over 200k)
Self-employment retirement plans: $16,638 (reported on 0.6% of returns)
73162:
$16,638
Oklahoma:
$20,266
(% of AGI for various income ranges: 0.2% for AGIs $50k-75k, 0.2% for AGIs $100k-200k, 0.3% for AGIs over 200k)
Total itemized deductions: $22,050 (20% of AGI, reported on 40.9% of returns)
Here:
$22,050
State:
$24,882
Here:
19.7% of AGI
State:
18.8% of AGI
(% of AGI for various income ranges: 12.5% for AGIs below $25k, 12.5% for AGIs $25k-50k, 13.1% for AGIs $50k-75k, 13.7% for AGIs $75k-100k, 13.7% for AGIs $100k-200k, 13.8% for AGIs over 200k)
Charity contributions: $5,848 (reported on 34.4% of returns)
Here:
$5,848
State:
$6,591
(% of AGI for various income ranges: 1.4% for AGIs below $25k, 1.8% for AGIs $25k-50k, 2.3% for AGIs $50k-75k, 2.9% for AGIs $75k-100k, 3.2% for AGIs $100k-200k, 4.2% for AGIs over 200k)
Taxes paid: $6,667 (reported on 40.7% of returns)
73162:
$6,667
State:
$7,196
(% of AGI for various income ranges: 1.9% for AGIs below $25k, 2.6% for AGIs $25k-50k, 3.4% for AGIs $50k-75k, 4.0% for AGIs $75k-100k, 4.9% for AGIs $100k-200k, 4.7% for AGIs over 200k)
Earned income credit: $2,064 (reported on 12.6% of returns)
Here:
$2,064
State:
$2,354
(% of AGI for various income ranges: 4.7% for AGIs below $25k, 0.9% for AGIs $25k-50k)
Percentage of individuals using paid preparers for their 2012 taxes: 50.4%
Here:
50%
State:
56%
(% for various income ranges: 43.6% for AGIs below $25k, 47.0% for AGIs $25k-50k, 53.7% for AGIs $50k-75k, 53.0% for AGIs $75k-100k, 56.9% for AGIs $100k-200k, 79.2% for AGIs over 200k)
Averages for the 2004 tax year for zip code 73162, filed in 2005:
Average Adjusted Gross Income (AGI) in 2004: $55,782 (Individual Income Tax Returns)
Here:
$55,782
State:
$41,245
Salary/wage: $47,949 (reported on 84.3% of returns)
Here:
$47,949
State:
$35,318
(% of AGI for various income ranges: 149.5% for AGIs below $10k, 73.8% for AGIs $10k-25k, 76.2% for AGIs $25k-50k, 76.3% for AGIs $50k-75k, 79.1% for AGIs $75k-100k, 65.3% for AGIs over 100k)
Taxable interest for individuals: $1,532 (reported on 52.4% of returns)
This zip code:
$1,532
Oklahoma:
$1,745
(% of AGI for various income ranges: 7.3% for AGIs below $10k, 2.6% for AGIs $10k-25k, 1.7% for AGIs $25k-50k, 1.3% for AGIs $50k-75k, 1.0% for AGIs $75k-100k, 1.3% for AGIs over 100k)
Taxable dividends: $2,533 (reported on 29.4% of returns)
Here:
$2,533
State:
$2,920
(% of AGI for various income ranges: 6.1% for AGIs below $10k, 1.8% for AGIs $10k-25k, 1.2% for AGIs $25k-50k, 1.0% for AGIs $50k-75k, 1.0% for AGIs $75k-100k, 1.5% for AGIs over 100k)
Net capital gain/loss: +$4,576 (reported on 24.6% of returns)
Here:
+$4,576
State:
+$10,653
(% of AGI for various income ranges: -0.9% for AGIs below $10k, -0.1% for AGIs $10k-25k, 0.3% for AGIs $25k-50k, 0.6% for AGIs $50k-75k, 0.8% for AGIs $75k-100k, 3.9% for AGIs over 100k)
Profit/loss from business: +$12,654 (reported on 19.5% of returns)
Here:
+$12,654
State:
+$8,532
(% of AGI for various income ranges: 1.6% for AGIs below $10k, 4.9% for AGIs $10k-25k, 3.9% for AGIs $25k-50k, 3.7% for AGIs $50k-75k, 3.4% for AGIs $75k-100k, 5.3% for AGIs over 100k)
IRA payment deduction: $3,279 (reported on 3.1% of returns)
73162:
$3,279
Oklahoma:
$3,127
(% of AGI for various income ranges: 0.8% for AGIs below $10k, 0.3% for AGIs $10k-25k, 0.3% for AGIs $25k-50k, 0.2% for AGIs $50k-75k, 0.2% for AGIs $75k-100k, 0.1% for AGIs over 100k)
Self-employed pension: $14,345 (reported on 1.0% of returns)
Here:
$14,345
Oklahoma:
$14,276
(% of AGI for various income ranges: 0.1% for AGIs $25k-50k, 0.1% for AGIs $50k-75k, 0.2% for AGIs $75k-100k, 0.4% for AGIs over 100k)
Total itemized deductions: $18,461 (21% of AGI, reported on 50.4% of returns)
Here:
$18,461
State:
$17,093
Here:
20.9% of AGI
State:
20.5% of AGI
(% of AGI for various income ranges: 25.7% for AGIs below $10k, 17.7% for AGIs $10k-25k, 20.9% for AGIs $25k-50k, 17.4% for AGIs $50k-75k, 17.9% for AGIs $75k-100k, 14.2% for AGIs over 100k)
Charity contributions deductions: $4,134 (4% of AGI, reported on 45.2% of returns)
Here:
$4,134
State:
$4,240
Here:
4.5% of AGI
State:
4.8% of AGI
(% of AGI for various income ranges: 1.7% for AGIs below $10k, 2.1% for AGIs $10k-25k, 2.8% for AGIs $25k-50k, 3.2% for AGIs $50k-75k, 3.5% for AGIs $75k-100k, 3.7% for AGIs over 100k)
Total tax: $9,035 (reported on 80.3% of returns)
73162:
$9,035
State:
$6,542
(% of AGI for various income ranges: 4.8% for AGIs below $10k, 4.6% for AGIs $10k-25k, 7.4% for AGIs $25k-50k, 9.2% for AGIs $50k-75k, 10.6% for AGIs $75k-100k, 18.6% for AGIs over 100k)
Earned income credit: $1,570 (reported on 9.2% of returns)
Here:
$1,570
State:
$1,830
Percentage of individuals using paid preparers for their 2004 taxes: 54.2%
Here:
54%
State:
63%
(% for various income ranges: 43.1% for AGIs below $10k, 51.9% for AGIs $10k-25k, 56.9% for AGIs $25k-50k, 56.7% for AGIs $50k-75k, 54.8% for AGIs $75k-100k, 64.7% for AGIs over 100k)
Likely homosexual households (counted as self-reported same-sex unmarried-partner households)
Lesbian couples: 0.1% of all households
Gay men: 0.0% of all households
Household received Food Stamps/SNAP in the past 12 months: 476 Household did not receive Food Stamps/SNAP in the past 12 months: 11,437
Women who had a birth in the past 12 months: 502 (413 now married, 94 unmarried) Women who did not have a birth in the past 12 months: 6,418 (3,024 now married, 3,393 unmarried)
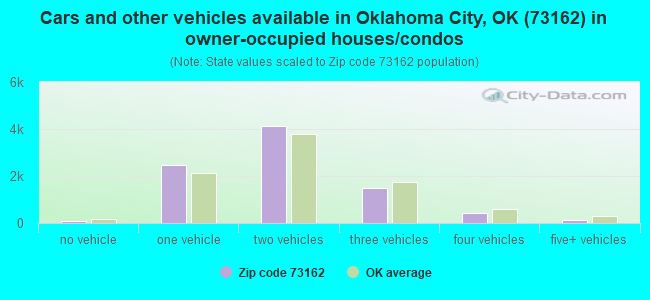
Housing units in zip code 73162 with a mortgage: 5,107 (324 second mortgage, 280 both second mortgage and home equity loan) Houses without a mortgage: 10
Median monthly owner costs for units with a mortgage: $1,664 Median monthly owner costs for units without a mortgage: $699
Residents with income below the poverty level in 2022:
This zip code:
6.5%
Whole state:
15.7%
Residents with income below 50% of the poverty level in 2022:
This zip code:
3.3%
Whole state:
8.3%
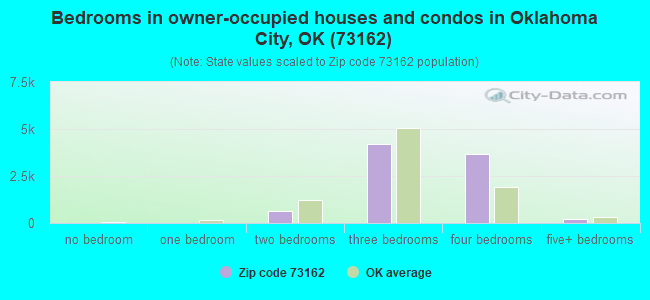
Median number of rooms in houses and condos:
Here:
7.0
State:
6.1
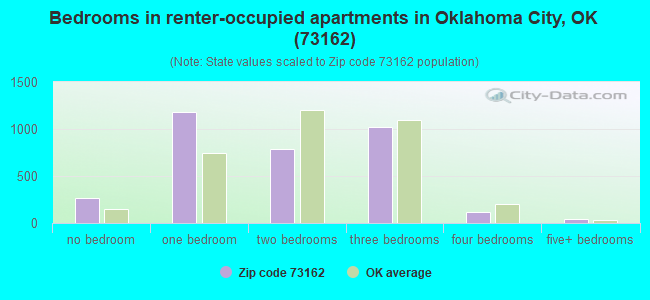
Median number of rooms in apartments:
Here:
4.0
State:
4.5
Notable locations in this zip code not listed on our city pages
Notable locations in zip code 73162: Putnam North Plaza (A), Warwick Plaza (B), Oklahoma City Fire Department Station 3 (C). Display/hide their locations on the map
Shopping Centers: Council Crossings Shopping Center (1), Outlet Malls of America (2), Warrick Crossing Shopping Center (3). Display/hide their locations on the map
Churches in zip code 73162 include: Spring Creek Church (A), Peniel Missionary Baptist Church (B), Hi-Way Church (C), Saint Pauls Lutheran Church (D), Shook Memorial United Methodist Church (E), New Covenant Christian Church (F), Metropolitan Baptist Church (G), Lakeside Assembly of God Youth (H), Lakeside Assembly of God (I). Display/hide their locations on the map
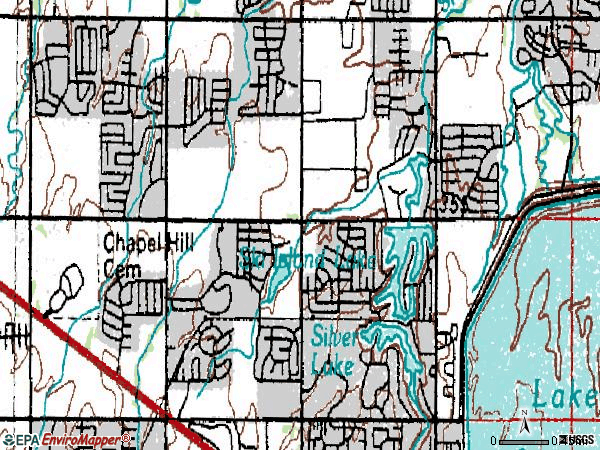
Reservoirs: Regal Lake (A), Silver Lake (B), Blue Stem Lake (C), Eagle Lake (D), Willow Lake (E), Ski Island Lake (F), Silver Lake (G). Display/hide their locations on the map
In group quarters: 481 (-1 institutionalized population)
Size of family households: 3,244 2-persons, 2,140 3-persons, 1,478 4-persons, 748 5-persons, 341 6-persons, 21 7-or-more-persons
Size of nonfamily households: 3,592 1-person, 507 2-persons, 14 3-persons
3,979 married couples with children.
1,493 single-parent households (298 men, 1,195 women).
92.6% of residents of 73162 zip code speak English at home.
2.3% of residents speak Spanish at home (71% very well, 21% well, 8% not well).
1.3% of residents speak other Indo-European language at home (86% very well, 11% well, 3% not well).
3.1% of residents speak Asian or Pacific Island language at home (51% very well, 22% well, 21% not well, 7% not at all).
0.7% of residents speak other language at home (89% very well, 11% well).
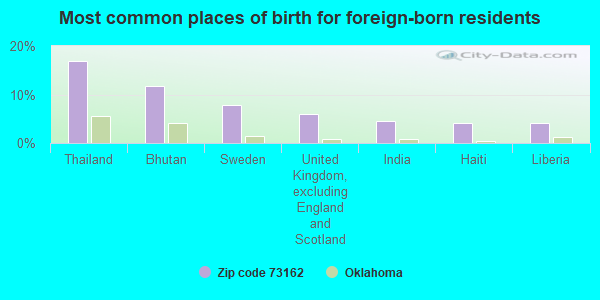
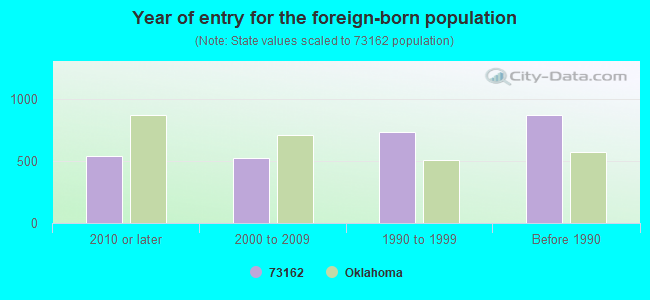
Foreign born population: 2,326 (7.9%) (69.1% of them are naturalized citizens)
Facilities with environmental interests located in this zip code:
DENNIS ES (11800 JAMES L. DENNIS DRIVE in OKLAHOMA CITY, OK)
(National Center for Education Statistics) - STATE ID-55-I001-116 Organizations: PUTNAM CITY (SCHOOL DISTRICT)
BLUE QUAIL RIDGE SECOND ADDITION HOUSING AUTH (N.W. 159TH ST AND MAY AVE in OKLAHOMA CITY, OK)
(Integrated Compliance Information System) - ICIS-06-1997-0633, FORMAL ENFORCEMENT ACTION Business SIC classification: GENERAL CONTRACTORS-SINGLE-FAMILY HOUSES; OPERATIVE BUILDERS
AERO PAINT CENTER (NW 122ND & SARAH RD in OKLAHOMA CITY, OK)
(Resource Conservation and Recovery Act (tracking hazardous waste)) Organizations: JAMES BARNHILL (CONTACT/OWNER)
BEST CLEANERS (11122 N ROCKWELL in OKLAHOMA CITY, OK)
(Resource Conservation and Recovery Act (tracking hazardous waste)) Organizations: PRIDE CLEANERS (CONTACT/OWNER)
Housing units lacking complete plumbing facilities: 0.2% Housing units lacking complete kitchen facilities: 1.0%
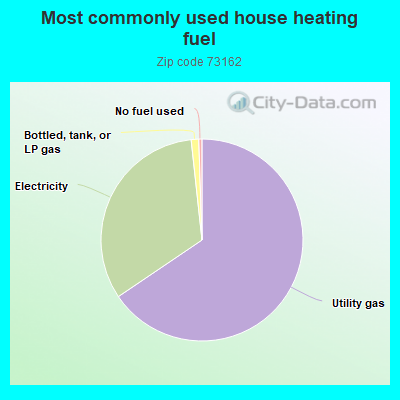
65.4%Utility gas
32.7%Electricity
1.2%Bottled, tank, or LP gas
0.5%No fuel used
Population in 1990: 21,084. Population change in the 1990s: +4,582 (+21.7%).
Place of birth for U.S.-born residents:
This state: 16,074
Northeast: 611
Midwest: 3,001
South: 5,035
West: 2,108
52% of the 73162 zip code residents lived in the same house 5 years ago. Out of people who lived in different houses, 62% lived in this county. Out of people who lived in different counties, 50% lived in Oklahoma.
90% of the 73162 zip code residents lived in the same house 1 year ago. Out of people who lived in different houses, 45% moved from this county. Out of people who lived in different houses, 33% moved from different county within same state. Out of people who lived in different houses, 21% moved from different state. Out of people who lived in different houses, 2% moved from abroad.
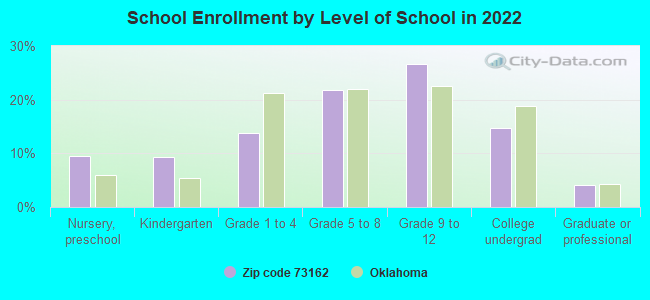
Private vs. public school enrollment:
Students in private schools in grades 1 to 8 (elementary and middle school): 420
Here:
16.8%
Oklahoma:
11.7%
Students in private schools in grades 9 to 12 (high school): 206
Here:
11.1%
Oklahoma:
11.7%
Students in private undergraduate colleges: 262
Here:
25.2%
Oklahoma:
19.3%
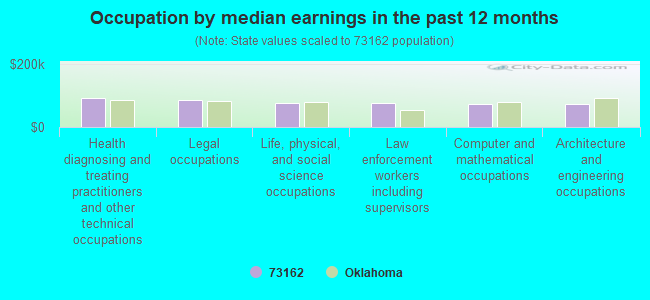
Occupation by median earnings in the past 12 months ($)
91,068Health diagnosing and treating practitioners and other technical occupations
84,508Legal occupations
76,075Life, physical, and social science occupations
75,698Law enforcement workers including supervisors
73,825Computer and mathematical occupations
72,579Architecture and engineering occupations
Companies with federal contracts located in this zip code (OKLAHOMA CITY, OK):
DEIMOS SOLUTIONS LLC (5809 NW 103RD PL; small business) : $85,458 in 2 contractsfrom 2004 to 2005
$50,808 with Air Force for ADP Support Equipment. Signed on 2005-08-12. Completion date: 2005-12-10.
$34,650, same as above.Signed on 2004-11-23. Completion date: 2005-01-22.
ENVIRO CLEAN SERVICES L L C (9520 REGAL LN; small business) : $66,662 in 2 contractsfrom 2001 to 2002
$33,331 with Air Force for Maintenance, Repair and Rebuilding of Equipment -- Water Purification and Sewage Treatment Equipment. Signed on 2002-05-02. Completion date: 2002-05-15.
$33,331 with Air Force for Water Services. Signed on 2001-11-26. Completion date: 2001-12-31.
SLRS INC (9500 WESTGATE RD STE 200; small business) : $57,610 in 6 contractsfrom 2004 to 2006
Contracts for Services -- Management and Support (R&D), Personal Care Services (includes such services as barber and beauty shop, shoe repairs, tailoring, etc.), Other ADP and Telecommunications Services (includes data storage on tapes, compact disks, etc.), Translation and Interpreting Services(Including Sign Language) by Immediate Office of the Secretary of Transportation, Air Force Signed by year:2000: $0; 2001: $0; 2002: $0; 2003: $0; 2004: $17,000; 2005: $24,085; 2006: $16,525.
Biggest contracts:
$20,350 with Immediate Office of the Secretary of Transportation for Services -- Management and Support (R&D). Taking place in DC. Signed on 2005-07-15. Completion date: 2005-12-31.
$17,000, same as above.Signed on 2004-12-09. Completion date: 2005-09-30.
$13,000 with Immediate Office of the Secretary of Transportation for Personal Care Services (includes such services as barber and beauty shop, shoe repairs, tailoring, etc.). Signed on 2006-02-16. Completion date: 2010-09-30.
$3,735 with Air Force for Other ADP and Telecommunications Services (includes data storage on tapes, compact disks, etc.). Signed on 2005-04-29. Completion date: 2005-05-06.
STARCOM COMMUNICATIONS (11016 N GROVE AVE; small business) 50 employees, $0 revenue. : $12,469 in 2 contractsfrom 2004 to 2005
$7,529 with Army for Information and Data Broadcasting or Data Distribution Services. Signed on 2004-03-11. Completion date: 2004-04-08.
$4,940 with Army for Communications Services. Signed on 2005-09-28. Completion date: 2005-09-30.
Top industries in this zip code by the number of employees in 2005:
2002 - 2018 National Fire Incident Reporting System (NFIRS) incidents
According to the data from the years 2002 - 2018 the average number of fire incidents per year is 48. The highest number of reported fire incidents - 71 took place in 2008, and the least - 30 in 2012. The data has a decreasing trend.
When looking into fire subcategories, the most reports belonged to: Outside Fires (39.5%), and Structure Fires (35.3%).
Fire incident types reported to NFIRS in Zip Code 73162
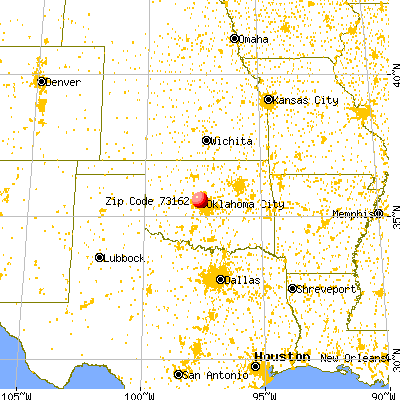


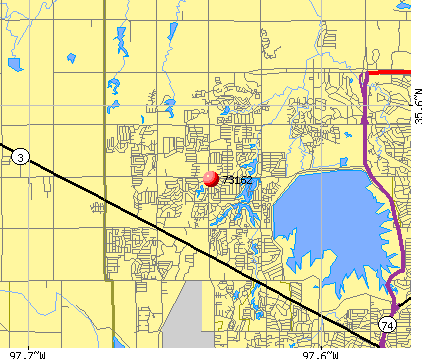 Nearest zip codes: 73132, 73142, 73120, 73122, 73008, 73134.
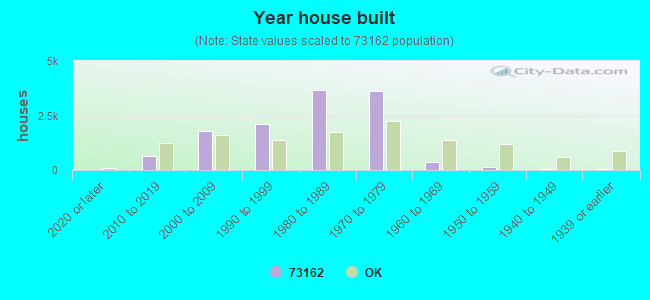


 According to the data from the years 2002 - 2018 the average number of fire incidents per year is 48. The highest number of reported fire incidents - 71 took place in 2008, and the least - 30 in 2012. The data has a decreasing trend.
 When looking into fire subcategories, the most reports belonged to: Outside Fires (39.5%), and Structure Fires (35.3%).