Estimated zip code population in 2022: 3,108 Zip code population in 2010: 3,185 Zip code population in 2000: 3,320
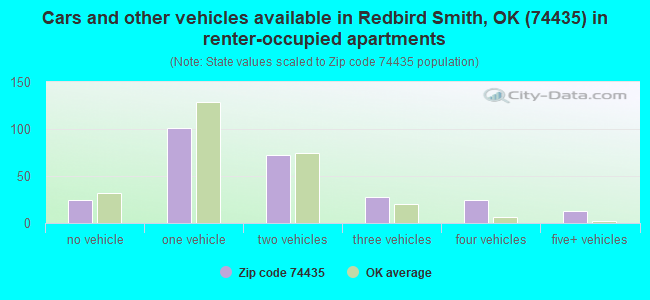
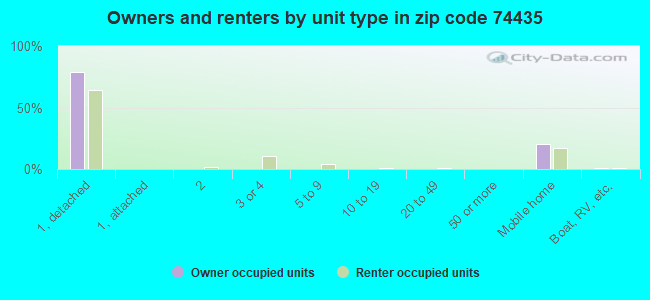
Houses and condos: 1,793 Renter-occupied apartments: 265
% of renters here:
22%
State:
35%
March 2022 cost of living index in zip code 74435: 79.3 (low, U.S. average is 100)
Land area: 65.0 sq. mi. Water area: 8.5 sq. mi.
Population density: 48 people per square mile
(very low).
OSM Map
General Map
Google Map
MSN Map
OSM Map
General Map
Google Map
MSN Map
OSM Map
General Map
Google Map
MSN Map
OSM Map
General Map
Google Map
MSN Map
Please wait while loading the map...
Real estate property taxes paid for housing units in 2022:
This zip code:
0.5% ($691)
Oklahoma:
0.8% ($1,501)
Median real estate property taxes paid for housing units with mortgages in 2022: $1,159 (0.6%) Median real estate property taxes paid for housing units with no mortgage in 2022: $497 (0.5%)
Business Search- 14 Million verified businesses
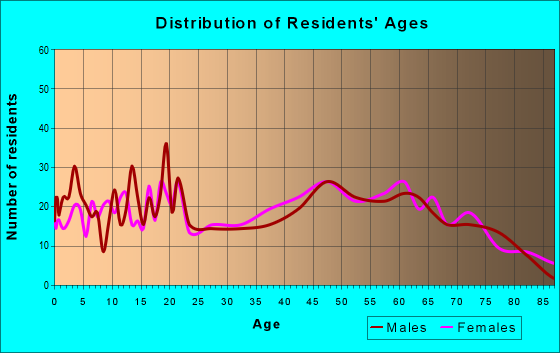
Males: 1,483
(47.7%)
Females: 1,624
(52.3%)
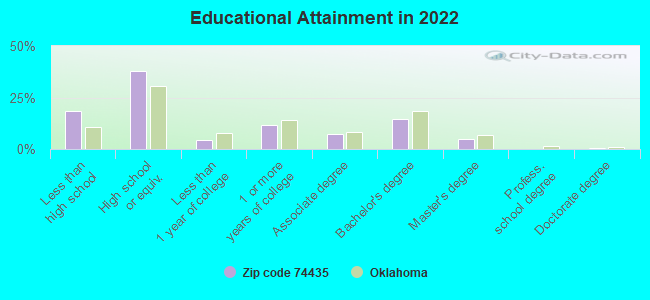
For population 25 years and over in 74435:
High school or higher: 80.0%
Bachelor's degree or higher: 19.9%
Graduate or professional degree: 5.6%
Unemployed: 8.2%
Mean travel time to work (commute): 25.3 minutes
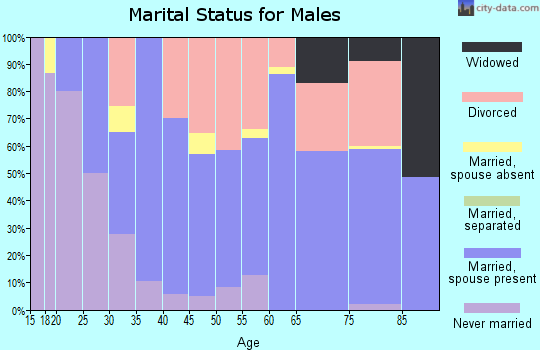
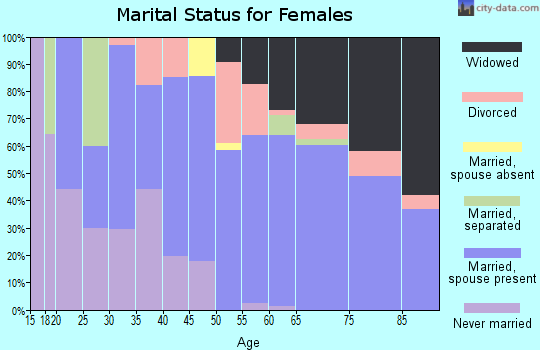
For population 15 years and over in 74435:
Never married: 19.0%
Now married: 59.6%
Separated: 0.8%
Widowed: 8.3%
Divorced: 12.3%
Zip code 74435 compared to state average:
Unemployed percentage above state average.
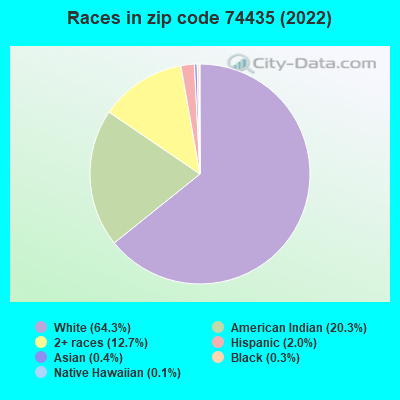
Black race population percentage significantly below state average.
Hispanic race population percentage significantly below state average.
Median age significantly above state average.
Foreign-born population percentage significantly below state average.
Renting percentage below state average.
Length of stay since moving in significantly above state average.
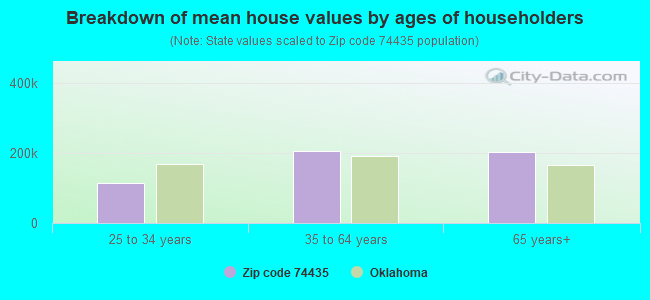
Estimated median house/condo value in 2022: $138,294
74435:
$138,294
Oklahoma:
$191,700
According to our research of Oklahoma and other state lists, there were 7 registered sex offenders living in 74435 zip code as of April 27, 2024. The ratio of all residents to sex offenders in zip code 74435 is 433 to 1. The ratio of registered sex offenders to all residents in this zip code is near the state average.
Median resident age:
This zip code:
51.2 years
Oklahoma median age:
37.1 years
Average household size:
This zip code:
2.5 people
Oklahoma:
2.5 people
Averages for the 2020 tax year for zip code 74435, filed in 2021:
Average Adjusted Gross Income (AGI) in 2020: $53,139 (Individual Income Tax Returns)
Here:
$53,139
State:
$63,060
Salary/wage: $41,242 (reported on 82.4% of returns)
Here:
$41,242
State:
$52,427
(% of AGI for various income ranges: 1046.9% for AGIs below $25k, 3391.3% for AGIs $25k-50k, 6164.7% for AGIs $50k-75k, 8938.8% for AGIs $75k-100k, 11960.0% for AGIs $100k-200k)
Taxable interest for individuals: $546 (reported on 20.8% of returns)
This zip code:
$546
Oklahoma:
$1,603
(% of AGI for various income ranges: 3.3% for AGIs below $25k, 5.3% for AGIs $25k-50k, 11.3% for AGIs $50k-75k, 2.5% for AGIs $75k-100k, 135.7% for AGIs $100k-200k)
Ordinary dividends: $1,038 (reported on 6.4% of returns)
Here:
$1,038
State:
$7,001
(% of AGI for various income ranges: 4.7% for AGIs below $25k, 9.3% for AGIs $50k-75k, 74.3% for AGIs $100k-200k)
Net capital gain/loss in AGI: +$15,389 (reported on 7.2% of returns)
Here:
+$15,389
State:
+$19,855
(% of AGI for various income ranges: 2.5% for AGIs below $25k, 97.3% for AGIs $50k-75k, 1757.1% for AGIs $100k-200k)
Profit/loss from business: +$8,783 (reported on 14.4% of returns)
Here:
+$8,783
State:
+$9,904
(% of AGI for various income ranges: 163.6% for AGIs below $25k, 155.0% for AGIs $25k-50k, 148.0% for AGIs $50k-75k, 380.0% for AGIs $75k-100k, 1.4% for AGIs $100k-200k)
Taxable individual retirement arrangement distribution: $15,557 (reported on 5.6% of returns)
74435:
$15,557
Oklahoma:
$20,476
(% of AGI for various income ranges: 98.9% for AGIs below $25k, 916.2% for AGIs $75k-100k)
Total itemized deductions: $32,500 (reported on 4.0% of returns)
Here:
$32,500
State:
$39,736
(% of AGI for various income ranges: 2321.4% for AGIs $100k-200k)
Charity contributions: $12,967 (reported on 2.4% of returns)
Here:
$12,967
State:
$17,288
(% of AGI for various income ranges: 486.2% for AGIs $75k-100k)
Taxes paid: $6,800 (reported on 3.2% of returns)
74435:
$6,800
State:
$7,046
(% of AGI for various income ranges: 388.6% for AGIs $100k-200k)
Earned income credit: $2,309 (reported on 27.2% of returns)
Here:
$2,309
State:
$2,435
(% of AGI for various income ranges: 122.2% for AGIs below $25k, 115.0% for AGIs $25k-50k)
Percentage of individuals using paid preparers for their 2020 taxes: 97.6%
Here:
98%
State:
94%
(% for various income ranges: 95.7% for AGIs below $25k, 97.1% for AGIs $25k-50k, 100.0% for AGIs $50k-75k, 100.0% for AGIs $75k-100k, 100.0% for AGIs $100k-200k, 100.0% for AGIs over 200k)
Averages for the 2012 tax year for zip code 74435, filed in 2013:
Average Adjusted Gross Income (AGI) in 2012: $42,839 (Individual Income Tax Returns)
Here:
$42,839
State:
$58,581
Salary/wage: $36,781 (reported on 84.5% of returns)
Here:
$36,781
State:
$45,973
(% of AGI for various income ranges: 71.6% for AGIs below $25k, 78.2% for AGIs $25k-50k, 83.5% for AGIs $50k-75k, 84.0% for AGIs $75k-100k, 57.0% for AGIs $100k-200k)
Taxable interest for individuals: $846 (reported on 20.7% of returns)
This zip code:
$846
Oklahoma:
$1,625
(% of AGI for various income ranges: 0.7% for AGIs below $25k, 0.4% for AGIs $25k-50k, 0.1% for AGIs $50k-75k, 0.1% for AGIs $75k-100k, 0.6% for AGIs $100k-200k)
Ordinary dividends: $822 (reported on 7.8% of returns)
Here:
$822
State:
$6,374
(% of AGI for various income ranges: 0.5% for AGIs below $25k, 0.2% for AGIs $100k-200k)
Net capital gain/loss in AGI: +$2,929 (reported on 6.0% of returns)
Here:
+$2,929
State:
+$24,023
Profit/loss from business: +$5,471 (reported on 14.7% of returns)
Here:
+$5,471
State:
+$11,913
(% of AGI for various income ranges: 8.4% for AGIs below $25k, 1.4% for AGIs $50k-75k, 3.5% for AGIs $75k-100k)
Taxable individual retirement arrangement distribution: $9,838 (reported on 6.9% of returns)
74435:
$9,838
Oklahoma:
$15,242
Total itemized deductions: $21,438 (24% of AGI, reported on 20.7% of returns)
Here:
$21,438
State:
$24,882
Here:
24.4% of AGI
State:
18.8% of AGI
(% of AGI for various income ranges: 7.4% for AGIs below $25k, 7.7% for AGIs $25k-50k, 11.1% for AGIs $50k-75k, 12.5% for AGIs $75k-100k, 12.1% for AGIs $100k-200k)
Charity contributions: $4,500 (reported on 14.7% of returns)
Here:
$4,500
State:
$6,591
(% of AGI for various income ranges: 0.9% for AGIs below $25k, 1.2% for AGIs $25k-50k, 1.5% for AGIs $50k-75k, 2.0% for AGIs $75k-100k, 1.9% for AGIs $100k-200k)
Taxes paid: $4,383 (reported on 19.8% of returns)
74435:
$4,383
State:
$7,196
(% of AGI for various income ranges: 0.5% for AGIs below $25k, 0.9% for AGIs $25k-50k, 1.7% for AGIs $50k-75k, 2.5% for AGIs $75k-100k, 3.5% for AGIs $100k-200k)
Earned income credit: $2,544 (reported on 27.6% of returns)
Here:
$2,544
State:
$2,354
(% of AGI for various income ranges: 8.7% for AGIs below $25k, 1.9% for AGIs $25k-50k)
Percentage of individuals using paid preparers for their 2012 taxes: 65.5%
Here:
66%
State:
56%
(% for various income ranges: 61.1% for AGIs below $25k, 71.4% for AGIs $25k-50k, 61.1% for AGIs $50k-75k, 71.4% for AGIs $75k-100k, 77.8% for AGIs $100k-200k)
Averages for the 2004 tax year for zip code 74435, filed in 2005:
Average Adjusted Gross Income (AGI) in 2004: $30,197 (Individual Income Tax Returns)
Here:
$30,197
State:
$41,245
Salary/wage: $28,768 (reported on 82.8% of returns)
Here:
$28,768
State:
$35,318
(% of AGI for various income ranges: 124.9% for AGIs below $10k, 72.9% for AGIs $10k-25k, 83.2% for AGIs $25k-50k, 85.0% for AGIs $50k-75k, 83.7% for AGIs $75k-100k, 51.3% for AGIs over 100k)
Taxable interest for individuals: $1,030 (reported on 27.1% of returns)
This zip code:
$1,030
Oklahoma:
$1,745
(% of AGI for various income ranges: 4.1% for AGIs below $10k, 2.0% for AGIs $10k-25k, 0.9% for AGIs $25k-50k, 0.3% for AGIs $50k-75k, 0.2% for AGIs $75k-100k, 0.8% for AGIs over 100k)
Taxable dividends: $605 (reported on 9.2% of returns)
Here:
$605
State:
$2,920
(% of AGI for various income ranges: 0.9% for AGIs below $10k, 0.2% for AGIs $10k-25k, 0.0% for AGIs $25k-50k, 0.2% for AGIs $50k-75k, 0.2% for AGIs $75k-100k, 0.5% for AGIs over 100k)
Profit/loss from business: +$4,618 (reported on 17.7% of returns)
Here:
+$4,618
State:
+$8,532
(% of AGI for various income ranges: 1.4% for AGIs below $10k, 7.9% for AGIs $10k-25k, 2.4% for AGIs $25k-50k, -0.5% for AGIs $50k-75k, 5.1% for AGIs $75k-100k)
IRA payment deduction: $3,100 (reported on 1.6% of returns)
74435:
$3,100
Oklahoma:
$3,127
Total itemized deductions: $16,158 (27% of AGI, reported on 21.4% of returns)
Here:
$16,158
State:
$17,093
Here:
27.3% of AGI
State:
20.5% of AGI
(% of AGI for various income ranges: 10.2% for AGIs below $10k, 6.3% for AGIs $10k-25k, 11.4% for AGIs $25k-50k, 13.4% for AGIs $50k-75k, 15.1% for AGIs $75k-100k, 11.6% for AGIs over 100k)
Charity contributions deductions: $3,693 (6% of AGI, reported on 17.3% of returns)
Here:
$3,693
State:
$4,240
Here:
5.8% of AGI
State:
4.8% of AGI
(% of AGI for various income ranges: 1.3% for AGIs $10k-25k, 2.2% for AGIs $25k-50k, 2.4% for AGIs $50k-75k, 3.3% for AGIs $75k-100k, 1.9% for AGIs over 100k)
Total tax: $3,565 (reported on 64.0% of returns)
74435:
$3,565
State:
$6,542
(% of AGI for various income ranges: 4.7% for AGIs below $10k, 3.2% for AGIs $10k-25k, 5.2% for AGIs $25k-50k, 7.5% for AGIs $50k-75k, 10.7% for AGIs $75k-100k, 16.7% for AGIs over 100k)
Earned income credit: $1,895 (reported on 28.5% of returns)
Here:
$1,895
State:
$1,830
Percentage of individuals using paid preparers for their 2004 taxes: 67.2%
Here:
67%
State:
63%
(% for various income ranges: 60.3% for AGIs below $10k, 73.2% for AGIs $10k-25k, 65.8% for AGIs $25k-50k, 64.5% for AGIs $50k-75k, 69.1% for AGIs $75k-100k, 83.3% for AGIs over 100k)
Household received Food Stamps/SNAP in the past 12 months: 290 Household did not receive Food Stamps/SNAP in the past 12 months: 933
Women who had a birth in the past 12 months: 27 (28 now married, 0 unmarried) Women who did not have a birth in the past 12 months: 517 (263 now married, 253 unmarried)
Housing units in zip code 74435 with a mortgage: 406 (7 second mortgage, 7 both second mortgage and home equity loan) Median monthly owner costs for units with a mortgage: $1,219 Median monthly owner costs for units without a mortgage: $385
Residents with income below the poverty level in 2022:
This zip code:
14.2%
Whole state:
15.7%
Residents with income below 50% of the poverty level in 2022:
This zip code:
9.4%
Whole state:
8.3%
Median number of rooms in houses and condos:
Here:
5.7
State:
6.1
Median number of rooms in apartments:
Here:
5.1
State:
4.5
Notable locations in this zip code not listed on our city pages
Churches in zip code 74435 include: Cedar Spring Church (A), Gum Spring Church (B), House of Prayer (C), White Chapel (D). Display/hide their locations on the map
Cemeteries: Wilson Cemetery (1), Gore Cemetery (2), White Cemetery (3), Plunkett Cemetery (4), Phillips Cemetery (5), Plunkett Cemetery (6), Sam Cemetery (7). Display/hide their locations on the map
Streams, rivers, and creeks: Brushy Branch (A), Big Branch (B), Taylor Creek (C), Sulphur Branch (D), Cedar Creek (E), Salt Branch (F), Red Bird Smith Creek (G), Greenleaf Creek (H), Linder Branch (I). Display/hide their locations on the map
339 married couples with children.
95 single-parent households (18 men, 77 women).
97.4% of residents of 74435 zip code speak English at home.
0.2% of residents speak Spanish at home (100% very well).
0.8% of residents speak other Indo-European language at home (100% very well).
1.1% of residents speak Asian or Pacific Island language at home (94% very well, 6% not well).
1.1% of residents speak other language at home (79% very well, 21% well).
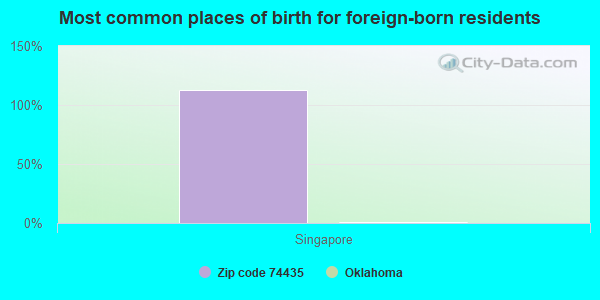
Foreign born population: 8 (0.3%) (0.0% of them are naturalized citizens)
:
0.3%
Whole state:
6.0%
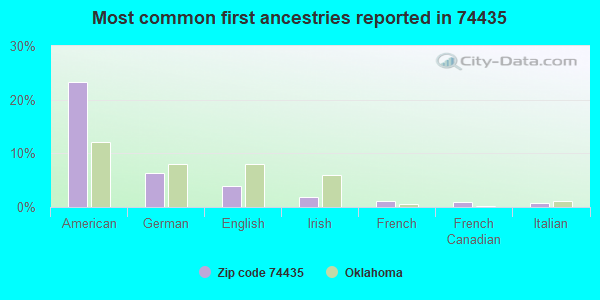
112%Singapore
23%American
6%German
4%English
2%Irish
1%French
1%French Canadian
1%Italian
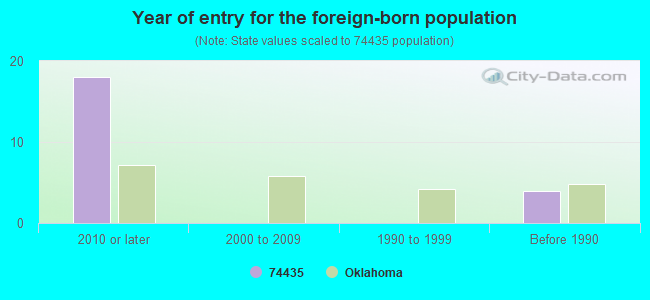
Year of entry for the foreign-born population
182010 or later
02000 to 2009
01990 to 1999
4Before 1990
Facilities with environmental interests located in this zip code:
GORE ES (215 WEST FOURTH in GORE, OK)
(National Center for Education Statistics) - STATE ID-68-I006-105
GORE HS (1200 NORTHWAY 10 in GORE, OK)
(National Center for Education Statistics) - STATE ID-68-I006-715
GORE UPPER ES (HIGHWAY 10-A in GORE, OK)
(National Center for Education Statistics) - STATE ID-68-I006-115
GORE PUBLIC WORKS AUTHORITY (P.O. BOX 329 in GORE, OK)
National Pollutant Discharge Elimination System NON-MAJOR (Tracking pollutant discharge elimination systems) - permit Business SIC classification: WATER SUPPLY
GORE PUBLIC SCHOOLS (1200 NORTHWAY 10, 4TH & WINN in GORE, OK)
COMPLIANCE ACTIVITY (Tracking inspections of insecticide, fungicide, and rodenticide, and toxic substances) Business SIC classification: ELEMENTARY AND SECONDARY SCHOOLS
Housing units lacking complete plumbing facilities: 3.1% Housing units lacking complete kitchen facilities: 3.7%
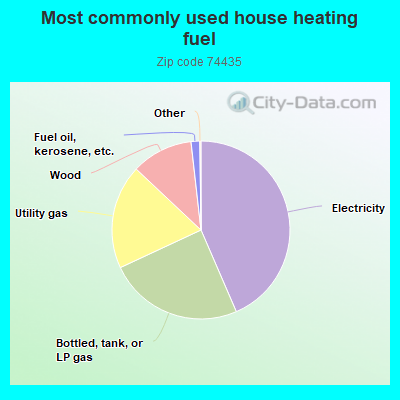
43.6%Electricity
24.6%Bottled, tank, or LP gas
19.0%Utility gas
11.2%Wood
1.6%Fuel oil, kerosene, etc.
Population in 1990: 1,167. Population change in the 1990s: +2,153 (+184.5%).
Place of birth for U.S.-born residents:
This state: 2,026
Northeast: 49
Midwest: 285
South: 438
West: 290
64% of the 74435 zip code residents lived in the same house 5 years ago. Out of people who lived in different houses, 46% lived in this county. Out of people who lived in different counties, 50% lived in Oklahoma.
93% of the 74435 zip code residents lived in the same house 1 year ago. Out of people who lived in different houses, 36% moved from this county. Out of people who lived in different houses, 30% moved from different county within same state. Out of people who lived in different houses, 42% moved from different state.
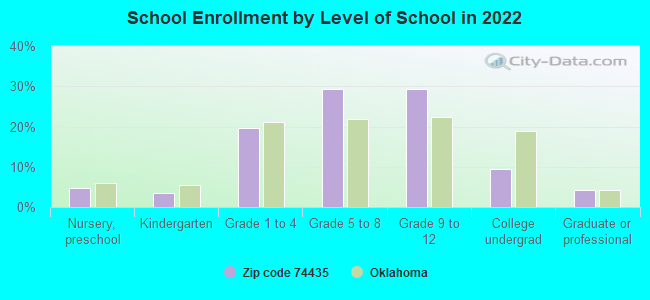
Private vs. public school enrollment:
Students in private schools in grades 1 to 8 (elementary and middle school): 10
Here:
3.8%
Oklahoma:
11.7%
Students in private schools in grades 9 to 12 (high school): 24
Here:
15.2%
Oklahoma:
11.7%
Students in private undergraduate colleges:
Here:
0.0%
Oklahoma:
19.3%
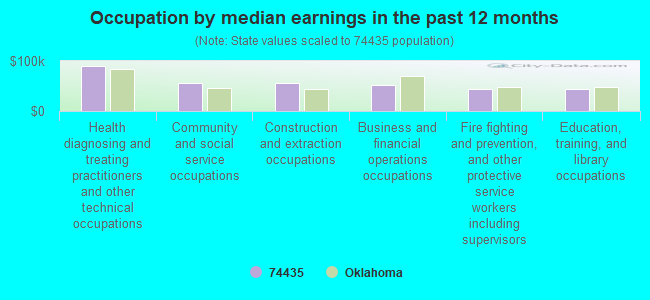
Occupation by median earnings in the past 12 months ($)
89,256Health diagnosing and treating practitioners and other technical occupations
55,540Community and social service occupations
55,275Construction and extraction occupations
51,999Business and financial operations occupations
44,653Fire fighting and prevention, and other protective service workers including supervisors
44,186Education, training, and library occupations
Companies with federal contracts located in this zip code:
ADVANCED MAINTENANCE (100 SHARON ST in GORE, OK; small business) : $168,849 in 5 contractsfrom 2004 to 2006
Contracts for Landscaping/Groundskeeping Services, Custodial Janitorial Services by Army, U.S. Army Corps of Engineers - civil program financing only Signed by year:2000: $0; 2001: $0; 2002: $0; 2003: $0; 2004: $32,650; 2005: $33,350; 2006: $102,849.
Biggest contracts:
$102,849 with Army for Landscaping/Groundskeeping Services. Signed on 2006-04-05. Completion date: 2007-03-31.
$16,675 with Army for Custodial Janitorial Services. Signed on 2005-03-15. Completion date: 2005-03-31.
$16,675 with U.S. Army Corps of Engineers - civil program financing only for Custodial Janitorial Services. Signed on 2005-03-15. Completion date: 2005-03-31.
$16,325 with Army for Custodial Janitorial Services. Signed on 2004-03-08. Completion date: 2005-03-31.
VICTORIA R COX (STRAYHORN PUBLIC USE AREA in GORE, OK; small business) : $31,490 in 6 contractsfrom 2004 to 2006
Contracts for Operation of Government-Owned Facilities -- Other Conservation and Development Facilities, Other Administrative Support Services by Army, U.S. Army Corps of Engineers - civil program financing only Signed by year:2000: $0; 2001: $0; 2002: $0; 2003: $0; 2004: $11,400; 2005: $11,400; 2006: $8,690.
Biggest contracts:
$7,205 with Army for Operation of Government-Owned Facilities -- Other Conservation and Development Facilities. Taking place in AR. Signed on 2006-03-22. Completion date: 2006-10-30.
$5,700 with U.S. Army Corps of Engineers - civil program financing only for Other Administrative Support Services. Signed on 2005-02-14. Completion date: 2004-03-12.
$5,700 with Army for Other Administrative Support Services. Signed on 2005-02-14. Completion date: 2004-03-12.
$5,700 with U.S. Army Corps of Engineers - civil program financing only for Other Administrative Support Services. Signed on 2004-03-19. Completion date: 2004-03-12.
COX & JOHNSON (RT 1 BOX 298 in GORE, OK; small business) : $22,195 in 6 contractsfrom 2004 to 2005
Contracts for Waste Treatment and Storage by U.S. Army Corps of Engineers - civil program financing only, Army Signed by year:2000: $0; 2001: $0; 2002: $0; 2003: $0; 2004: $19,420; 2005: $2,775; 2006: $0.
Biggest contracts:
$6,340 with U.S. Army Corps of Engineers - civil program financing only for Waste Treatment and Storage. Signed on 2004-10-27. Completion date: 2004-10-31.
$6,340 with Army for Waste Treatment and Storage. Signed on 2004-10-27. Completion date: 2004-10-31.
$5,745, same as above.Signed on 2005-12-22. Completion date: 2004-10-31.
$3,370 with U.S. Army Corps of Engineers - civil program financing only for Waste Treatment and Storage. Signed on 2004-03-08. Completion date: 2004-10-31.
Top industries in this zip code by the number of employees in 2005:
Health Care and Social Assistance: Nursing Care Facilities (50-99 employees: 2 establishments)
Health Care and Social Assistance: Home Health Care Services (20-49: 1)
Accommodation and Food Services: All Other Traveler Accommodation (20-49: 1)
Accommodation and Food Services: Limited-Service Restaurants (10-19: 1, 1-4: 1)
Finance and Insurance: Commercial Banking (10-19: 1)
Mining: Construction Sand and Gravel Mining (10-19: 1)
Accommodation and Food Services: Full-Service Restaurants (5-9: 1, 1-4: 4)
Health Care and Social Assistance: Other Residential Care Facilities (10-19: 1)
People in group quarters in 2010:
58 people in nursing facilities/skilled-nursing facilities
People in group quarters in 2000:
54 people in nursing homes
19 people in other noninstitutional group quarters
Fatal accident statistics in 2012:
Fatal accident count: 1
Vehicles involved in fatal accidents: 1
Fatal accidents caused by drunken drivers: 0
Fatalities: 1
Persons involved in fatal accidents: 1
Pedestrians involved in fatal accidents: 0
Fatal accident statistics in 2011:
Fatal accident count: 1
Vehicles involved in fatal accidents: 1
Fatal accidents caused by drunken drivers: 1
Fatalities: 1
Persons involved in fatal accidents: 4
Pedestrians involved in fatal accidents: 0
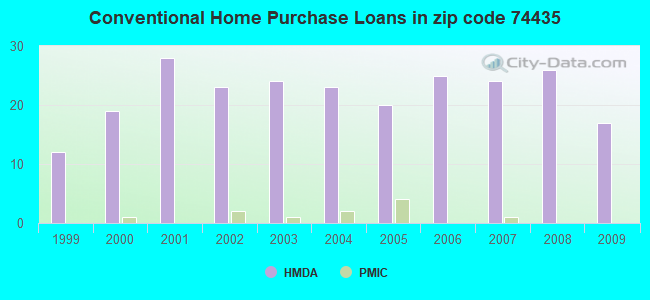
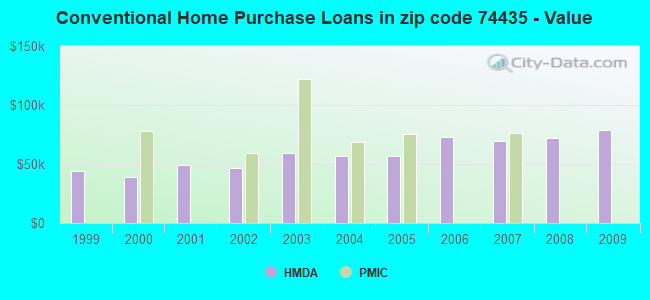
Home Mortgage Disclosure Act Aggregated Statistics For Year 2009 (Based on 10 partial tracts)
A) FHA, FSA/RHS & VA Home Purchase Loans
B) Conventional Home Purchase Loans
C) Refinancings
D) Home Improvement Loans
F) Non-occupant Loans on < 5 Family Dwellings (A B C & D)
G) Loans On Manufactured Home Dwelling (A B C & D)
Number
Average Value
Number
Average Value
Number
Average Value
Number
Average Value
Number
Average Value
Number
Average Value
LOANS ORIGINATED
6
$103,073
17
$79,118
21
$136,349
7
$42,350
14
$92,441
7
$38,116
APPLICATIONS APPROVED, NOT ACCEPTED
0
$0
2
$69,195
1
$182,460
0
$0
0
$0
1
$54,310
APPLICATIONS DENIED
1
$80,990
6
$66,703
9
$122,647
2
$26,680
2
$153,645
3
$49,627
APPLICATIONS WITHDRAWN
0
$0
0
$0
4
$111,120
0
$0
0
$0
1
$59,070
FILES CLOSED FOR INCOMPLETENESS
0
$0
0
$0
2
$104,480
0
$0
0
$0
0
$0
Aggregated Statistics For Year 2008 (Based on 10 partial tracts)
A) FHA, FSA/RHS & VA Home Purchase Loans
B) Conventional Home Purchase Loans
C) Refinancings
D) Home Improvement Loans
F) Non-occupant Loans on < 5 Family Dwellings (A B C & D)
G) Loans On Manufactured Home Dwelling (A B C & D)
Number
Average Value
Number
Average Value
Number
Average Value
Number
Average Value
Number
Average Value
Number
Average Value
LOANS ORIGINATED
4
$85,455
26
$71,954
16
$87,897
10
$36,846
20
$67,292
18
$30,161
APPLICATIONS APPROVED, NOT ACCEPTED
0
$0
2
$51,450
1
$114,570
1
$22,390
1
$13,580
2
$48,115
APPLICATIONS DENIED
1
$108,140
7
$40,966
10
$112,883
3
$26,440
1
$112,430
4
$42,818
APPLICATIONS WITHDRAWN
0
$0
1
$113,140
4
$114,158
0
$0
0
$0
0
$0
FILES CLOSED FOR INCOMPLETENESS
0
$0
0
$0
0
$0
0
$0
0
$0
0
$0
Aggregated Statistics For Year 2007 (Based on 10 partial tracts)
A) FHA, FSA/RHS & VA Home Purchase Loans
B) Conventional Home Purchase Loans
C) Refinancings
D) Home Improvement Loans
F) Non-occupant Loans on < 5 Family Dwellings (A B C & D)
G) Loans On Manufactured Home Dwelling (A B C & D)
Number
Average Value
Number
Average Value
Number
Average Value
Number
Average Value
Number
Average Value
Number
Average Value
LOANS ORIGINATED
4
$86,400
24
$69,521
22
$82,192
10
$33,992
11
$86,675
12
$31,052
APPLICATIONS APPROVED, NOT ACCEPTED
0
$0
4
$54,250
3
$68,363
1
$38,830
0
$0
4
$42,818
APPLICATIONS DENIED
1
$78,840
10
$58,235
12
$107,192
5
$21,486
2
$59,670
6
$54,540
APPLICATIONS WITHDRAWN
0
$0
2
$53,000
6
$75,597
1
$57,640
1
$34,300
1
$55,260
FILES CLOSED FOR INCOMPLETENESS
0
$0
0
$0
1
$166,030
0
$0
0
$0
0
$0
Aggregated Statistics For Year 2006 (Based on 10 partial tracts)
A) FHA, FSA/RHS & VA Home Purchase Loans
B) Conventional Home Purchase Loans
C) Refinancings
D) Home Improvement Loans
F) Non-occupant Loans on < 5 Family Dwellings (A B C & D)
G) Loans On Manufactured Home Dwelling (A B C & D)
Number
Average Value
Number
Average Value
Number
Average Value
Number
Average Value
Number
Average Value
Number
Average Value
LOANS ORIGINATED
5
$76,128
25
$72,469
32
$84,211
10
$39,191
14
$82,612
13
$37,418
APPLICATIONS APPROVED, NOT ACCEPTED
0
$0
5
$63,124
1
$127,680
0
$0
2
$58,595
3
$33,507
APPLICATIONS DENIED
2
$72,650
9
$41,279
17
$91,511
3
$17,177
3
$53,517
9
$37,918
APPLICATIONS WITHDRAWN
0
$0
3
$55,563
6
$107,825
2
$137,755
2
$61,430
0
$0
FILES CLOSED FOR INCOMPLETENESS
0
$0
1
$59,550
1
$136,490
0
$0
0
$0
0
$0
Aggregated Statistics For Year 2005 (Based on 10 partial tracts)
A) FHA, FSA/RHS & VA Home Purchase Loans
B) Conventional Home Purchase Loans
C) Refinancings
D) Home Improvement Loans
F) Non-occupant Loans on < 5 Family Dwellings (A B C & D)
G) Loans On Manufactured Home Dwelling (A B C & D)
Number
Average Value
Number
Average Value
Number
Average Value
Number
Average Value
Number
Average Value
Number
Average Value
LOANS ORIGINATED
4
$86,562
20
$57,074
27
$69,337
8
$41,358
8
$52,434
13
$34,620
APPLICATIONS APPROVED, NOT ACCEPTED
0
$0
4
$57,608
2
$82,535
0
$0
0
$0
4
$46,768
APPLICATIONS DENIED
1
$54,070
10
$54,300
16
$83,737
5
$27,646
1
$81,230
10
$47,321
APPLICATIONS WITHDRAWN
0
$0
1
$63,120
9
$105,258
1
$27,390
0
$0
1
$55,980
FILES CLOSED FOR INCOMPLETENESS
0
$0
0
$0
0
$0
0
$0
0
$0
0
$0
Aggregated Statistics For Year 2004 (Based on 10 partial tracts)
A) FHA, FSA/RHS & VA Home Purchase Loans
B) Conventional Home Purchase Loans
C) Refinancings
D) Home Improvement Loans
F) Non-occupant Loans on < 5 Family Dwellings (A B C & D)
G) Loans On Manufactured Home Dwelling (A B C & D)
Number
Average Value
Number
Average Value
Number
Average Value
Number
Average Value
Number
Average Value
Number
Average Value
LOANS ORIGINATED
3
$89,007
23
$56,768
45
$67,033
6
$37,755
13
$72,777
17
$26,652
APPLICATIONS APPROVED, NOT ACCEPTED
0
$0
2
$31,560
3
$92,583
0
$0
1
$102,440
2
$35,255
APPLICATIONS DENIED
1
$41,080
11
$40,692
18
$71,989
5
$29,962
1
$49,070
10
$35,458
APPLICATIONS WITHDRAWN
0
$0
1
$40,260
6
$80,908
0
$0
1
$22,870
0
$0
FILES CLOSED FOR INCOMPLETENESS
0
$0
0
$0
1
$82,420
0
$0
0
$0
0
$0
Aggregated Statistics For Year 2003 (Based on 10 partial tracts)
A) FHA, FSA/RHS & VA Home Purchase Loans
B) Conventional Home Purchase Loans
C) Refinancings
D) Home Improvement Loans
F) Non-occupant Loans on < 5 Family Dwellings (A B C & D)
Number
Average Value
Number
Average Value
Number
Average Value
Number
Average Value
Number
Average Value
LOANS ORIGINATED
3
$57,110
24
$59,681
50
$65,680
3
$10,720
11
$61,018
APPLICATIONS APPROVED, NOT ACCEPTED
0
$0
2
$55,025
4
$66,578
0
$0
0
$0
APPLICATIONS DENIED
1
$64,790
11
$35,384
23
$68,250
4
$30,072
2
$56,095
APPLICATIONS WITHDRAWN
0
$0
1
$20,960
8
$74,795
0
$0
0
$0
FILES CLOSED FOR INCOMPLETENESS
0
$0
0
$0
1
$125,050
0
$0
0
$0
Aggregated Statistics For Year 2002 (Based on 10 partial tracts)
A) FHA, FSA/RHS & VA Home Purchase Loans
B) Conventional Home Purchase Loans
C) Refinancings
D) Home Improvement Loans
F) Non-occupant Loans on < 5 Family Dwellings (A B C & D)
Number
Average Value
Number
Average Value
Number
Average Value
Number
Average Value
Number
Average Value
LOANS ORIGINATED
3
$63,997
23
$46,533
42
$59,132
5
$23,658
8
$46,395
APPLICATIONS APPROVED, NOT ACCEPTED
0
$0
4
$74,020
6
$61,058
0
$0
0
$0
APPLICATIONS DENIED
0
$0
11
$47,863
16
$69,946
2
$12,865
1
$48,120
APPLICATIONS WITHDRAWN
0
$0
1
$49,780
5
$68,650
0
$0
0
$0
FILES CLOSED FOR INCOMPLETENESS
0
$0
0
$0
1
$83,130
0
$0
0
$0
Aggregated Statistics For Year 2001 (Based on 10 partial tracts)
A) FHA, FSA/RHS & VA Home Purchase Loans
B) Conventional Home Purchase Loans
C) Refinancings
D) Home Improvement Loans
F) Non-occupant Loans on < 5 Family Dwellings (A B C & D)
Number
Average Value
Number
Average Value
Number
Average Value
Number
Average Value
Number
Average Value
LOANS ORIGINATED
3
$60,343
28
$48,937
37
$48,032
5
$15,212
6
$49,433
APPLICATIONS APPROVED, NOT ACCEPTED
0
$0
4
$55,202
3
$74,793
0
$0
0
$0
APPLICATIONS DENIED
0
$0
12
$42,221
10
$57,311
4
$30,278
1
$36,440
APPLICATIONS WITHDRAWN
0
$0
1
$82,890
6
$49,743
1
$30,730
1
$19,530
FILES CLOSED FOR INCOMPLETENESS
0
$0
0
$0
1
$129,580
0
$0
0
$0
Aggregated Statistics For Year 2000 (Based on 10 partial tracts)
A) FHA, FSA/RHS & VA Home Purchase Loans
B) Conventional Home Purchase Loans
C) Refinancings
D) Home Improvement Loans
F) Non-occupant Loans on < 5 Family Dwellings (A B C & D)
Number
Average Value
Number
Average Value
Number
Average Value
Number
Average Value
Number
Average Value
LOANS ORIGINATED
2
$52,285
19
$38,899
20
$45,662
6
$19,782
5
$41,696
APPLICATIONS APPROVED, NOT ACCEPTED
0
$0
3
$44,307
3
$72,253
1
$27,150
1
$20,250
APPLICATIONS DENIED
2
$42,160
19
$39,701
10
$51,070
6
$16,277
2
$14,770
APPLICATIONS WITHDRAWN
0
$0
1
$87,180
5
$58,550
1
$4,590
0
$0
FILES CLOSED FOR INCOMPLETENESS
0
$0
1
$35,970
1
$71,700
0
$0
0
$0
Aggregated Statistics For Year 1999 (Based on 5 partial tracts)
A) FHA, FSA/RHS & VA Home Purchase Loans
B) Conventional Home Purchase Loans
C) Refinancings
D) Home Improvement Loans
F) Non-occupant Loans on < 5 Family Dwellings (A B C & D)
Detailed PMIC statistics for the following Tracts:0302.01
, 0302.02
2004 - 2018 National Fire Incident Reporting System (NFIRS) incidents
According to the data from the years 2004 - 2018 the average number of fires per year is 27. The highest number of reported fire incidents - 88 took place in 2005, and the least - 4 in 2004. The data has an increasing trend.
When looking into fire subcategories, the most reports belonged to: Outside Fires (66.5%), and Structure Fires (25.8%).
Fire incident types reported to NFIRS in Zip Code 74435
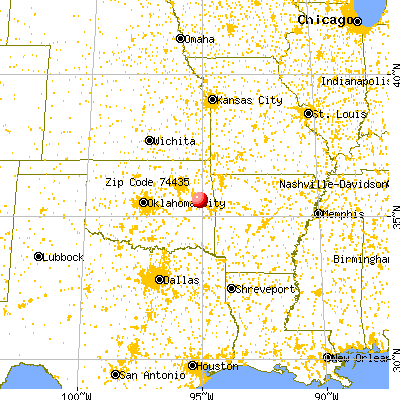


 Nearest zip codes: 74470, 74423, 74962, 74451, 74427, 74469.
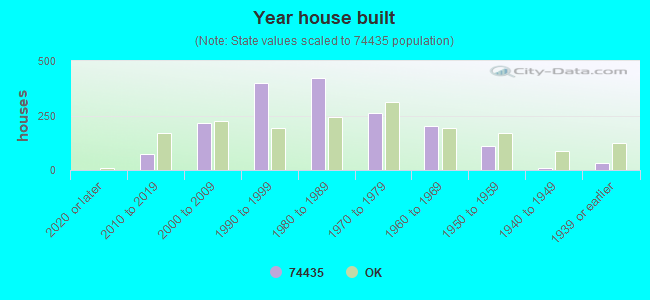


 According to the data from the years 2004 - 2018 the average number of fires per year is 27. The highest number of reported fire incidents - 88 took place in 2005, and the least - 4 in 2004. The data has an increasing trend.
 When looking into fire subcategories, the most reports belonged to: Outside Fires (66.5%), and Structure Fires (25.8%).