Estimated zip code population in 2022: 12,494 Zip code population in 2010: 12,301 Zip code population in 2000: 13,295
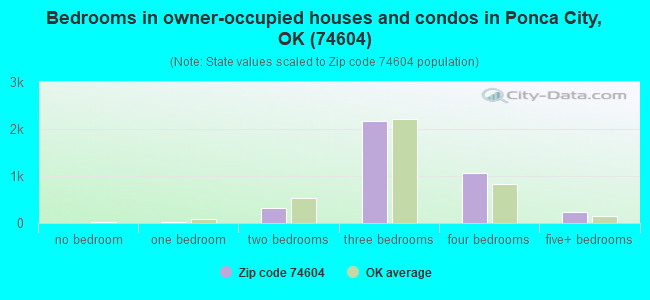
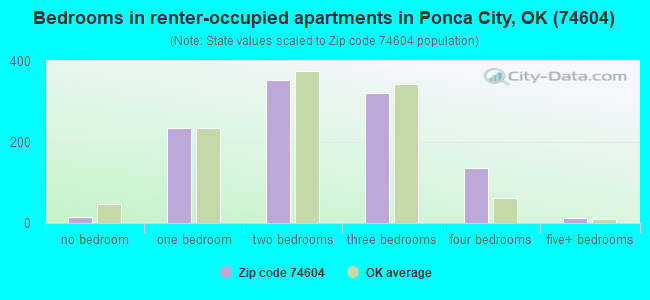
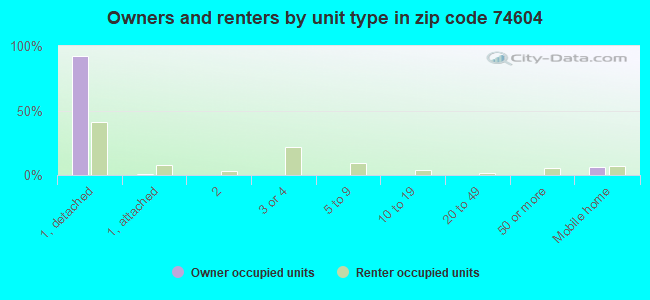
Houses and condos: 5,532 Renter-occupied apartments: 1,076
% of renters here:
22%
State:
35%
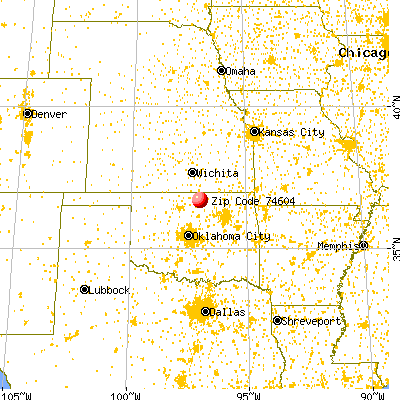
March 2022 cost of living index in zip code 74604: 78.7 (low, U.S. average is 100)
Land area: 134.5 sq. mi. Water area: 5.8 sq. mi.
Population density: 93 people per square mile
(very low).
OSM Map
General Map
Google Map
MSN Map
OSM Map
General Map
Google Map
MSN Map
OSM Map
General Map
Google Map
MSN Map
OSM Map
General Map
Google Map
MSN Map
Please wait while loading the map...
Real estate property taxes paid for housing units in 2022:
This zip code:
0.7% ($1,436)
Oklahoma:
0.8% ($1,501)
Median real estate property taxes paid for housing units with mortgages in 2022: $1,457 (0.7%) Median real estate property taxes paid for housing units with no mortgage in 2022: $1,384 (0.7%)
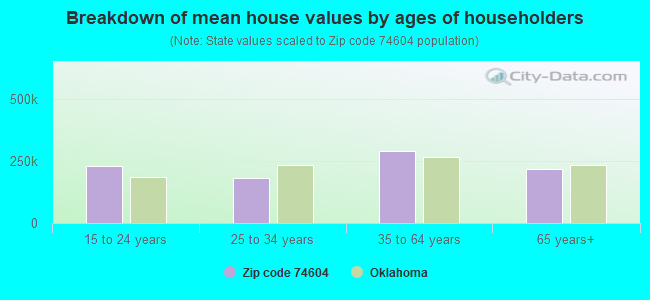
Estimated median house/condo value in 2022: $200,920
74604:
$200,920
Oklahoma:
$191,700
According to our research of Oklahoma and other state lists, there were 25 registered sex offenders living in 74604 zip code as of May 12, 2024. The ratio of all residents to sex offenders in zip code 74604 is 505 to 1. The ratio of registered sex offenders to all residents in this zip code is near the state average.
Median resident age:
This zip code:
45.2 years
Oklahoma median age:
37.1 years
Average household size:
This zip code:
2.5 people
Oklahoma:
2.5 people
Averages for the 2020 tax year for zip code 74604, filed in 2021:
Average Adjusted Gross Income (AGI) in 2020: $77,490 (Individual Income Tax Returns)
Here:
$77,490
State:
$63,060
Salary/wage: $60,824 (reported on 74.5% of returns)
Here:
$60,824
State:
$52,427
(% of AGI for various income ranges: 1101.6% for AGIs below $25k, 3207.4% for AGIs $25k-50k, 5498.8% for AGIs $50k-75k, 8568.1% for AGIs $75k-100k, 15545.4% for AGIs $100k-200k, 43372.5% for AGIs over 200k)
Taxable interest for individuals: $1,859 (reported on 38.6% of returns)
This zip code:
$1,859
Oklahoma:
$1,603
(% of AGI for various income ranges: 31.4% for AGIs below $25k, 40.2% for AGIs $25k-50k, 57.0% for AGIs $50k-75k, 58.6% for AGIs $75k-100k, 146.8% for AGIs $100k-200k, 1536.7% for AGIs over 200k)
Ordinary dividends: $6,675 (reported on 24.6% of returns)
Here:
$6,675
State:
$7,001
(% of AGI for various income ranges: 52.6% for AGIs below $25k, 58.0% for AGIs $25k-50k, 170.5% for AGIs $50k-75k, 176.0% for AGIs $75k-100k, 461.7% for AGIs $100k-200k, 3025.8% for AGIs over 200k)
Net capital gain/loss in AGI: +$15,360 (reported on 21.8% of returns)
Here:
+$15,360
State:
+$19,855
(% of AGI for various income ranges: 22.5% for AGIs below $25k, 34.1% for AGIs $25k-50k, 110.9% for AGIs $50k-75k, 120.0% for AGIs $75k-100k, 663.2% for AGIs $100k-200k, 11027.5% for AGIs over 200k)
Profit/loss from business: +$10,271 (reported on 16.3% of returns)
Here:
+$10,271
State:
+$9,904
(% of AGI for various income ranges: 101.6% for AGIs below $25k, 111.5% for AGIs $25k-50k, 218.2% for AGIs $50k-75k, 238.4% for AGIs $75k-100k, 455.9% for AGIs $100k-200k, 1825.8% for AGIs over 200k)
Taxable individual retirement arrangement distribution: $34,594 (reported on 17.9% of returns)
74604:
$34,594
Oklahoma:
$20,476
(% of AGI for various income ranges: 106.7% for AGIs below $25k, 257.2% for AGIs $25k-50k, 661.2% for AGIs $50k-75k, 970.2% for AGIs $75k-100k, 2490.8% for AGIs $100k-200k, 7119.2% for AGIs over 200k)
Total itemized deductions: $42,762 (reported on 8.0% of returns)
Here:
$42,762
State:
$39,736
(% of AGI for various income ranges: 68.0% for AGIs below $25k, 127.3% for AGIs $25k-50k, 239.1% for AGIs $50k-75k, 361.2% for AGIs $75k-100k, 908.6% for AGIs $100k-200k, 7434.2% for AGIs over 200k)
Charity contributions: $15,944 (reported on 6.0% of returns)
Here:
$15,944
State:
$17,288
(% of AGI for various income ranges: 25.6% for AGIs $25k-50k, 41.8% for AGIs $50k-75k, 88.1% for AGIs $75k-100k, 276.6% for AGIs $100k-200k, 2438.3% for AGIs over 200k)
Taxes paid: $6,716 (reported on 8.0% of returns)
74604:
$6,716
State:
$7,046
(% of AGI for various income ranges: 5.4% for AGIs below $25k, 14.0% for AGIs $25k-50k, 25.8% for AGIs $50k-75k, 47.2% for AGIs $75k-100k, 195.4% for AGIs $100k-200k, 1100.0% for AGIs over 200k)
Earned income credit: $2,245 (reported on 13.1% of returns)
Here:
$2,245
State:
$2,435
(% of AGI for various income ranges: 82.3% for AGIs below $25k, 69.3% for AGIs $25k-50k)
Percentage of individuals using paid preparers for their 2020 taxes: 93.3%
Here:
93%
State:
94%
(% for various income ranges: 94.0% for AGIs below $25k, 95.0% for AGIs $25k-50k, 92.5% for AGIs $50k-75k, 92.2% for AGIs $75k-100k, 92.2% for AGIs $100k-200k, 90.6% for AGIs over 200k)
Averages for the 2012 tax year for zip code 74604, filed in 2013:
Average Adjusted Gross Income (AGI) in 2012: $75,818 (Individual Income Tax Returns)
Here:
$75,818
State:
$58,581
Salary/wage: $55,698 (reported on 74.7% of returns)
Here:
$55,698
State:
$45,973
(% of AGI for various income ranges: 68.8% for AGIs below $25k, 67.2% for AGIs $25k-50k, 63.2% for AGIs $50k-75k, 65.3% for AGIs $75k-100k, 63.6% for AGIs $100k-200k, 32.9% for AGIs over 200k)
Taxable interest for individuals: $1,730 (reported on 48.9% of returns)
This zip code:
$1,730
Oklahoma:
$1,625
(% of AGI for various income ranges: 1.8% for AGIs below $25k, 1.4% for AGIs $25k-50k, 0.8% for AGIs $50k-75k, 1.1% for AGIs $75k-100k, 0.9% for AGIs $100k-200k, 1.3% for AGIs over 200k)
Ordinary dividends: $6,983 (reported on 28.4% of returns)
Here:
$6,983
State:
$6,374
(% of AGI for various income ranges: 2.4% for AGIs below $25k, 1.9% for AGIs $25k-50k, 2.0% for AGIs $50k-75k, 1.5% for AGIs $75k-100k, 1.8% for AGIs $100k-200k, 4.3% for AGIs over 200k)
Net capital gain/loss in AGI: +$14,629 (reported on 21.8% of returns)
Here:
+$14,629
State:
+$24,023
(% of AGI for various income ranges: 0.3% for AGIs $25k-50k, 0.5% for AGIs $50k-75k, 1.2% for AGIs $75k-100k, 2.2% for AGIs $100k-200k, 10.7% for AGIs over 200k)
Profit/loss from business: +$13,120 (reported on 17.2% of returns)
Here:
+$13,120
State:
+$11,913
(% of AGI for various income ranges: 5.4% for AGIs below $25k, 2.2% for AGIs $25k-50k, 2.8% for AGIs $50k-75k, 2.1% for AGIs $75k-100k, 2.4% for AGIs $100k-200k, 3.8% for AGIs over 200k)
Taxable individual retirement arrangement distribution: $25,446 (reported on 21.2% of returns)
74604:
$25,446
Oklahoma:
$15,242
(% of AGI for various income ranges: 8.1% for AGIs below $25k, 7.2% for AGIs $25k-50k, 7.4% for AGIs $50k-75k, 9.4% for AGIs $75k-100k, 8.2% for AGIs $100k-200k, 4.9% for AGIs over 200k)
Self-employment retirement plans: $21,700 (reported on 0.7% of returns)
74604:
$21,700
Oklahoma:
$20,266
Total itemized deductions: $25,432 (18% of AGI, reported on 34.9% of returns)
Here:
$25,432
State:
$24,882
Here:
18.1% of AGI
State:
18.8% of AGI
(% of AGI for various income ranges: 12.7% for AGIs below $25k, 11.1% for AGIs $25k-50k, 9.4% for AGIs $50k-75k, 10.3% for AGIs $75k-100k, 13.4% for AGIs $100k-200k, 11.7% for AGIs over 200k)
Charity contributions: $7,419 (reported on 28.8% of returns)
Here:
$7,419
State:
$6,591
(% of AGI for various income ranges: 1.4% for AGIs below $25k, 1.8% for AGIs $25k-50k, 1.9% for AGIs $50k-75k, 2.3% for AGIs $75k-100k, 3.3% for AGIs $100k-200k, 3.5% for AGIs over 200k)
Taxes paid: $7,148 (reported on 34.7% of returns)
74604:
$7,148
State:
$7,196
(% of AGI for various income ranges: 1.6% for AGIs below $25k, 1.7% for AGIs $25k-50k, 1.9% for AGIs $50k-75k, 2.5% for AGIs $75k-100k, 4.1% for AGIs $100k-200k, 4.1% for AGIs over 200k)
Earned income credit: $2,181 (reported on 12.5% of returns)
Here:
$2,181
State:
$2,354
(% of AGI for various income ranges: 5.1% for AGIs below $25k, 1.1% for AGIs $25k-50k)
Percentage of individuals using paid preparers for their 2012 taxes: 57.2%
Here:
57%
State:
56%
(% for various income ranges: 49.4% for AGIs below $25k, 55.0% for AGIs $25k-50k, 61.7% for AGIs $50k-75k, 60.9% for AGIs $75k-100k, 62.5% for AGIs $100k-200k, 76.9% for AGIs over 200k)
Averages for the 2004 tax year for zip code 74604, filed in 2005:
Average Adjusted Gross Income (AGI) in 2004: $54,305 (Individual Income Tax Returns)
Here:
$54,305
State:
$41,245
Salary/wage: $47,839 (reported on 75.6% of returns)
Here:
$47,839
State:
$35,318
(% of AGI for various income ranges: 144.0% for AGIs below $10k, 63.2% for AGIs $10k-25k, 67.3% for AGIs $25k-50k, 69.9% for AGIs $50k-75k, 72.5% for AGIs $75k-100k, 61.7% for AGIs over 100k)
Taxable interest for individuals: $1,858 (reported on 59.6% of returns)
This zip code:
$1,858
Oklahoma:
$1,745
(% of AGI for various income ranges: 12.0% for AGIs below $10k, 5.4% for AGIs $10k-25k, 3.1% for AGIs $25k-50k, 2.4% for AGIs $50k-75k, 1.0% for AGIs $75k-100k, 1.3% for AGIs over 100k)
Taxable dividends: $3,402 (reported on 34.6% of returns)
Here:
$3,402
State:
$2,920
(% of AGI for various income ranges: 8.5% for AGIs below $10k, 2.5% for AGIs $10k-25k, 2.0% for AGIs $25k-50k, 1.4% for AGIs $50k-75k, 1.4% for AGIs $75k-100k, 2.6% for AGIs over 100k)
Net capital gain/loss: +$4,471 (reported on 30.9% of returns)
Here:
+$4,471
State:
+$10,653
(% of AGI for various income ranges: -1.0% for AGIs below $10k, 0.4% for AGIs $10k-25k, 0.9% for AGIs $25k-50k, 1.0% for AGIs $50k-75k, 0.5% for AGIs $75k-100k, 4.7% for AGIs over 100k)
Profit/loss from business: +$9,553 (reported on 17.8% of returns)
Here:
+$9,553
State:
+$8,532
(% of AGI for various income ranges: -3.8% for AGIs below $10k, 5.0% for AGIs $10k-25k, 2.9% for AGIs $25k-50k, 2.2% for AGIs $50k-75k, 2.5% for AGIs $75k-100k, 3.7% for AGIs over 100k)
IRA payment deduction: $3,254 (reported on 2.6% of returns)
74604:
$3,254
Oklahoma:
$3,127
(% of AGI for various income ranges: 0.2% for AGIs $10k-25k, 0.3% for AGIs $25k-50k, 0.2% for AGIs $50k-75k, 0.1% for AGIs $75k-100k, 0.1% for AGIs over 100k)
Self-employed pension: $13,283 (reported on 1.0% of returns)
Here:
$13,283
Oklahoma:
$14,276
Total itemized deductions: $17,888 (20% of AGI, reported on 45.1% of returns)
Here:
$17,888
State:
$17,093
Here:
20.2% of AGI
State:
20.5% of AGI
(% of AGI for various income ranges: 31.6% for AGIs below $10k, 18.2% for AGIs $10k-25k, 15.9% for AGIs $25k-50k, 14.1% for AGIs $50k-75k, 15.1% for AGIs $75k-100k, 13.9% for AGIs over 100k)
Charity contributions deductions: $4,621 (5% of AGI, reported on 40.2% of returns)
Here:
$4,621
State:
$4,240
Here:
5.0% of AGI
State:
4.8% of AGI
(% of AGI for various income ranges: 2.3% for AGIs below $10k, 2.2% for AGIs $10k-25k, 2.9% for AGIs $25k-50k, 2.8% for AGIs $50k-75k, 3.3% for AGIs $75k-100k, 4.1% for AGIs over 100k)
Total tax: $8,731 (reported on 77.3% of returns)
74604:
$8,731
State:
$6,542
(% of AGI for various income ranges: 5.3% for AGIs below $10k, 3.5% for AGIs $10k-25k, 6.4% for AGIs $25k-50k, 8.7% for AGIs $50k-75k, 10.7% for AGIs $75k-100k, 17.7% for AGIs over 100k)
Earned income credit: $1,669 (reported on 9.7% of returns)
Here:
$1,669
State:
$1,830
Percentage of individuals using paid preparers for their 2004 taxes: 61.6%
Here:
62%
State:
63%
(% for various income ranges: 51.6% for AGIs below $10k, 67.8% for AGIs $10k-25k, 68.7% for AGIs $25k-50k, 64.1% for AGIs $50k-75k, 60.2% for AGIs $75k-100k, 56.5% for AGIs over 100k)
Likely homosexual households (counted as self-reported same-sex unmarried-partner households)
Lesbian couples: 0.1% of all households
Gay men: 0.0% of all households
Household received Food Stamps/SNAP in the past 12 months: 369 Household did not receive Food Stamps/SNAP in the past 12 months: 4,473
Women who had a birth in the past 12 months: 127 (95 now married, 32 unmarried) Women who did not have a birth in the past 12 months: 2,396 (1,032 now married, 1,363 unmarried)
Housing units in zip code 74604 with a mortgage: 1,864 (150 second mortgage, 125 both second mortgage and home equity loan) Houses without a mortgage: 116
Median monthly owner costs for units with a mortgage: $1,354 Median monthly owner costs for units without a mortgage: $594
Residents with income below the poverty level in 2022:
This zip code:
12.7%
Whole state:
15.7%
Residents with income below 50% of the poverty level in 2022:
This zip code:
6.2%
Whole state:
8.3%
Median number of rooms in houses and condos:
Here:
6.8
State:
6.1
Median number of rooms in apartments:
Here:
4.1
State:
4.5
Notable locations in this zip code not listed on our city pages
Notable locations in zip code 74604: Ponca Plaza (A), Wentz Camp (B), Camp McFadden (C), Kildare Volunteer Fire Department (D), McCord Community Volunteer Fire Department (E), Osage Cove Fire District (F), Ponca City Fire Department Station 4 (G), Ernest Whitworth Marland Mansion (H). Display/hide their locations on the map
Churches in zip code 74604 include: Longwood Church (A), Woodlands Christian Church (B), Saint Marys Catholic Church (C), Saint Lukes Church-Nazarene (D), Prince of Peace Church (E), Northeast Baptist Church (F), First United Pentecostal Church (G), First Free Will Baptist Church (H). Display/hide their locations on the map
Reservoirs: East Lake Ponca (A), Schrickram Reservoir (B), Lake Ponca (C), West Lake Ponca (D), Oknoname 071020 Reservoir (E), Oknoname 071027 Reservoir (F), Oknoname 071026 Reservoir (G), Oknoname 071021 Reservoir (H). Display/hide their locations on the map
Creeks: Coon Creek (A), Charley Creek (B), Simpkins Creek (C), Prettyhair Creek (D), Little Drum Creek (E), Fishhook Creek (F). Display/hide their locations on the map
Parks in zip code 74604 include: Pioneer Woman Monument (1), Sherwood Park (2), Redbud Park (3), Frazier Park (4), Lake Ponca Park (5). Display/hide their locations on the map
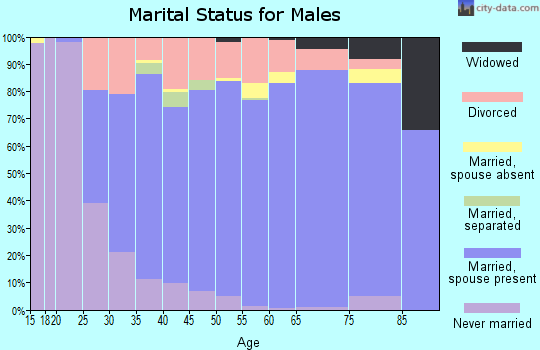
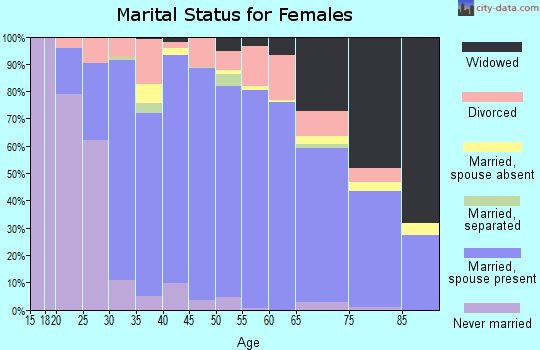
1,713 married couples with children.
507 single-parent households (170 men, 337 women).
96.7% of residents of 74604 zip code speak English at home.
2.2% of residents speak Spanish at home (86% very well, 7% well, 7% not well).
0.7% of residents speak other Indo-European language at home (70% very well, 20% well, 11% not well).
0.3% of residents speak Asian or Pacific Island language at home (100% very well).
0.2% of residents speak other language at home (31% very well, 38% well, 31% not well).
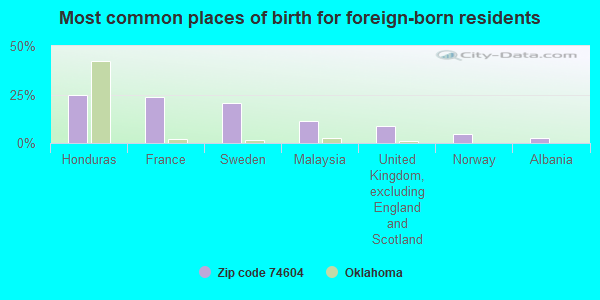
Foreign born population: 280 (2.2%) (79.5% of them are naturalized citizens)
Facilities with environmental interests located in this zip code:
E. M. TROUT ES (2109 E. PROSPECT in PONCA CITY, OK)
(National Center for Education Statistics) - STATE ID-36-I071-137 Organizations: PONCA CITY (SCHOOL DISTRICT)
MCCORD ES (4001 SHERWIN AVE. in PONCA CITY, OK)
(National Center for Education Statistics) - STATE ID-57-C077-105 Organizations: MC CORD (SCHOOL DISTRICT)
MCCORD PUBLIC SCH DISTRICT (4001 SHERWIN AVE in PONCA CITY, OK)
(Integrated Compliance Information System) - ICIS-06-2000-1134, FORMAL ENFORCEMENT ACTION Business SIC classification: ELEMENTARY AND SECONDARY SCHOOLS
G & M COLLISION (521 MONUMENT RD in PONCA CITY, OK)
Small Quantity Generators, between 100 kg and 1000 kg of hazardous waste/month (Resource Conservation and Recovery Act (tracking hazardous waste)) - notification Organizations: STEVE WOOLERY (CONTACT/OWNER)
Housing units lacking complete plumbing facilities: 3.7% Housing units lacking complete kitchen facilities: 4.3%
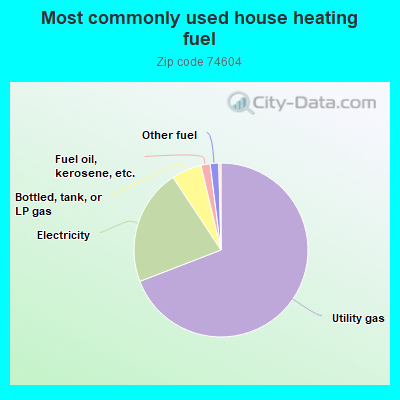
69.2%Utility gas
21.6%Electricity
5.6%Bottled, tank, or LP gas
1.7%Fuel oil, kerosene, etc.
1.6%Other fuel
Population in 1990: 9,327. Population change in the 1990s: +3,968 (+42.5%).
Place of birth for U.S.-born residents:
This state: 7,995
Northeast: 107
Midwest: 1,988
South: 1,214
West: 796
60% of the 74604 zip code residents lived in the same house 5 years ago. Out of people who lived in different houses, 48% lived in this county. Out of people who lived in different counties, 50% lived in Oklahoma.
89% of the 74604 zip code residents lived in the same house 1 year ago. Out of people who lived in different houses, 48% moved from this county. Out of people who lived in different houses, 34% moved from different county within same state. Out of people who lived in different houses, 18% moved from different state.
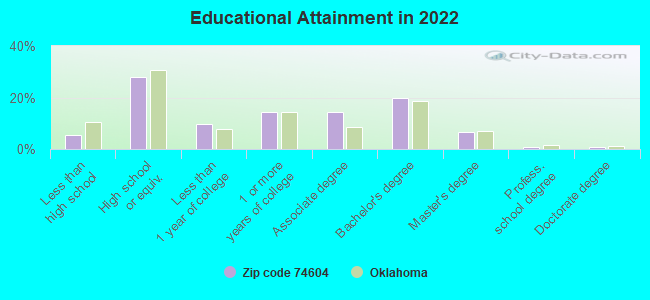
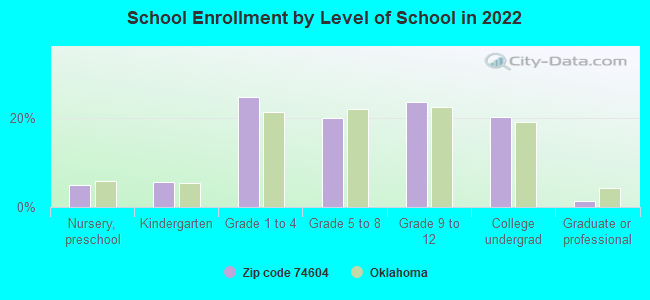
Private vs. public school enrollment:
Students in private schools in grades 1 to 8 (elementary and middle school): 383
Here:
29.2%
Oklahoma:
11.7%
Students in private schools in grades 9 to 12 (high school): 35
Here:
5.3%
Oklahoma:
11.7%
Students in private undergraduate colleges: 124
Here:
21.1%
Oklahoma:
19.3%
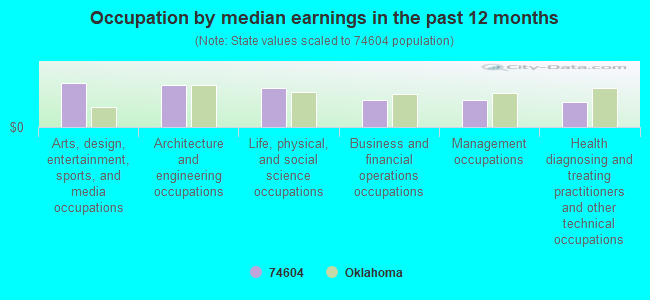
Occupation by median earnings in the past 12 months ($)
107,794Arts, design, entertainment, sports, and media occupations
103,199Architecture and engineering occupations
96,722Life, physical, and social science occupations
65,251Business and financial operations occupations
65,214Management occupations
61,083Health diagnosing and treating practitioners and other technical occupations
Companies with federal contracts located in this zip code:
SARGE CREEK GATE ATTENDANTS, I (2000 WILDWOOD AVE in PONCA CITY, OK; small business) : $23,000 in 7 contractsfrom 2004 to 2006
Contracts for Operation of Government-Owned Facilities -- Recreation Facilities (Non-Building), Other Administrative Support Services by Army, U.S. Army Corps of Engineers - civil program financing only Signed by year:2000: $0; 2001: $0; 2002: $0; 2003: $0; 2004: $9,000; 2005: $9,000; 2006: $5,000.
Biggest contracts:
$5,000 with Army for Operation of Government-Owned Facilities -- Recreation Facilities (Non-Building). Signed on 2006-03-22. Completion date: 2006-02-07.
$4,500 with Army for Other Administrative Support Services. Signed on 2005-04-05. Completion date: 2004-03-02.
$4,500 with U.S. Army Corps of Engineers - civil program financing only for Other Administrative Support Services. Signed on 2005-04-05. Completion date: 2004-03-02.
$4,500 with Army for Other Administrative Support Services. Signed on 2004-03-15. Completion date: 2004-03-02.
GILLOCK, CLAYTON (109 LEE in PONCA CITY, OK; small business) : $19,000 in 4 contractsfrom 2004 to 2005
$4,750 with Army for Other Administrative Support Services. Signed on 2005-04-05. Completion date: 2004-03-10.
$4,750 with U.S. Army Corps of Engineers - civil program financing only for Other Administrative Support Services. Signed on 2005-04-05. Completion date: 2004-03-10.
$4,750 with Army for Other Administrative Support Services. Signed on 2004-03-18. Completion date: 2004-03-10.
$4,750 with U.S. Army Corps of Engineers - civil program financing only for Other Administrative Support Services. Signed on 2004-03-18. Completion date: 2004-03-10.
SOBER BROTHERS, INC (3508 LAKE RD in PONCA CITY, OK; small business) : $15,500 in 3 contractsfrom 2003 to 2005
$6,490 with Army for Mineral Construction Materials, Bulk. Signed on 2005-04-01. Completion date: 2005-05-01.
$6,490 with U.S. Army Corps of Engineers - civil program financing only for Mineral Construction Materials, Bulk. Signed on 2005-04-01. Completion date: 2005-05-01.
$2,520 with U.S. Army Corps of Engineers - civil program financing only for Construction of Structures and Facilities -- Recreation Facilities (Non-Building). Signed on 2003-06-11. Completion date: 2003-06-25.
Top industries in this zip code by the number of employees in 2005:
Health Care and Social Assistance: Homes for the Elderly (100-249 employees: 1 establishment, 10-19 employees: 2 establishments)
Other Services (except Public Administration): Religious Organizations (20-49: 2, 10-19: 1, 5-9: 3, 1-4: 5)
Arts, Entertainment, and Recreation: Golf Courses and Country Clubs (50-99: 1, 10-19: 1)
Health Care and Social Assistance: Other Residential Care Facilities (50-99: 1)
Health Care and Social Assistance: Nursing Care Facilities (50-99: 1)
Professional, Scientific, and Technical Services: Computer Systems Design Services (20-49: 1, 1-4: 1)
Health Care and Social Assistance: Offices of Physicians (except Mental Health Specialists) (20-49: 1)
Educational Services: Elementary and Secondary Schools (20-49: 1)
Mining: Construction Sand and Gravel Mining (20-49: 1)
People in group quarters in 2010:
161 people in nursing facilities/skilled-nursing facilities
60 people in group homes for juveniles (non-correctional)
22 people in workers' group living quarters and job corps centers
6 people in group homes intended for adults
People in group quarters in 2000:
218 people in nursing homes
59 people in homes for abused, dependent, and neglected children
38 people in other noninstitutional group quarters
33 people in other group homes
6 people in unknown juvenile institutions
Fatal accident statistics in 2014:
Fatal accident count: 1
Vehicles involved in fatal accidents: 1
Fatal accidents caused by drunken drivers: 0
Fatalities: 1
Persons involved in fatal accidents: 1
Pedestrians involved in fatal accidents: 0
Fatal accident statistics in 2013:
Fatal accident count: 2
Vehicles involved in fatal accidents: 4
Fatal accidents caused by drunken drivers: 1
Fatalities: 2
Persons involved in fatal accidents: 4
Pedestrians involved in fatal accidents: 0
Home Mortgage Disclosure Act Aggregated Statistics For Year 2009 (Based on 2 partial tracts)
A) FHA, FSA/RHS & VA Home Purchase Loans
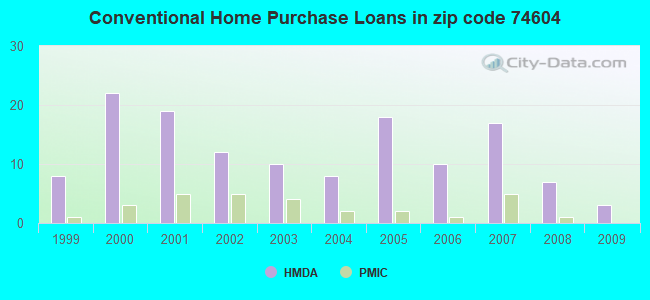
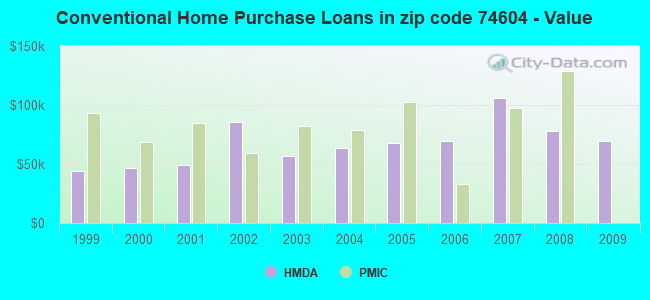
B) Conventional Home Purchase Loans
C) Refinancings
D) Home Improvement Loans
F) Non-occupant Loans on < 5 Family Dwellings (A B C & D)
G) Loans On Manufactured Home Dwelling (A B C & D)
Number
Average Value
Number
Average Value
Number
Average Value
Number
Average Value
Number
Average Value
Number
Average Value
LOANS ORIGINATED
5
$91,350
3
$69,183
16
$81,895
2
$46,590
2
$24,480
2
$52,620
APPLICATIONS APPROVED, NOT ACCEPTED
0
$0
0
$0
1
$57,730
0
$0
0
$0
0
$0
APPLICATIONS DENIED
1
$74,540
1
$44,210
7
$88,270
2
$22,470
0
$0
1
$98,660
APPLICATIONS WITHDRAWN
1
$72,710
1
$52,980
3
$57,367
0
$0
0
$0
1
$33,620
FILES CLOSED FOR INCOMPLETENESS
0
$0
0
$0
0
$0
0
$0
0
$0
0
$0
Aggregated Statistics For Year 2008 (Based on 2 partial tracts)
A) FHA, FSA/RHS & VA Home Purchase Loans
B) Conventional Home Purchase Loans
C) Refinancings
D) Home Improvement Loans
F) Non-occupant Loans on < 5 Family Dwellings (A B C & D)
G) Loans On Manufactured Home Dwelling (A B C & D)
Number
Average Value
Number
Average Value
Number
Average Value
Number
Average Value
Number
Average Value
Number
Average Value
LOANS ORIGINATED
3
$83,433
7
$77,674
12
$87,605
4
$48,690
1
$50,060
2
$38,000
APPLICATIONS APPROVED, NOT ACCEPTED
0
$0
1
$154,560
3
$97,927
1
$43,850
0
$0
1
$46,770
APPLICATIONS DENIED
1
$153,470
2
$64,495
12
$92,507
2
$44,030
1
$81,480
1
$113,640
APPLICATIONS WITHDRAWN
0
$0
0
$0
2
$99,570
1
$146,160
0
$0
0
$0
FILES CLOSED FOR INCOMPLETENESS
0
$0
0
$0
0
$0
0
$0
0
$0
0
$0
Aggregated Statistics For Year 2007 (Based on 2 partial tracts)
A) FHA, FSA/RHS & VA Home Purchase Loans
B) Conventional Home Purchase Loans
C) Refinancings
D) Home Improvement Loans
F) Non-occupant Loans on < 5 Family Dwellings (A B C & D)
G) Loans On Manufactured Home Dwelling (A B C & D)
Number
Average Value
Number
Average Value
Number
Average Value
Number
Average Value
Number
Average Value
Number
Average Value
LOANS ORIGINATED
3
$85,017
17
$106,009
10
$78,378
7
$35,391
3
$47,380
5
$72,350
APPLICATIONS APPROVED, NOT ACCEPTED
0
$0
1
$40,560
1
$30,330
2
$23,385
0
$0
0
$0
APPLICATIONS DENIED
0
$0
6
$69,060
8
$77,054
5
$41,510
0
$0
3
$63,580
APPLICATIONS WITHDRAWN
0
$0
1
$35,080
4
$98,292
1
$93,180
0
$0
1
$73,810
FILES CLOSED FOR INCOMPLETENESS
0
$0
0
$0
1
$112,180
0
$0
0
$0
0
$0
Aggregated Statistics For Year 2006 (Based on 2 partial tracts)
A) FHA, FSA/RHS & VA Home Purchase Loans
B) Conventional Home Purchase Loans
C) Refinancings
D) Home Improvement Loans
F) Non-occupant Loans on < 5 Family Dwellings (A B C & D)
G) Loans On Manufactured Home Dwelling (A B C & D)
Number
Average Value
Number
Average Value
Number
Average Value
Number
Average Value
Number
Average Value
Number
Average Value
LOANS ORIGINATED
3
$79,900
10
$69,280
11
$74,176
4
$28,685
2
$23,020
1
$72,350
APPLICATIONS APPROVED, NOT ACCEPTED
0
$0
1
$80,750
1
$90,620
1
$17,170
0
$0
2
$52,070
APPLICATIONS DENIED
1
$51,520
6
$58,282
14
$78,039
7
$41,394
0
$0
5
$82,508
APPLICATIONS WITHDRAWN
0
$0
1
$96,830
6
$80,937
1
$51,160
1
$25,580
0
$0
FILES CLOSED FOR INCOMPLETENESS
0
$0
0
$0
2
$77,465
0
$0
0
$0
0
$0
Aggregated Statistics For Year 2005 (Based on 2 partial tracts)
A) FHA, FSA/RHS & VA Home Purchase Loans
B) Conventional Home Purchase Loans
C) Refinancings
D) Home Improvement Loans
F) Non-occupant Loans on < 5 Family Dwellings (A B C & D)
G) Loans On Manufactured Home Dwelling (A B C & D)
Number
Average Value
Number
Average Value
Number
Average Value
Number
Average Value
Number
Average Value
Number
Average Value
LOANS ORIGINATED
1
$71,620
18
$68,026
13
$74,514
4
$15,620
5
$21,412
4
$51,612
APPLICATIONS APPROVED, NOT ACCEPTED
0
$0
3
$61,510
1
$80,390
0
$0
0
$0
3
$49,087
APPLICATIONS DENIED
0
$0
10
$53,166
15
$67,477
2
$22,105
0
$0
4
$53,075
APPLICATIONS WITHDRAWN
0
$0
3
$72,470
8
$95,598
1
$267,840
0
$0
0
$0
FILES CLOSED FOR INCOMPLETENESS
0
$0
0
$0
1
$172,830
0
$0
0
$0
0
$0
Aggregated Statistics For Year 2004 (Based on 2 partial tracts)
A) FHA, FSA/RHS & VA Home Purchase Loans
B) Conventional Home Purchase Loans
C) Refinancings
D) Home Improvement Loans
F) Non-occupant Loans on < 5 Family Dwellings (A B C & D)
G) Loans On Manufactured Home Dwelling (A B C & D)
Number
Average Value
Number
Average Value
Number
Average Value
Number
Average Value
Number
Average Value
Number
Average Value
LOANS ORIGINATED
1
$50,430
8
$63,899
19
$62,906
4
$64,585
4
$23,568
2
$56,455
APPLICATIONS APPROVED, NOT ACCEPTED
0
$0
5
$60,438
4
$68,420
0
$0
0
$0
3
$60,657
APPLICATIONS DENIED
0
$0
4
$78,560
14
$65,015
1
$17,540
1
$52,250
3
$48,720
APPLICATIONS WITHDRAWN
0
$0
1
$49,690
8
$65,726
1
$40,190
1
$38,730
0
$0
FILES CLOSED FOR INCOMPLETENESS
0
$0
0
$0
1
$46,040
0
$0
0
$0
0
$0
Aggregated Statistics For Year 2003 (Based on 2 partial tracts)
A) FHA, FSA/RHS & VA Home Purchase Loans
B) Conventional Home Purchase Loans
C) Refinancings
D) Home Improvement Loans
F) Non-occupant Loans on < 5 Family Dwellings (A B C & D)
Number
Average Value
Number
Average Value
Number
Average Value
Number
Average Value
Number
Average Value
LOANS ORIGINATED
2
$99,755
10
$56,893
26
$91,477
6
$21,132
2
$12,605
APPLICATIONS APPROVED, NOT ACCEPTED
0
$0
1
$24,480
7
$86,234
0
$0
0
$0
APPLICATIONS DENIED
0
$0
4
$32,430
22
$67,101
4
$18,452
2
$33,800
APPLICATIONS WITHDRAWN
1
$140,310
3
$40,560
9
$65,244
1
$25,210
0
$0
FILES CLOSED FOR INCOMPLETENESS
0
$0
0
$0
3
$62,727
0
$0
0
$0
Aggregated Statistics For Year 2002 (Based on 2 partial tracts)
A) FHA, FSA/RHS & VA Home Purchase Loans
B) Conventional Home Purchase Loans
C) Refinancings
D) Home Improvement Loans
F) Non-occupant Loans on < 5 Family Dwellings (A B C & D)
Number
Average Value
Number
Average Value
Number
Average Value
Number
Average Value
Number
Average Value
LOANS ORIGINATED
2
$70,520
12
$85,291
19
$74,426
3
$12,790
3
$23,143
APPLICATIONS APPROVED, NOT ACCEPTED
0
$0
1
$71,250
3
$137,390
0
$0
0
$0
APPLICATIONS DENIED
0
$0
5
$38,952
10
$65,407
4
$29,690
0
$0
APPLICATIONS WITHDRAWN
0
$0
1
$42,750
9
$60,250
0
$0
0
$0
FILES CLOSED FOR INCOMPLETENESS
0
$0
0
$0
1
$106,700
0
$0
0
$0
Aggregated Statistics For Year 2001 (Based on 2 partial tracts)
A) FHA, FSA/RHS & VA Home Purchase Loans
B) Conventional Home Purchase Loans
C) Refinancings
D) Home Improvement Loans
F) Non-occupant Loans on < 5 Family Dwellings (A B C & D)
Number
Average Value
Number
Average Value
Number
Average Value
Number
Average Value
Number
Average Value
LOANS ORIGINATED
2
$57,000
19
$49,483
18
$66,300
2
$13,705
2
$12,790
APPLICATIONS APPROVED, NOT ACCEPTED
0
$0
4
$36,082
0
$0
0
$0
0
$0
APPLICATIONS DENIED
0
$0
4
$40,925
7
$54,236
2
$12,240
0
$0
APPLICATIONS WITHDRAWN
0
$0
0
$0
7
$65,407
1
$36,910
0
$0
FILES CLOSED FOR INCOMPLETENESS
0
$0
0
$0
2
$33,980
1
$15,710
0
$0
Aggregated Statistics For Year 2000 (Based on 2 partial tracts)
A) FHA, FSA/RHS & VA Home Purchase Loans
B) Conventional Home Purchase Loans
C) Refinancings
D) Home Improvement Loans
F) Non-occupant Loans on < 5 Family Dwellings (A B C & D)
Number
Average Value
Number
Average Value
Number
Average Value
Number
Average Value
Number
Average Value
LOANS ORIGINATED
1
$51,520
22
$46,439
12
$44,000
3
$13,887
3
$10,353
APPLICATIONS APPROVED, NOT ACCEPTED
0
$0
4
$45,128
2
$53,165
1
$10,960
0
$0
APPLICATIONS DENIED
0
$0
6
$39,768
6
$36,357
3
$14,130
1
$29,600
APPLICATIONS WITHDRAWN
0
$0
0
$0
4
$59,378
1
$34,710
0
$0
FILES CLOSED FOR INCOMPLETENESS
0
$0
0
$0
1
$49,690
0
$0
0
$0
Aggregated Statistics For Year 1999 (Based on 1 partial tract)
A) FHA, FSA/RHS & VA Home Purchase Loans
B) Conventional Home Purchase Loans
C) Refinancings
D) Home Improvement Loans
F) Non-occupant Loans on < 5 Family Dwellings (A B C & D)
Detailed PMIC statistics for the following Tracts:0105.00
2003 - 2018 National Fire Incident Reporting System (NFIRS) incidents
Based on the data from the years 2003 - 2018 the average number of fires per year is 31. The highest number of reported fires - 87 took place in 2008, and the least - 0 in 2004. The data has a decreasing trend.
When looking into fire subcategories, the most reports belonged to: Outside Fires (60.0%), and Other (18.1%).
Fire incident types reported to NFIRS in Zip Code 74604


 Nearest zip codes: 74641, 74601, 74644, 74633, 74647, 74651.


 Based on the data from the years 2003 - 2018 the average number of fires per year is 31. The highest number of reported fires - 87 took place in 2008, and the least - 0 in 2004. The data has a decreasing trend.
 When looking into fire subcategories, the most reports belonged to: Outside Fires (60.0%), and Other (18.1%).