Estimated zip code population in 2022: 20,844 Zip code population in 2010: 15,920 Zip code population in 2000: 14,053
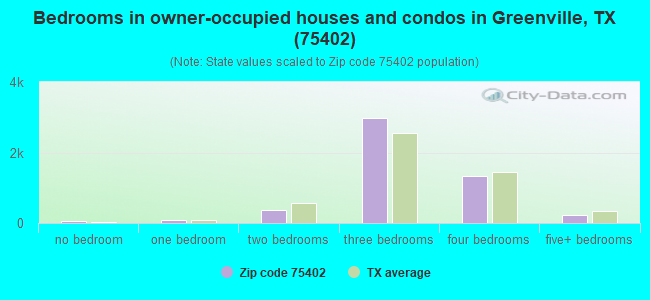
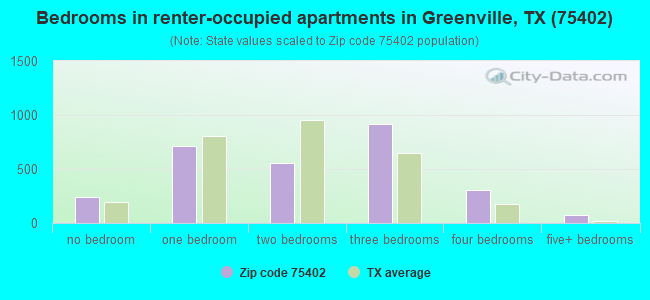
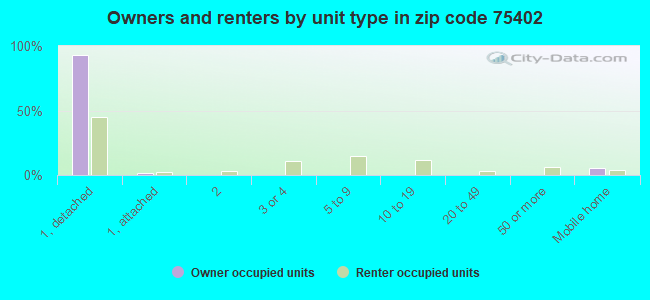
Houses and condos: 8,509 Renter-occupied apartments: 2,780
% of renters here:
36%
State:
38%
March 2022 cost of living index in zip code 75402: 94.2 (less than average, U.S. average is 100)
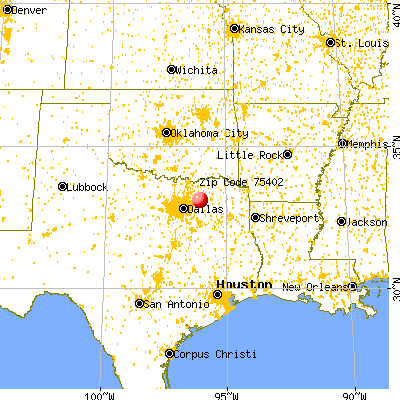
Land area: 90.3 sq. mi. Water area: 1.2 sq. mi.
Population density: 231 people per square mile
(very low).
OSM Map
General Map
Google Map
MSN Map
OSM Map
General Map
Google Map
MSN Map
OSM Map
General Map
Google Map
MSN Map
OSM Map
General Map
Google Map
MSN Map
Please wait while loading the map...
Real estate property taxes paid for housing units in 2022:
This zip code:
1.5% ($3,812)
Texas:
1.5% ($4,050)
Median real estate property taxes paid for housing units with mortgages in 2022: $4,760 (1.7%) Median real estate property taxes paid for housing units with no mortgage in 2022: $2,802 (1.3%)
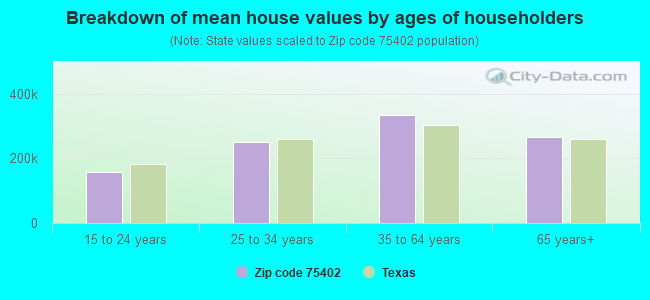
Estimated median house/condo value in 2022: $254,456
75402:
$254,456
Texas:
$275,400
According to our research of Texas and other state lists, there were 33 registered sex offenders living in 75402 zip code as of April 27, 2024. The ratio of all residents to sex offenders in zip code 75402 is 501 to 1. The ratio of registered sex offenders to all residents in this zip code is near the state average.
Median resident age:
This zip code:
36.1 years
Texas median age:
35.6 years
Average household size:
This zip code:
2.6 people
Texas:
2.6 people
Averages for the 2020 tax year for zip code 75402, filed in 2021:
Average Adjusted Gross Income (AGI) in 2020: $65,817 (Individual Income Tax Returns)
Here:
$65,817
State:
$77,054
Salary/wage: $57,749 (reported on 80.2% of returns)
Here:
$57,749
State:
$62,766
(% of AGI for various income ranges: 1190.8% for AGIs below $25k, 3502.8% for AGIs $25k-50k, 6557.6% for AGIs $50k-75k, 8987.5% for AGIs $75k-100k, 15829.0% for AGIs $100k-200k, 49978.2% for AGIs over 200k)
Taxable interest for individuals: $1,284 (reported on 27.0% of returns)
This zip code:
$1,284
Texas:
$2,665
(% of AGI for various income ranges: 21.0% for AGIs below $25k, 17.1% for AGIs $25k-50k, 25.4% for AGIs $50k-75k, 47.1% for AGIs $75k-100k, 110.4% for AGIs $100k-200k, 716.4% for AGIs over 200k)
Ordinary dividends: $4,799 (reported on 16.0% of returns)
Here:
$4,799
State:
$10,044
(% of AGI for various income ranges: 19.5% for AGIs below $25k, 29.6% for AGIs $25k-50k, 64.6% for AGIs $50k-75k, 117.9% for AGIs $75k-100k, 237.7% for AGIs $100k-200k, 2063.6% for AGIs over 200k)
Net capital gain/loss in AGI: +$12,808 (reported on 15.5% of returns)
Here:
+$12,808
State:
+$39,590
(% of AGI for various income ranges: 9.6% for AGIs below $25k, 11.9% for AGIs $25k-50k, 65.3% for AGIs $50k-75k, 116.2% for AGIs $75k-100k, 407.1% for AGIs $100k-200k, 10930.0% for AGIs over 200k)
Profit/loss from business: +$11,979 (reported on 16.9% of returns)
Here:
+$11,979
State:
+$10,888
(% of AGI for various income ranges: 124.2% for AGIs below $25k, 152.9% for AGIs $25k-50k, 194.7% for AGIs $50k-75k, 243.3% for AGIs $75k-100k, 471.1% for AGIs $100k-200k, 4542.7% for AGIs over 200k)
Taxable individual retirement arrangement distribution: $20,760 (reported on 10.1% of returns)
75402:
$20,760
Texas:
$24,740
(% of AGI for various income ranges: 58.2% for AGIs below $25k, 104.2% for AGIs $25k-50k, 199.0% for AGIs $50k-75k, 322.9% for AGIs $75k-100k, 787.0% for AGIs $100k-200k, 3850.0% for AGIs over 200k)
Total itemized deductions: $33,372 (reported on 6.6% of returns)
Here:
$33,372
State:
$40,428
(% of AGI for various income ranges: 24.7% for AGIs below $25k, 101.0% for AGIs $25k-50k, 224.7% for AGIs $50k-75k, 268.9% for AGIs $75k-100k, 807.0% for AGIs $100k-200k, 5239.1% for AGIs over 200k)
Charity contributions: $13,812 (reported on 5.5% of returns)
Here:
$13,812
State:
$18,201
(% of AGI for various income ranges: 25.5% for AGIs $25k-50k, 50.6% for AGIs $50k-75k, 66.2% for AGIs $75k-100k, 294.0% for AGIs $100k-200k, 2464.5% for AGIs over 200k)
Taxes paid: $6,467 (reported on 6.6% of returns)
75402:
$6,467
State:
$7,821
(% of AGI for various income ranges: 3.2% for AGIs below $25k, 15.4% for AGIs $25k-50k, 49.0% for AGIs $50k-75k, 58.8% for AGIs $75k-100k, 179.4% for AGIs $100k-200k, 828.2% for AGIs over 200k)
Earned income credit: $2,266 (reported on 14.8% of returns)
Here:
$2,266
State:
$2,584
(% of AGI for various income ranges: 91.8% for AGIs below $25k, 71.4% for AGIs $25k-50k, 1.6% for AGIs $50k-75k)
Percentage of individuals using paid preparers for their 2020 taxes: 93.1%
Here:
93%
State:
92%
(% for various income ranges: 91.7% for AGIs below $25k, 93.6% for AGIs $25k-50k, 94.7% for AGIs $50k-75k, 94.1% for AGIs $75k-100k, 93.1% for AGIs $100k-200k, 90.6% for AGIs over 200k)
Averages for the 2012 tax year for zip code 75402, filed in 2013:
Average Adjusted Gross Income (AGI) in 2012: $60,336 (Individual Income Tax Returns)
Here:
$60,336
State:
$65,384
Salary/wage: $52,046 (reported on 81.3% of returns)
Here:
$52,046
State:
$52,524
(% of AGI for various income ranges: 75.0% for AGIs below $25k, 76.1% for AGIs $25k-50k, 73.1% for AGIs $50k-75k, 73.3% for AGIs $75k-100k, 75.1% for AGIs $100k-200k, 50.8% for AGIs over 200k)
Taxable interest for individuals: $1,327 (reported on 32.2% of returns)
This zip code:
$1,327
Texas:
$2,372
(% of AGI for various income ranges: 1.2% for AGIs below $25k, 0.7% for AGIs $25k-50k, 0.8% for AGIs $50k-75k, 0.5% for AGIs $75k-100k, 0.8% for AGIs $100k-200k, 0.5% for AGIs over 200k)
Ordinary dividends: $4,679 (reported on 19.6% of returns)
Here:
$4,679
State:
$9,721
(% of AGI for various income ranges: 1.5% for AGIs below $25k, 1.3% for AGIs $25k-50k, 0.9% for AGIs $50k-75k, 0.8% for AGIs $75k-100k, 1.3% for AGIs $100k-200k, 3.2% for AGIs over 200k)
Net capital gain/loss in AGI: +$5,953 (reported on 16.1% of returns)
Here:
+$5,953
State:
+$35,319
(% of AGI for various income ranges: 0.6% for AGIs $25k-50k, 0.2% for AGIs $50k-75k, 0.5% for AGIs $75k-100k, 1.3% for AGIs $100k-200k, 5.4% for AGIs over 200k)
Profit/loss from business: +$12,779 (reported on 16.8% of returns)
Here:
+$12,779
State:
+$13,732
(% of AGI for various income ranges: 6.5% for AGIs below $25k, 2.8% for AGIs $25k-50k, 2.6% for AGIs $50k-75k, 2.1% for AGIs $75k-100k, 2.6% for AGIs $100k-200k, 6.4% for AGIs over 200k)
Taxable individual retirement arrangement distribution: $15,694 (reported on 13.0% of returns)
75402:
$15,694
Texas:
$19,511
(% of AGI for various income ranges: 3.9% for AGIs below $25k, 2.6% for AGIs $25k-50k, 3.4% for AGIs $50k-75k, 4.0% for AGIs $75k-100k, 4.3% for AGIs $100k-200k, 1.8% for AGIs over 200k)
Self-employment retirement plans: $18,900 (reported on 0.4% of returns)
75402:
$18,900
Texas:
$23,938
Total itemized deductions: $20,819 (18% of AGI, reported on 25.4% of returns)
Here:
$20,819
State:
$24,724
Here:
18.0% of AGI
State:
15.9% of AGI
(% of AGI for various income ranges: 7.9% for AGIs below $25k, 8.2% for AGIs $25k-50k, 8.7% for AGIs $50k-75k, 8.6% for AGIs $75k-100k, 9.6% for AGIs $100k-200k, 8.3% for AGIs over 200k)
Charity contributions: $7,457 (reported on 20.4% of returns)
Here:
$7,457
State:
$6,808
(% of AGI for various income ranges: 1.0% for AGIs below $25k, 1.4% for AGIs $25k-50k, 2.0% for AGIs $50k-75k, 2.4% for AGIs $75k-100k, 3.1% for AGIs $100k-200k, 3.5% for AGIs over 200k)
Taxes paid: $5,112 (reported on 25.0% of returns)
75402:
$5,112
State:
$6,921
(% of AGI for various income ranges: 1.4% for AGIs below $25k, 1.7% for AGIs $25k-50k, 2.0% for AGIs $50k-75k, 2.3% for AGIs $75k-100k, 2.6% for AGIs $100k-200k, 1.8% for AGIs over 200k)
Earned income credit: $2,248 (reported on 16.9% of returns)
Here:
$2,248
State:
$2,570
(% of AGI for various income ranges: 6.7% for AGIs below $25k, 1.1% for AGIs $25k-50k)
Percentage of individuals using paid preparers for their 2012 taxes: 48.3%
Here:
48%
State:
51%
(% for various income ranges: 46.0% for AGIs below $25k, 48.3% for AGIs $25k-50k, 48.6% for AGIs $50k-75k, 52.6% for AGIs $75k-100k, 46.9% for AGIs $100k-200k, 66.7% for AGIs over 200k)
Averages for the 2004 tax year for zip code 75402, filed in 2005:
Average Adjusted Gross Income (AGI) in 2004: $49,782 (Individual Income Tax Returns)
Here:
$49,782
State:
$47,881
Salary/wage: $45,737 (reported on 80.0% of returns)
Here:
$45,737
State:
$41,947
(% of AGI for various income ranges: 131.3% for AGIs below $10k, 69.3% for AGIs $10k-25k, 77.3% for AGIs $25k-50k, 75.5% for AGIs $50k-75k, 79.0% for AGIs $75k-100k, 67.1% for AGIs over 100k)
Taxable interest for individuals: $1,787 (reported on 46.8% of returns)
This zip code:
$1,787
Texas:
$2,255
(% of AGI for various income ranges: 9.7% for AGIs below $10k, 3.3% for AGIs $10k-25k, 1.6% for AGIs $25k-50k, 1.3% for AGIs $50k-75k, 0.9% for AGIs $75k-100k, 1.7% for AGIs over 100k)
Taxable dividends: $2,302 (reported on 23.6% of returns)
Here:
$2,302
State:
$4,261
(% of AGI for various income ranges: 5.3% for AGIs below $10k, 1.5% for AGIs $10k-25k, 1.0% for AGIs $25k-50k, 0.9% for AGIs $50k-75k, 0.8% for AGIs $75k-100k, 1.2% for AGIs over 100k)
Net capital gain/loss: +$5,994 (reported on 19.6% of returns)
Here:
+$5,994
State:
+$16,110
(% of AGI for various income ranges: -2.9% for AGIs below $10k, 0.2% for AGIs $10k-25k, 0.4% for AGIs $25k-50k, 0.6% for AGIs $50k-75k, 0.7% for AGIs $75k-100k, 5.6% for AGIs over 100k)
Profit/loss from business: +$9,901 (reported on 18.6% of returns)
Here:
+$9,901
State:
+$11,013
(% of AGI for various income ranges: 19.7% for AGIs below $10k, 5.5% for AGIs $10k-25k, 2.7% for AGIs $25k-50k, 2.4% for AGIs $50k-75k, 1.8% for AGIs $75k-100k, 5.0% for AGIs over 100k)
IRA payment deduction: $3,119 (reported on 2.4% of returns)
75402:
$3,119
Texas:
$3,120
(% of AGI for various income ranges: 0.5% for AGIs below $10k, 0.2% for AGIs $25k-50k, 0.2% for AGIs $50k-75k, 0.1% for AGIs $75k-100k, 0.1% for AGIs over 100k)
Self-employed pension: $17,436 (reported on 0.6% of returns)
Here:
$17,436
Texas:
$16,401
Total itemized deductions: $17,571 (20% of AGI, reported on 28.8% of returns)
Here:
$17,571
State:
$19,631
Here:
20.0% of AGI
State:
18.9% of AGI
(% of AGI for various income ranges: 13.1% for AGIs below $10k, 9.2% for AGIs $10k-25k, 8.9% for AGIs $25k-50k, 10.8% for AGIs $50k-75k, 11.4% for AGIs $75k-100k, 9.9% for AGIs over 100k)
Charity contributions deductions: $5,835 (6% of AGI, reported on 24.3% of returns)
Here:
$5,835
State:
$4,753
Here:
6.3% of AGI
State:
4.2% of AGI
(% of AGI for various income ranges: 1.2% for AGIs below $10k, 1.6% for AGIs $10k-25k, 1.9% for AGIs $25k-50k, 2.5% for AGIs $50k-75k, 3.3% for AGIs $75k-100k, 3.5% for AGIs over 100k)
Total tax: $8,079 (reported on 76.8% of returns)
75402:
$8,079
State:
$9,058
(% of AGI for various income ranges: 5.3% for AGIs below $10k, 3.7% for AGIs $10k-25k, 6.9% for AGIs $25k-50k, 8.9% for AGIs $50k-75k, 10.7% for AGIs $75k-100k, 19.8% for AGIs over 100k)
Earned income credit: $1,849 (reported on 14.4% of returns)
Here:
$1,849
State:
$2,024
Percentage of individuals using paid preparers for their 2004 taxes: 56.1%
Here:
56%
State:
57%
(% for various income ranges: 50.0% for AGIs below $10k, 62.0% for AGIs $10k-25k, 60.5% for AGIs $25k-50k, 53.5% for AGIs $50k-75k, 49.5% for AGIs $75k-100k, 55.6% for AGIs over 100k)
Household received Food Stamps/SNAP in the past 12 months: 839 Household did not receive Food Stamps/SNAP in the past 12 months: 6,982
Women who had a birth in the past 12 months: 180 (135 now married, 45 unmarried) Women who did not have a birth in the past 12 months: 4,672 (1,993 now married, 2,681 unmarried)
Housing units in zip code 75402 with a mortgage: 2,641 (102 second mortgage, 87 both second mortgage and home equity loan) Houses without a mortgage: 109
Median monthly owner costs for units with a mortgage: $1,747 Median monthly owner costs for units without a mortgage: $710
Residents with income below the poverty level in 2022:
This zip code:
10.2%
Whole state:
14.0%
Residents with income below 50% of the poverty level in 2022:
This zip code:
5.7%
Whole state:
7.4%
Median number of rooms in houses and condos:
Here:
6.3
State:
6.3
Median number of rooms in apartments:
Here:
4.3
State:
4.0
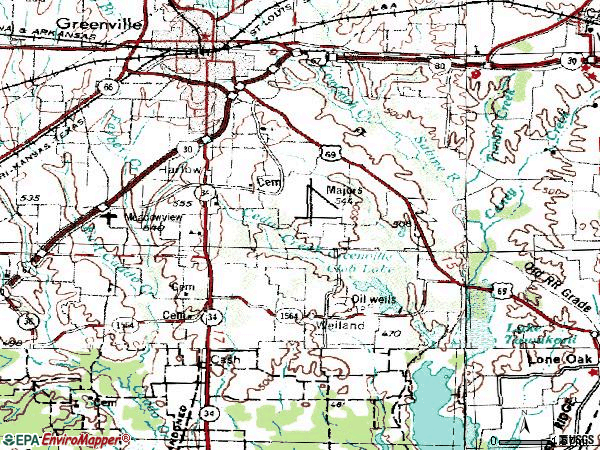
Notable locations in this zip code not listed on our city pages
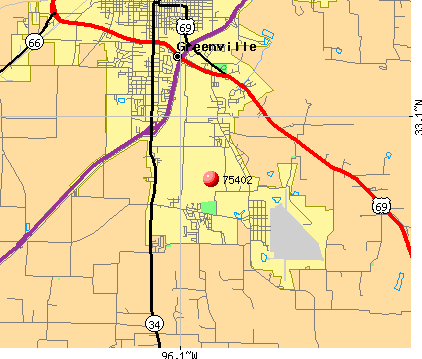
Notable locations in zip code 75402: Center Point (A), Meadowview Community Center (B), Shady Grove Community Hall (C), Tawakoni Area Public Library (D), Greenville Fire Department Station 4 (E), Cash Fire Department - First Responders (F), Greenville Fire Department Station 3 (G). Display/hide their locations on the map
Churches in zip code 75402 include: Battle Ax Church (A), Cash Baptist Church (B), Cedar Grove Church (C), Westminster Presbyterian Church (D), Grace Presbyterian Church (E), First Presbyterian Church (F), Westview United Methodist Church (G), First Church of the Nazarene (H), Church of God (I). Display/hide their locations on the map
Cemeteries: Boyle Cemetery (1), Weiland Cemetery (2), Center Point Cemetery (3), Etter Lake Cemetery (4), Forest Park Cemetery (5), Hart Cemetery (6), Simmons Cemetery (7). Display/hide their locations on the map
Streams, rivers, and creeks: Wolf Creek (A), Warren Branch (B), Mustang Branch (C), McGrew Branch (D), Lynn Creek (E), East Caddo Creek (F), West Caddo Creek (G), Hale Creek (H), Long Branch (I). Display/hide their locations on the map
In group quarters: 200 (-1 institutionalized population)
Size of family households: 2,610 2-persons, 994 3-persons, 818 4-persons, 518 5-persons, 246 6-persons, 151 7-or-more-persons
Size of nonfamily households: 1,770 1-person, 657 2-persons, 81 3-persons
3,128 married couples with children.
1,142 single-parent households (496 men, 646 women).
93.4% of residents of 75402 zip code speak English at home.
5.1% of residents speak Spanish at home (64% very well, 27% well, 7% not well, 2% not at all).
0.9% of residents speak other Indo-European language at home (100% very well).
0.7% of residents speak Asian or Pacific Island language at home (93% very well, 7% well).
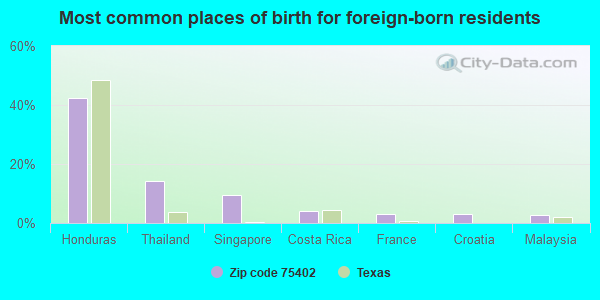
Foreign born population: 727 (3.5%) (56.8% of them are naturalized citizens)
This zip code:
3.5%
Whole state:
17.2%
42%Honduras
14%Thailand
9%Singapore
4%Costa Rica
3%France
3%Croatia
3%Malaysia
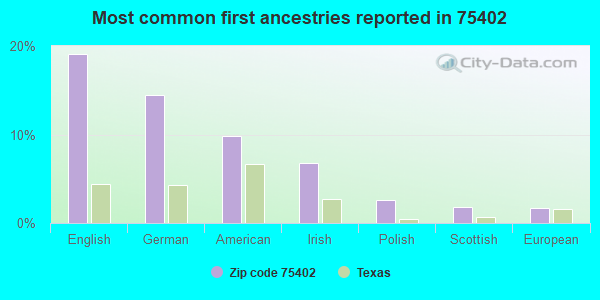
19%English
14%German
10%American
7%Irish
3%Polish
2%Scottish
2%European
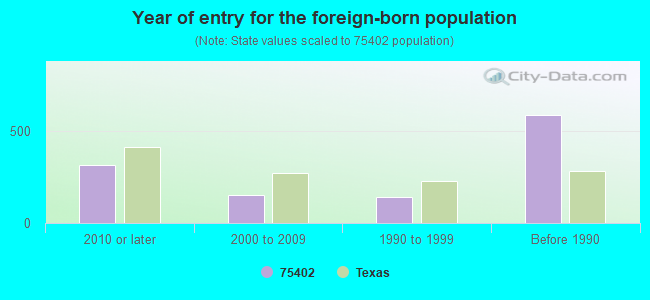
Year of entry for the foreign-born population
3162010 or later
1522000 to 2009
1391990 to 1999
588Before 1990
Facilities with environmental interests located in this zip code:
AMERICAN TEXAS FIRELOG (7000 INDUSTRIAL DR in GREENVILLE, TX)
AIR MINOR (AIRS/AFS) Business SIC classification: SAWMILLS AND PLANING MILLS, GENERAL; WOOD PRODUCTS
Housing units lacking complete plumbing facilities: 0.8% Housing units lacking complete kitchen facilities: 3.6%
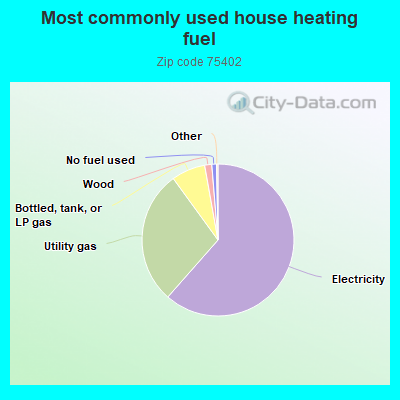
61.5%Electricity
28.5%Utility gas
7.2%Bottled, tank, or LP gas
1.5%Wood
1.0%No fuel used
Place of birth for U.S.-born residents:
This state: 14,107
Northeast: 527
Midwest: 1,460
South: 1,752
West: 1,736
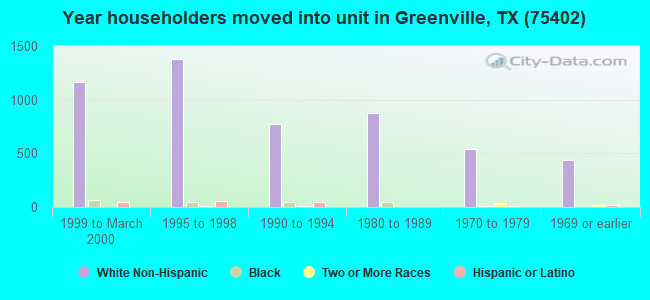
55% of the 75402 zip code residents lived in the same house 5 years ago. Out of people who lived in different houses, 59% lived in this county. Out of people who lived in different counties, 50% lived in Texas.
84% of the 75402 zip code residents lived in the same house 1 year ago. Out of people who lived in different houses, 56% moved from this county. Out of people who lived in different houses, 32% moved from different county within same state. Out of people who lived in different houses, 4% moved from different state. Out of people who lived in different houses, 6% moved from abroad.
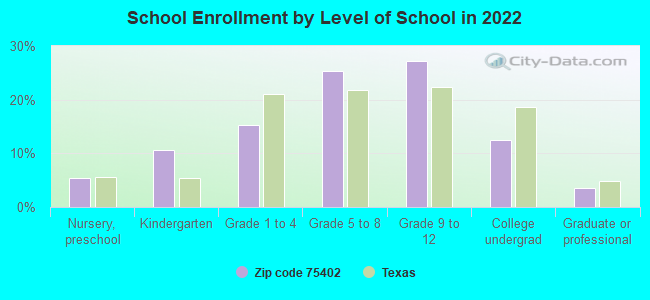
Private vs. public school enrollment:
Students in private schools in grades 1 to 8 (elementary and middle school): 261
Here:
14.0%
Texas:
8.8%
Students in private schools in grades 9 to 12 (high school): 83
Here:
6.7%
Texas:
8.0%
Students in private undergraduate colleges: 31
Here:
5.5%
Texas:
16.2%
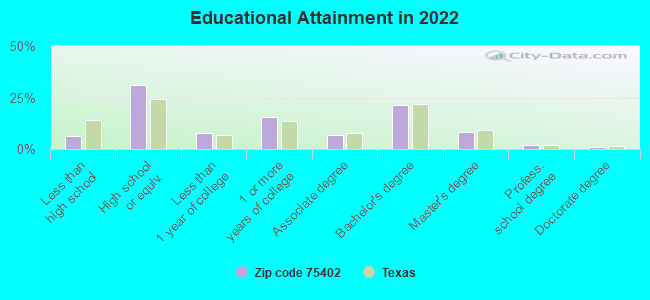
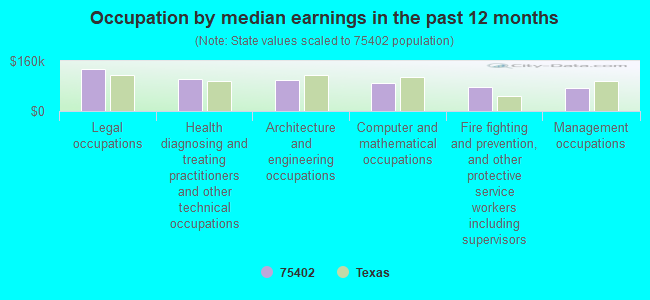
Occupation by median earnings in the past 12 months ($)
133,465Legal occupations
103,263Health diagnosing and treating practitioners and other technical occupations
97,913Architecture and engineering occupations
90,735Computer and mathematical occupations
77,843Fire fighting and prevention, and other protective service workers including supervisors
72,692Management occupations
Companies with federal contracts located in this zip code (GREENVILLE, TX):
RAYTHEON COMPANY AIRCRAFT INTE (10001 JACK FINNEY BLVD) : $163,827,907 in 111 contractsfrom 1999 to 2006
Contracts for Airframe Structural Components, Maintenance, Repair and Rebuilding of Equipment -- Aircraft and Airframe Structural Components, Miscellaneous Machine Tools, Automatic Pilot Mechanisms and Airborne Gyro Components, and moreby Air Force, Defense Logistics Agency, NASA, Army, and others Signed by year:2000: $39,510,971; 2001: $8,003,651; 2002: $57,013,856; 2003: $34,951,824; 2004: $19,514,105; 2005: $5,717,815; 2006: -$1,180,315.
Biggest contracts:
$26,141,057 with Air Force for Airframe Structural Components. Taking place in KY. Signed on 2000-03-22. Completion date: 2001-07-31.
$18,473,060 with Air Force for Maintenance, Repair and Rebuilding of Equipment -- Aircraft and Airframe Structural Components. Taking place in MS. Signed on 2004-10-08. Completion date: 2005-04-30.
$14,900,000 with Air Force for Airframe Structural Components. Taking place in KY. Signed on 2003-08-01. Completion date: 2004-12-31.
$13,963,606, same as above.Signed on 2002-07-03. Completion date: 2003-08-31.
CYTEC ENGINEERED MATERIALS INC (4300 JACKSON ST) : $1,975,080 in 33 contractsfrom 1999 to 2006
Contracts for Glass Fabricated Materials, Guns, 75 mm through 125 mm, Miscellaneous Fabricated Nonmetallic Materials, Textile Fabrics, and moreby Army, NASA, Air Force, Federal Supply Service, and others Signed by year:2000: $349,138; 2001: $156,796; 2002: $192,919; 2003: $258,528; 2004: $249,624; 2005: $480,037; 2006: $202,038.
Biggest contracts:
$374,635 with Army for Glass Fabricated Materials. Signed on 2005-06-07. Completion date: 2005-12-19.
$199,120, same as above.Signed on 2006-03-14. Completion date: 2006-05-16.
$98,450 with Army for Guns, 75 mm through 125 mm. Signed on 2002-04-09. Completion date: 2002-11-27.
$90,768 with Army for Glass Fabricated Materials. Signed on 2001-04-12. Completion date: 2002-01-25.
NADAR CONSULTING INTERNATIONAL (5604 NEW HAVEN STREET; small business) : $1,643,055 in 6 contractsfrom 2000 to 2004
Contracts for Technical Assistance by Air Force Signed by year:2000: $266,704; 2001: $586,201; 2002: $549,040; 2003: $0; 2004: $241,110; 2005: $0; 2006: $0.
Biggest contracts:
$586,201 with Air Force for Technical Assistance. Signed on 2001-02-21. Completion date: 2002-01-15.
$549,040, same as above.Signed on 2002-01-14. Completion date: 2002-01-12.
$241,110, same as above.Signed on 2004-01-12. Completion date: 2004-09-30.
$96,983, same as above.Signed on 2000-04-25. Completion date: 2000-04-17.
EAST TEXAS PRODUCE, INC (6901 I 30; small business) : $20,723 in 7 contractsfrom 2004 to 2005
Contracts for Fruits and Vegetables by Defense Logistics Agency Signed by year:2000: $0; 2001: $0; 2002: $0; 2003: $0; 2004: $11,383; 2005: $9,340; 2006: $0.
Biggest contracts:
$3,989 with Defense Logistics Agency for Fruits and Vegetables. Signed on 2005-11-03. Completion date: 2005-11-03.
$3,011, same as above.Signed on 2004-11-06. Completion date: 2004-11-06.
$2,908, same as above.Signed on 2004-10-01. Completion date: 2004-10-01.
$2,776, same as above.Signed on 2004-11-13. Completion date: 2004-11-13.
Top industries in this zip code by the number of employees in 2005:
Professional, Scientific, and Technical Services: Computer Systems Design Services (over 1000 employees: 1 establishment, 1-4 employees: 3 establishments)
2003 - 2018 National Fire Incident Reporting System (NFIRS) incidents
Based on the data from the years 2003 - 2018 the average number of fire incidents per year is 99. The highest number of fire incidents - 141 took place in 2005, and the least - 42 in 2007. The data has an increasing trend.
When looking into fire subcategories, the most reports belonged to: Outside Fires (56.4%), and Structure Fires (25.1%).
Fire incident types reported to NFIRS in Zip Code 75402


 Nearest zip codes: 75401, 75135, 75474, 75422, 75453, 75164.


 Based on the data from the years 2003 - 2018 the average number of fire incidents per year is 99. The highest number of fire incidents - 141 took place in 2005, and the least - 42 in 2007. The data has an increasing trend.
 When looking into fire subcategories, the most reports belonged to: Outside Fires (56.4%), and Structure Fires (25.1%).