Estimated zip code population in 2022: 3,372 Zip code population in 2010: 3,136 Zip code population in 2000: 2,863
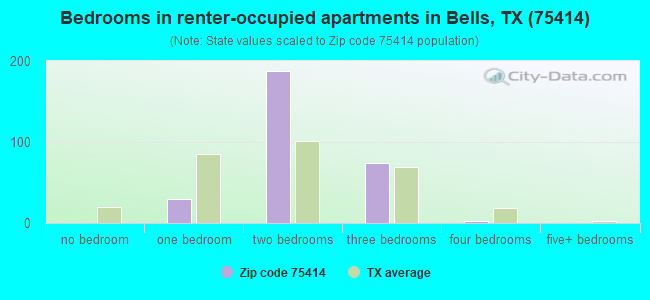
Houses and condos: 1,481 Renter-occupied apartments: 301
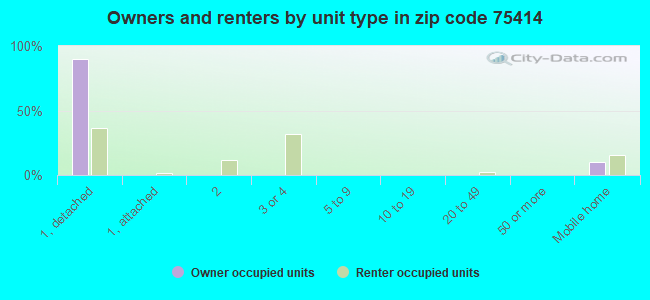
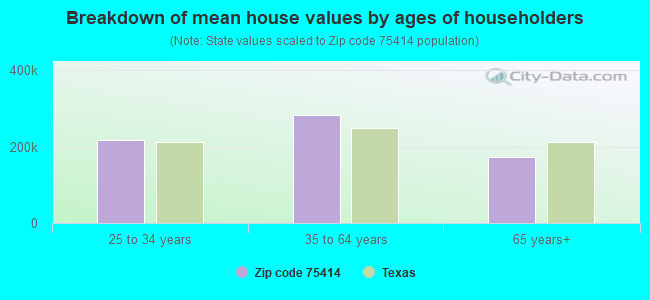
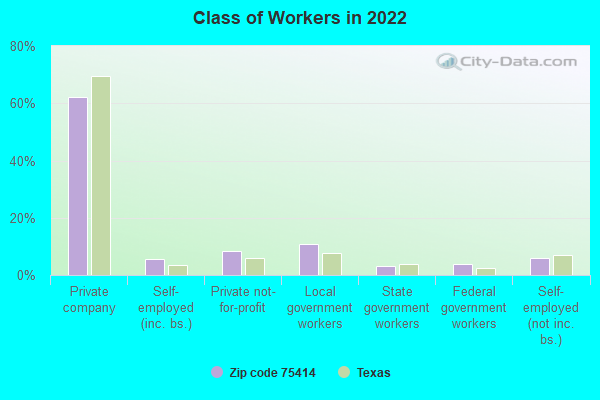
% of renters here:
23%
State:
38%
March 2022 cost of living index in zip code 75414: 79.4 (low, U.S. average is 100)
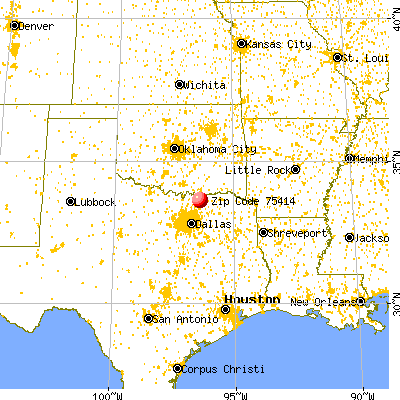
Land area: 48.7 sq. mi. Water area: 0.3 sq. mi.
Population density: 69 people per square mile
(very low).
OSM Map
General Map
Google Map
MSN Map
OSM Map
General Map
Google Map
MSN Map
OSM Map
General Map
Google Map
MSN Map
OSM Map
General Map
Google Map
MSN Map
Please wait while loading the map...
Real estate property taxes paid for housing units in 2022:
This zip code:
0.8% ($2,088)
Texas:
1.5% ($4,050)
Median real estate property taxes paid for housing units with mortgages in 2022: $3,573 (1.4%) Median real estate property taxes paid for housing units with no mortgage in 2022: $1,883 (0.8%)
Business Search- 14 Million verified businesses
Males: 1,526
(45.3%)
Females: 1,845
(54.7%)
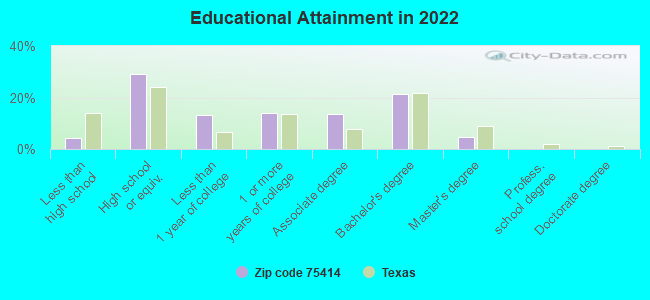
For population 25 years and over in 75414:
High school or higher: 95.8%
Bachelor's degree or higher: 26.0%
Graduate or professional degree: 4.7%
Unemployed: 6.1%
Mean travel time to work (commute): 32.1 minutes
For population 15 years and over in 75414:
Never married: 26.0%
Now married: 51.5%
Separated: 1.5%
Widowed: 4.5%
Divorced: 16.5%
Zip code 75414 compared to state average:
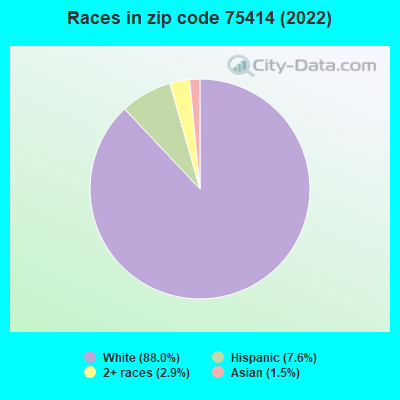
Black race population percentage significantly below state average.
Hispanic race population percentage significantly below state average.
Foreign-born population percentage significantly below state average.
Renting percentage below state average.
Length of stay since moving in significantly above state average.
Averages for the 2020 tax year for zip code 75414, filed in 2021:
Average Adjusted Gross Income (AGI) in 2020: $67,866 (Individual Income Tax Returns)
Here:
$67,866
State:
$77,054
Salary/wage: $63,208 (reported on 82.6% of returns)
Here:
$63,208
State:
$62,766
(% of AGI for various income ranges: 1076.5% for AGIs below $25k, 3556.6% for AGIs $25k-50k, 6202.6% for AGIs $50k-75k, 9981.7% for AGIs $75k-100k, 15075.0% for AGIs $100k-200k)
Taxable interest for individuals: $1,140 (reported on 25.8% of returns)
This zip code:
$1,140
Texas:
$2,665
(% of AGI for various income ranges: 13.8% for AGIs below $25k, 30.0% for AGIs $25k-50k, 42.1% for AGIs $50k-75k, 12.5% for AGIs $75k-100k, 93.5% for AGIs $100k-200k)
Ordinary dividends: $3,126 (reported on 12.3% of returns)
Here:
$3,126
State:
$10,044
(% of AGI for various income ranges: 24.1% for AGIs $25k-50k, 52.1% for AGIs $50k-75k, 87.5% for AGIs $75k-100k, 124.0% for AGIs $100k-200k)
Net capital gain/loss in AGI: +$16,791 (reported on 14.2% of returns)
Here:
+$16,791
State:
+$39,590
(% of AGI for various income ranges: 17.4% for AGIs below $25k, 49.3% for AGIs $25k-50k, 138.4% for AGIs $50k-75k, 193.3% for AGIs $75k-100k, 504.0% for AGIs $100k-200k)
Profit/loss from business: +$10,633 (reported on 17.4% of returns)
Here:
+$10,633
State:
+$10,888
(% of AGI for various income ranges: 103.2% for AGIs below $25k, 211.4% for AGIs $25k-50k, 224.2% for AGIs $50k-75k, 308.3% for AGIs $75k-100k, 555.5% for AGIs $100k-200k)
Taxable individual retirement arrangement distribution: $17,587 (reported on 9.7% of returns)
75414:
$17,587
Texas:
$24,740
(% of AGI for various income ranges: 40.0% for AGIs below $25k, 108.3% for AGIs $25k-50k, 418.9% for AGIs $50k-75k, 696.0% for AGIs $100k-200k)
Total itemized deductions: $39,044 (reported on 5.8% of returns)
Here:
$39,044
State:
$40,428
(% of AGI for various income ranges: 249.0% for AGIs $25k-50k, 732.5% for AGIs $100k-200k)
Charity contributions: $11,514 (reported on 4.5% of returns)
Here:
$11,514
State:
$18,201
(% of AGI for various income ranges: 403.0% for AGIs $100k-200k)
Taxes paid: $6,533 (reported on 5.8% of returns)
75414:
$6,533
State:
$7,821
(% of AGI for various income ranges: 47.9% for AGIs $25k-50k, 149.0% for AGIs $100k-200k)
Earned income credit: $2,400 (reported on 16.1% of returns)
Here:
$2,400
State:
$2,584
(% of AGI for various income ranges: 95.9% for AGIs below $25k, 94.5% for AGIs $25k-50k)
Percentage of individuals using paid preparers for their 2020 taxes: 94.2%
Here:
94%
State:
92%
(% for various income ranges: 93.0% for AGIs below $25k, 91.7% for AGIs $25k-50k, 96.0% for AGIs $50k-75k, 94.1% for AGIs $75k-100k, 96.4% for AGIs $100k-200k, 100.0% for AGIs over 200k)
Averages for the 2012 tax year for zip code 75414, filed in 2013:
Average Adjusted Gross Income (AGI) in 2012: $52,826 (Individual Income Tax Returns)
Here:
$52,826
State:
$65,384
Salary/wage: $48,966 (reported on 86.7% of returns)
Here:
$48,966
State:
$52,524
(% of AGI for various income ranges: 74.6% for AGIs below $25k, 80.4% for AGIs $25k-50k, 81.9% for AGIs $50k-75k, 81.3% for AGIs $75k-100k, 86.9% for AGIs $100k-200k, 62.2% for AGIs over 200k)
Taxable interest for individuals: $782 (reported on 29.7% of returns)
This zip code:
$782
Texas:
$2,372
(% of AGI for various income ranges: 2.0% for AGIs below $25k, 0.6% for AGIs $25k-50k, 0.3% for AGIs $50k-75k, 0.3% for AGIs $75k-100k, 0.2% for AGIs $100k-200k)
Ordinary dividends: $2,016 (reported on 14.8% of returns)
Here:
$2,016
State:
$9,721
(% of AGI for various income ranges: 0.9% for AGIs below $25k, 0.8% for AGIs $25k-50k, 0.5% for AGIs $50k-75k, 0.5% for AGIs $75k-100k, 0.6% for AGIs $100k-200k)
Net capital gain/loss in AGI: +$4,394 (reported on 13.3% of returns)
Here:
+$4,394
State:
+$35,319
(% of AGI for various income ranges: 0.8% for AGIs $25k-50k, 0.2% for AGIs $50k-75k, 0.1% for AGIs $75k-100k, 3.4% for AGIs $100k-200k)
Profit/loss from business: +$9,070 (reported on 15.6% of returns)
Here:
+$9,070
State:
+$13,732
(% of AGI for various income ranges: 9.3% for AGIs below $25k, 2.4% for AGIs $25k-50k, 4.2% for AGIs $50k-75k, 3.3% for AGIs $75k-100k, 0.3% for AGIs $100k-200k)
Taxable individual retirement arrangement distribution: $13,321 (reported on 10.9% of returns)
75414:
$13,321
Texas:
$19,511
(% of AGI for various income ranges: 3.2% for AGIs below $25k, 2.6% for AGIs $25k-50k, 6.0% for AGIs $50k-75k, 3.2% for AGIs $100k-200k)
Total itemized deductions: $19,584 (21% of AGI, reported on 25.0% of returns)
Here:
$19,584
State:
$24,724
Here:
21.3% of AGI
State:
15.9% of AGI
(% of AGI for various income ranges: 8.5% for AGIs below $25k, 8.1% for AGIs $25k-50k, 7.8% for AGIs $50k-75k, 9.3% for AGIs $75k-100k, 14.6% for AGIs $100k-200k)
Charity contributions: $4,128 (reported on 19.5% of returns)
Here:
$4,128
State:
$6,808
(% of AGI for various income ranges: 1.5% for AGIs $25k-50k, 1.0% for AGIs $50k-75k, 1.6% for AGIs $75k-100k, 2.9% for AGIs $100k-200k)
Taxes paid: $4,531 (reported on 25.0% of returns)
75414:
$4,531
State:
$6,921
(% of AGI for various income ranges: 1.7% for AGIs below $25k, 1.4% for AGIs $25k-50k, 1.6% for AGIs $50k-75k, 2.4% for AGIs $75k-100k, 3.0% for AGIs $100k-200k, 2.1% for AGIs over 200k)
Earned income credit: $2,332 (reported on 17.2% of returns)
Here:
$2,332
State:
$2,570
(% of AGI for various income ranges: 6.6% for AGIs below $25k, 1.3% for AGIs $25k-50k)
Percentage of individuals using paid preparers for their 2012 taxes: 54.7%
Here:
55%
State:
51%
(% for various income ranges: 46.7% for AGIs below $25k, 56.7% for AGIs $25k-50k, 54.5% for AGIs $50k-75k, 64.3% for AGIs $75k-100k, 73.3% for AGIs $100k-200k)
Averages for the 2004 tax year for zip code 75414, filed in 2005:
Average Adjusted Gross Income (AGI) in 2004: $40,545 (Individual Income Tax Returns)
Here:
$40,545
State:
$47,881
Salary/wage: $39,427 (reported on 86.8% of returns)
Here:
$39,427
State:
$41,947
(% of AGI for various income ranges: 100.3% for AGIs below $10k, 83.2% for AGIs $10k-25k, 84.8% for AGIs $25k-50k, 86.9% for AGIs $50k-75k, 88.3% for AGIs $75k-100k, 75.5% for AGIs over 100k)
Taxable interest for individuals: $1,356 (reported on 40.3% of returns)
This zip code:
$1,356
Texas:
$2,255
(% of AGI for various income ranges: 8.6% for AGIs below $10k, 2.9% for AGIs $10k-25k, 1.5% for AGIs $25k-50k, 1.3% for AGIs $50k-75k, 0.5% for AGIs $75k-100k, 0.7% for AGIs over 100k)
Taxable dividends: $912 (reported on 16.5% of returns)
Here:
$912
State:
$4,261
(% of AGI for various income ranges: 0.9% for AGIs below $10k, 0.6% for AGIs $10k-25k, 0.7% for AGIs $25k-50k, 0.3% for AGIs $50k-75k, 0.1% for AGIs $75k-100k, 0.4% for AGIs over 100k)
Net capital gain/loss: +$4,365 (reported on 14.4% of returns)
Here:
+$4,365
State:
+$16,110
(% of AGI for various income ranges: 1.1% for AGIs below $10k, 0.3% for AGIs $10k-25k, 2.8% for AGIs $25k-50k, 0.2% for AGIs $50k-75k, 2.3% for AGIs $75k-100k, 2.1% for AGIs over 100k)
Profit/loss from business: +$5,221 (reported on 18.4% of returns)
Here:
+$5,221
State:
+$11,013
(% of AGI for various income ranges: 2.5% for AGIs below $10k, 5.1% for AGIs $10k-25k, 3.3% for AGIs $25k-50k, 2.2% for AGIs $50k-75k, 0.2% for AGIs $75k-100k, 2.4% for AGIs over 100k)
IRA payment deduction: $3,071 (reported on 1.2% of returns)
75414:
$3,071
Texas:
$3,120
Total itemized deductions: $16,668 (24% of AGI, reported on 23.7% of returns)
Here:
$16,668
State:
$19,631
Here:
24.0% of AGI
State:
18.9% of AGI
(% of AGI for various income ranges: 8.7% for AGIs $10k-25k, 9.6% for AGIs $25k-50k, 9.7% for AGIs $50k-75k, 10.3% for AGIs $75k-100k, 11.0% for AGIs over 100k)
Charity contributions deductions: $2,987 (4% of AGI, reported on 19.0% of returns)
Here:
$2,987
State:
$4,753
Here:
4.1% of AGI
State:
4.2% of AGI
(% of AGI for various income ranges: 1.3% for AGIs $10k-25k, 0.9% for AGIs $25k-50k, 1.7% for AGIs $50k-75k, 1.4% for AGIs $75k-100k, 1.7% for AGIs over 100k)
Total tax: $4,952 (reported on 75.3% of returns)
75414:
$4,952
State:
$9,058
(% of AGI for various income ranges: 3.0% for AGIs below $10k, 3.9% for AGIs $10k-25k, 5.7% for AGIs $25k-50k, 8.0% for AGIs $50k-75k, 10.1% for AGIs $75k-100k, 17.2% for AGIs over 100k)
Earned income credit: $1,660 (reported on 15.9% of returns)
Here:
$1,660
State:
$2,024
Percentage of individuals using paid preparers for their 2004 taxes: 56.7%
Here:
57%
State:
57%
(% for various income ranges: 44.8% for AGIs below $10k, 55.9% for AGIs $10k-25k, 57.9% for AGIs $25k-50k, 60.6% for AGIs $50k-75k, 70.5% for AGIs $75k-100k, 61.3% for AGIs over 100k)
Household received Food Stamps/SNAP in the past 12 months: 151 Household did not receive Food Stamps/SNAP in the past 12 months: 1,175
Women who had a birth in the past 12 months: 47 (42 now married, 5 unmarried) Women who did not have a birth in the past 12 months: 730 (300 now married, 431 unmarried)
Housing units in zip code 75414 with a mortgage: 508 (23 second mortgage) Median monthly owner costs for units with a mortgage: $1,655 Median monthly owner costs for units without a mortgage: $592
Residents with income below the poverty level in 2022:
This zip code:
12.2%
Whole state:
14.0%
Residents with income below 50% of the poverty level in 2022:
This zip code:
5.5%
Whole state:
7.4%
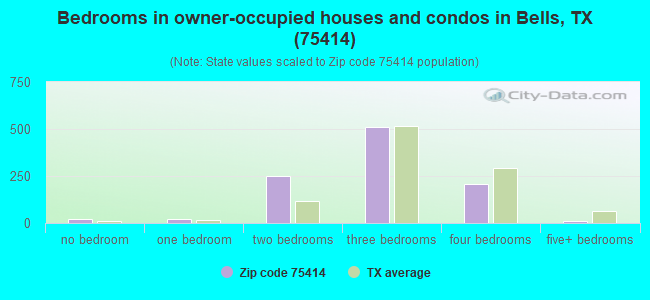
Median number of rooms in houses and condos:
Here:
6.1
State:
6.3
Median number of rooms in apartments:
Here:
4.1
State:
4.0
Notable locations in this zip code not listed on our city pages
Cemeteries: Bethel Cemetery (1), Dugan Cemetery (2), Washburn Cemetery (3), Isom Cemetery (4), Montgomery Cemetery (5), North Cemetery (6), Bush Cemetery (7). Display/hide their locations on the map
Reservoirs: Trail Lake (A), Soil Conservation Service Site 20 Reservoir (B), Soil Conservation Service Site 21 Reservoir (C), Soil Conservation Service Site 23 Reservoir (D), Soil Conservation Service Site 1 Reservoir (E), Soil Conservation Service Site 33 Reservoir (F), Stern Lake (G), Soil Conservation Service Site 32 Reservoir (H). Display/hide their locations on the map
686 married couples with children.
263 single-parent households (183 men, 80 women).
95.6% of residents of 75414 zip code speak English at home.
2.6% of residents speak Spanish at home (87% very well, 13% not well).
1.2% of residents speak other Indo-European language at home (65% very well, 19% not well, 16% not at all).
0.4% of residents speak Asian or Pacific Island language at home (100% well).
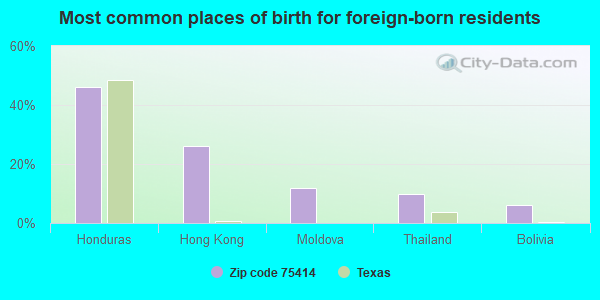
Foreign born population: 50 (1.5%) (45.5% of them are naturalized citizens)
This zip code:
1.5%
Whole state:
17.2%
46%Honduras
26%Hong Kong
12%Moldova
10%Thailand
6%Bolivia
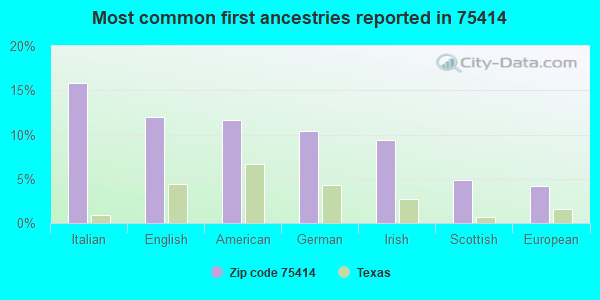
16%Italian
12%English
12%American
10%German
9%Irish
5%Scottish
4%European
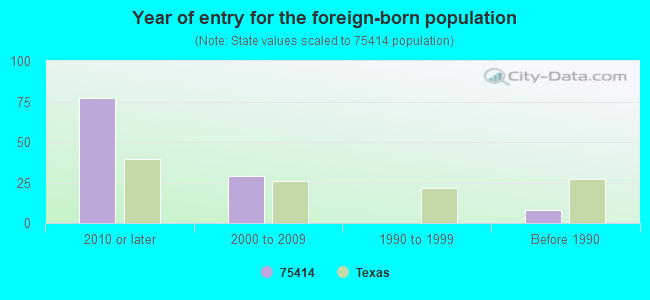
Year of entry for the foreign-born population
772010 or later
292000 to 2009
01990 to 1999
8Before 1990
Facilities with environmental interests located in this zip code:
AAA PLATING CO (805 W VERNON in BELLS, TX)
(Integrated Compliance Information System) - ICIS-06-1999-0317, FORMAL ENFORCEMENT ACTION Business SIC classification: ELECTROPLATING, PLATING, POLISHING, ANODIZING, AND COLORING
Housing units lacking complete plumbing facilities: 2.4% Housing units lacking complete kitchen facilities: 4.5%
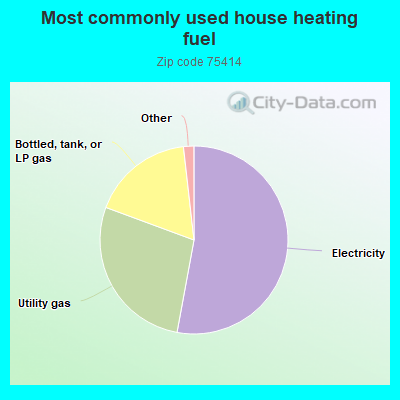
53.0%Electricity
27.8%Utility gas
17.6%Bottled, tank, or LP gas
0.7%Wood
0.6%Fuel oil, kerosene, etc.
Population in 1990: 1,829. Population change in the 1990s: +1,034 (+56.5%).
Place of birth for U.S.-born residents:
This state: 2,471
Northeast: 53
Midwest: 226
South: 260
West: 242
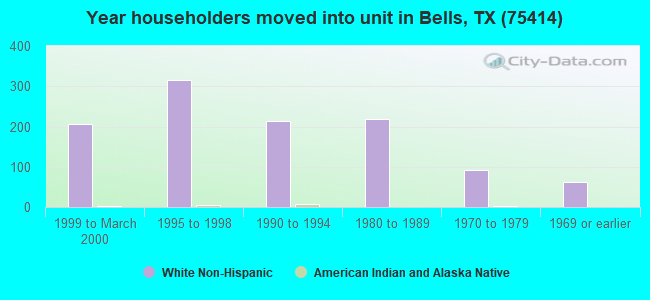
53% of the 75414 zip code residents lived in the same house 5 years ago. Out of people who lived in different houses, 48% lived in this county. Out of people who lived in different counties, 50% lived in Texas.
86% of the 75414 zip code residents lived in the same house 1 year ago. Out of people who lived in different houses, 24% moved from this county. Out of people who lived in different houses, 75% moved from different county within same state. Out of people who lived in different houses, 3% moved from different state.
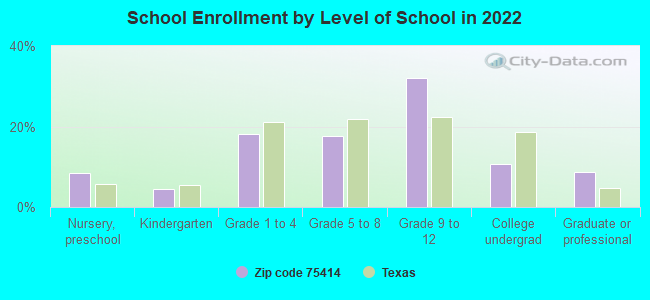
Private vs. public school enrollment:
Students in private schools in grades 1 to 8 (elementary and middle school): 14
Here:
5.3%
Texas:
8.8%
Students in private schools in grades 9 to 12 (high school): 6
Here:
2.6%
Texas:
8.0%
Students in private undergraduate colleges: 11
Here:
14.0%
Texas:
16.2%
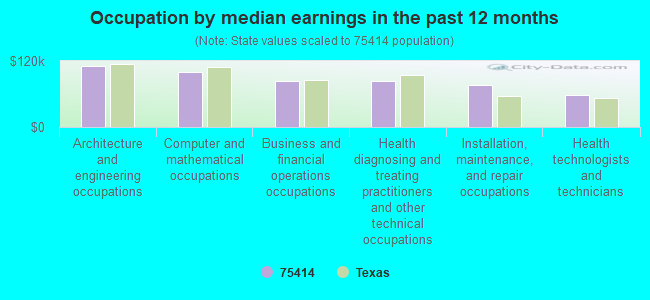
Occupation by median earnings in the past 12 months ($)
110,000Architecture and engineering occupations
99,251Computer and mathematical occupations
84,246Business and financial operations occupations
83,693Health diagnosing and treating practitioners and other technical occupations
76,228Installation, maintenance, and repair occupations
58,533Health technologists and technicians
Top industries in this zip code by the number of employees in 2005:
Mining: Construction Sand and Gravel Mining (20-49 employees: 1 establishment)
Other Services (except Public Administration): Religious Organizations (5-9: 2, 1-4: 1)
Finance and Insurance: Commercial Banking (10-19: 1)
Accommodation and Food Services: Limited-Service Restaurants (10-19: 1)
Health Care and Social Assistance: Child Day Care Services (5-9: 1)
Accommodation and Food Services: Full-Service Restaurants (5-9: 1)
Fatal accident statistics in 2013:
Fatal accident count: 1
Vehicles involved in fatal accidents: 1
Fatal accidents caused by drunken drivers: 0
Fatalities: 1
Persons involved in fatal accidents: 7
Pedestrians involved in fatal accidents: 0
Fatal accident statistics in 2012:
Fatal accident count: 3
Vehicles involved in fatal accidents: 7
Fatal accidents caused by drunken drivers: 1
Fatalities: 3
Persons involved in fatal accidents: 8
Pedestrians involved in fatal accidents: 0
Home Mortgage Disclosure Act Aggregated Statistics For Year 2009 (Based on 4 partial tracts)
A) FHA, FSA/RHS & VA Home Purchase Loans
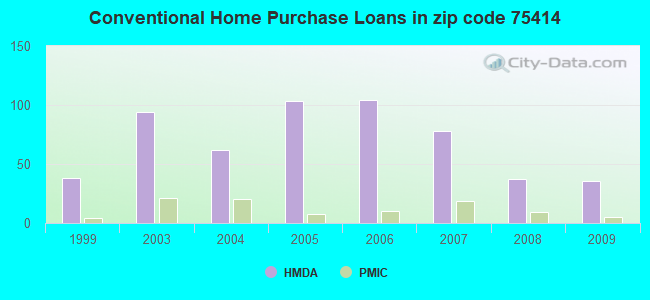
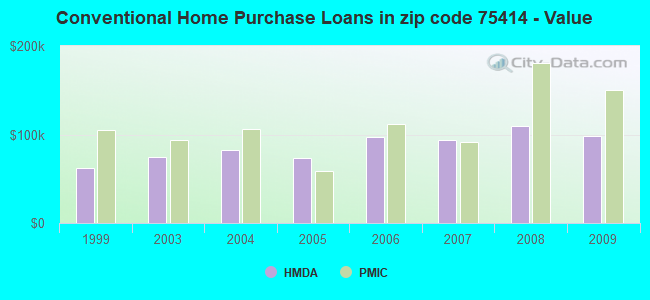
B) Conventional Home Purchase Loans
C) Refinancings
D) Home Improvement Loans
E) Loans on Dwellings For 5+ Families
F) Non-occupant Loans on < 5 Family Dwellings (A B C & D)
G) Loans On Manufactured Home Dwelling (A B C & D)
Number
Average Value
Number
Average Value
Number
Average Value
Number
Average Value
Number
Average Value
Number
Average Value
Number
Average Value
LOANS ORIGINATED
29
$132,591
36
$97,814
70
$162,928
9
$26,760
0
$0
20
$82,188
9
$45,371
APPLICATIONS APPROVED, NOT ACCEPTED
0
$0
4
$121,958
12
$159,041
0
$0
0
$0
2
$68,130
3
$85,777
APPLICATIONS DENIED
5
$90,726
7
$89,587
43
$113,632
11
$52,329
1
$254,940
1
$153,810
5
$94,294
APPLICATIONS WITHDRAWN
6
$116,883
3
$54,670
29
$142,341
4
$75,900
0
$0
3
$23,463
1
$132,570
FILES CLOSED FOR INCOMPLETENESS
1
$93,480
1
$120,670
4
$116,165
0
$0
0
$0
0
$0
1
$49,960
Aggregated Statistics For Year 2008 (Based on 4 partial tracts)
A) FHA, FSA/RHS & VA Home Purchase Loans
B) Conventional Home Purchase Loans
C) Refinancings
D) Home Improvement Loans
F) Non-occupant Loans on < 5 Family Dwellings (A B C & D)
G) Loans On Manufactured Home Dwelling (A B C & D)
Number
Average Value
Number
Average Value
Number
Average Value
Number
Average Value
Number
Average Value
Number
Average Value
LOANS ORIGINATED
27
$112,452
37
$109,664
49
$123,229
12
$43,000
19
$97,514
12
$80,965
APPLICATIONS APPROVED, NOT ACCEPTED
3
$125,163
6
$115,393
12
$122,408
2
$37,610
1
$35,690
5
$60,606
APPLICATIONS DENIED
3
$60,657
16
$97,556
48
$101,881
14
$36,164
4
$49,562
12
$75,483
APPLICATIONS WITHDRAWN
11
$101,108
3
$67,133
22
$133,692
1
$21,250
3
$43,623
5
$87,998
FILES CLOSED FOR INCOMPLETENESS
1
$178,100
1
$139,010
2
$260,465
0
$0
0
$0
1
$139,010
Aggregated Statistics For Year 2007 (Based on 4 partial tracts)
A) FHA, FSA/RHS & VA Home Purchase Loans
B) Conventional Home Purchase Loans
C) Refinancings
D) Home Improvement Loans
F) Non-occupant Loans on < 5 Family Dwellings (A B C & D)
G) Loans On Manufactured Home Dwelling (A B C & D)
Number
Average Value
Number
Average Value
Number
Average Value
Number
Average Value
Number
Average Value
Number
Average Value
LOANS ORIGINATED
24
$102,815
78
$94,024
61
$120,109
25
$41,018
18
$80,455
22
$70,088
APPLICATIONS APPROVED, NOT ACCEPTED
1
$51,840
20
$80,496
12
$97,242
7
$39,856
2
$42,515
7
$53,513
APPLICATIONS DENIED
2
$82,430
20
$80,522
50
$106,172
24
$45,468
3
$83,563
10
$65,174
APPLICATIONS WITHDRAWN
3
$128,037
3
$128,603
29
$118,049
4
$56,410
2
$73,755
2
$86,680
FILES CLOSED FOR INCOMPLETENESS
0
$0
5
$62,426
8
$119,344
0
$0
0
$0
1
$55,240
Aggregated Statistics For Year 2006 (Based on 4 partial tracts)
A) FHA, FSA/RHS & VA Home Purchase Loans
B) Conventional Home Purchase Loans
C) Refinancings
D) Home Improvement Loans
F) Non-occupant Loans on < 5 Family Dwellings (A B C & D)
G) Loans On Manufactured Home Dwelling (A B C & D)
Number
Average Value
Number
Average Value
Number
Average Value
Number
Average Value
Number
Average Value
Number
Average Value
LOANS ORIGINATED
23
$83,669
104
$97,163
68
$103,770
22
$48,230
17
$102,119
25
$64,368
APPLICATIONS APPROVED, NOT ACCEPTED
4
$120,598
14
$73,693
6
$94,978
0
$0
0
$0
10
$47,604
APPLICATIONS DENIED
7
$65,556
44
$69,690
62
$96,317
21
$29,907
0
$0
20
$55,420
APPLICATIONS WITHDRAWN
1
$67,130
21
$101,380
46
$121,518
4
$63,172
0
$0
2
$65,010
FILES CLOSED FOR INCOMPLETENESS
0
$0
5
$80,782
16
$109,755
0
$0
0
$0
1
$135,120
Aggregated Statistics For Year 2005 (Based on 4 partial tracts)
A) FHA, FSA/RHS & VA Home Purchase Loans
B) Conventional Home Purchase Loans
C) Refinancings
D) Home Improvement Loans
F) Non-occupant Loans on < 5 Family Dwellings (A B C & D)
G) Loans On Manufactured Home Dwelling (A B C & D)
Number
Average Value
Number
Average Value
Number
Average Value
Number
Average Value
Number
Average Value
Number
Average Value
LOANS ORIGINATED
17
$103,431
103
$73,682
76
$86,776
24
$88,916
15
$57,558
23
$61,353
APPLICATIONS APPROVED, NOT ACCEPTED
3
$79,113
6
$56,483
20
$75,417
6
$36,427
2
$69,170
5
$41,300
APPLICATIONS DENIED
2
$63,310
46
$73,576
79
$96,870
23
$26,031
5
$49,798
24
$61,472
APPLICATIONS WITHDRAWN
1
$99,910
15
$140,101
44
$105,989
15
$133,021
5
$208,272
0
$0
FILES CLOSED FOR INCOMPLETENESS
1
$47,590
1
$58,640
14
$125,493
0
$0
0
$0
0
$0
Aggregated Statistics For Year 2004 (Based on 4 partial tracts)
A) FHA, FSA/RHS & VA Home Purchase Loans
B) Conventional Home Purchase Loans
C) Refinancings
D) Home Improvement Loans
F) Non-occupant Loans on < 5 Family Dwellings (A B C & D)
G) Loans On Manufactured Home Dwelling (A B C & D)
Number
Average Value
Number
Average Value
Number
Average Value
Number
Average Value
Number
Average Value
Number
Average Value
LOANS ORIGINATED
14
$89,549
62
$82,742
101
$95,074
32
$39,765
20
$56,288
23
$56,109
APPLICATIONS APPROVED, NOT ACCEPTED
2
$86,540
10
$73,536
14
$74,533
3
$19,830
0
$0
9
$47,470
APPLICATIONS DENIED
6
$76,092
34
$91,835
77
$77,415
34
$35,274
3
$94,413
23
$48,401
APPLICATIONS WITHDRAWN
0
$0
14
$77,460
52
$98,590
4
$34,052
3
$82,713
5
$60,900
FILES CLOSED FOR INCOMPLETENESS
0
$0
4
$106,905
18
$103,389
0
$0
0
$0
1
$61,190
Aggregated Statistics For Year 2003 (Based on 4 partial tracts)
A) FHA, FSA/RHS & VA Home Purchase Loans
B) Conventional Home Purchase Loans
C) Refinancings
D) Home Improvement Loans
F) Non-occupant Loans on < 5 Family Dwellings (A B C & D)
Number
Average Value
Number
Average Value
Number
Average Value
Number
Average Value
Number
Average Value
LOANS ORIGINATED
16
$76,682
94
$74,023
175
$95,144
19
$25,273
16
$48,010
APPLICATIONS APPROVED, NOT ACCEPTED
0
$0
35
$54,025
22
$104,385
8
$31,362
1
$22,810
APPLICATIONS DENIED
8
$58,105
75
$58,911
90
$92,343
15
$26,903
2
$60,815
APPLICATIONS WITHDRAWN
4
$69,025
8
$104,606
66
$92,617
1
$76,480
1
$48,440
FILES CLOSED FOR INCOMPLETENESS
0
$0
3
$232,973
10
$109,831
2
$23,655
0
$0
Aggregated Statistics For Year 1999 (Based on 1 partial tract)
A) FHA, FSA/RHS & VA Home Purchase Loans
B) Conventional Home Purchase Loans
C) Refinancings
D) Home Improvement Loans
F) Non-occupant Loans on < 5 Family Dwellings (A B C & D)
Detailed PMIC statistics for the following Tracts:0001.01
, 0001.02
2002 - 2018 National Fire Incident Reporting System (NFIRS) incidents
Based on the data from the years 2002 - 2018 the average number of fires per year is 40. The highest number of reported fire incidents - 78 took place in 2018, and the least - 14 in 2010. The data has an increasing trend.
When looking into fire subcategories, the most incidents belonged to: Outside Fires (65.7%), and Structure Fires (20.7%).
Fire incident types reported to NFIRS in Zip Code 75414


 Nearest zip codes: 75479, 75021, 75489, 75090, 75491, 75439.


 Based on the data from the years 2002 - 2018 the average number of fires per year is 40. The highest number of reported fire incidents - 78 took place in 2018, and the least - 14 in 2010. The data has an increasing trend.
 When looking into fire subcategories, the most incidents belonged to: Outside Fires (65.7%), and Structure Fires (20.7%).