Estimated zip code population in 2022: 2,942 Zip code population in 2010: 2,893 Zip code population in 2000: 2,821
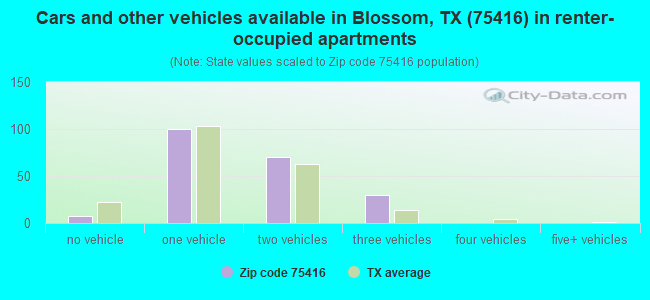
Houses and condos: 1,340 Renter-occupied apartments: 208
% of renters here:
17%
State:
38%
March 2022 cost of living index in zip code 75416: 78.6 (low, U.S. average is 100)
Land area: 74.0 sq. mi. Water area: 0.7 sq. mi.
Population density: 40 people per square mile
(very low).
OSM Map
General Map
Google Map
MSN Map
OSM Map
General Map
Google Map
MSN Map
OSM Map
General Map
Google Map
MSN Map
OSM Map
General Map
Google Map
MSN Map
Please wait while loading the map...
Real estate property taxes paid for housing units in 2022:
This zip code:
0.9% ($1,418)
Texas:
1.5% ($4,050)
Median real estate property taxes paid for housing units with mortgages in 2022: $1,528 (0.9%) Median real estate property taxes paid for housing units with no mortgage in 2022: $1,284 (0.8%)
Business Search- 14 Million verified businesses
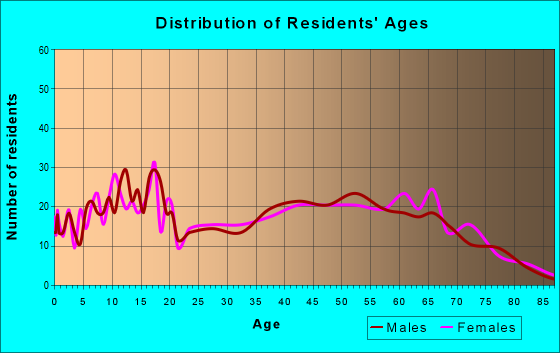
Males: 1,535
(52.2%)
Females: 1,406
(47.8%)
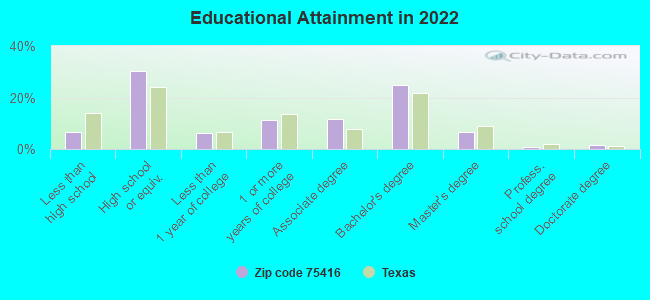
For population 25 years and over in 75416:
High school or higher: 93.4%
Bachelor's degree or higher: 33.8%
Graduate or professional degree: 8.9%
Unemployed: 1.0%
Mean travel time to work (commute): 24.5 minutes
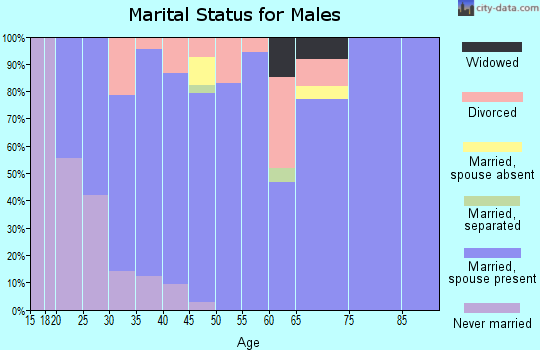
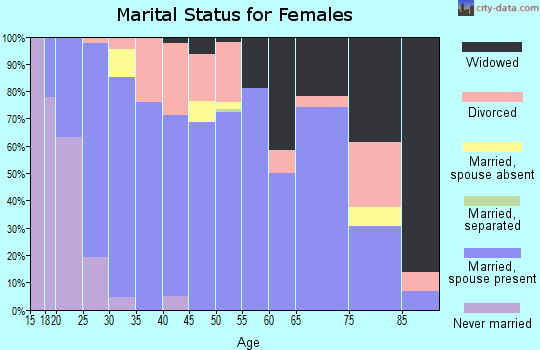
For population 15 years and over in 75416:
Never married: 19.4%
Now married: 62.9%
Separated: 0.4%
Widowed: 5.8%
Divorced: 11.5%
Zip code 75416 compared to state average:
Median house value below state average.
Unemployed percentage significantly below state average.
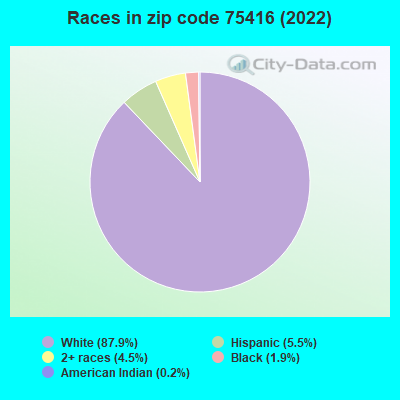
Black race population percentage significantly below state average.
Hispanic race population percentage significantly below state average.
Median age above state average.
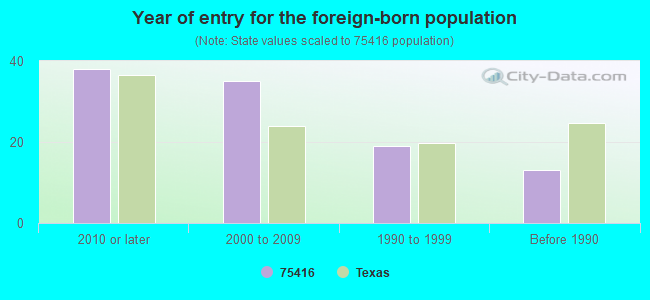
Foreign-born population percentage significantly below state average.
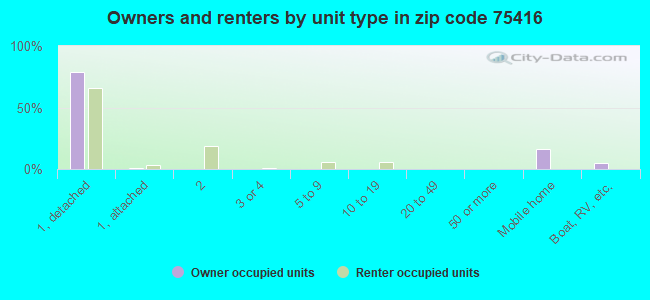
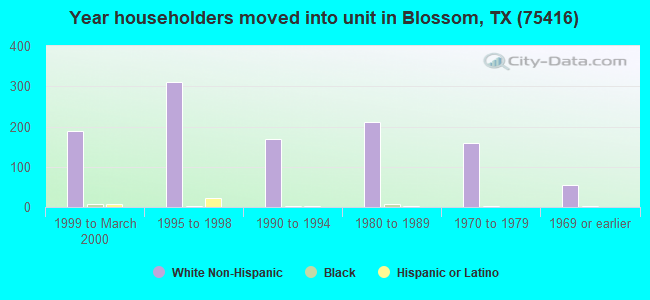
Renting percentage below state average.
Length of stay since moving in significantly above state average.
Averages for the 2020 tax year for zip code 75416, filed in 2021:
Average Adjusted Gross Income (AGI) in 2020: $51,393 (Individual Income Tax Returns)
Here:
$51,393
State:
$77,054
Salary/wage: $49,806 (reported on 80.3% of returns)
Here:
$49,806
State:
$62,766
(% of AGI for various income ranges: 1261.2% for AGIs below $25k, 3722.6% for AGIs $25k-50k, 6398.2% for AGIs $50k-75k, 9668.0% for AGIs $75k-100k, 18162.0% for AGIs $100k-200k)
Taxable interest for individuals: $820 (reported on 26.5% of returns)
This zip code:
$820
Texas:
$2,665
(% of AGI for various income ranges: 16.9% for AGIs below $25k, 12.6% for AGIs $25k-50k, 58.2% for AGIs $50k-75k, 35.0% for AGIs $75k-100k, 65.0% for AGIs $100k-200k)
Ordinary dividends: $2,073 (reported on 8.3% of returns)
Here:
$2,073
State:
$10,044
(% of AGI for various income ranges: 7.5% for AGIs below $25k, 30.7% for AGIs $25k-50k, 45.9% for AGIs $50k-75k, 43.0% for AGIs $100k-200k)
Net capital gain/loss in AGI: +$9,943 (reported on 10.6% of returns)
Here:
+$9,943
State:
+$39,590
(% of AGI for various income ranges: 11.6% for AGIs below $25k, 49.6% for AGIs $25k-50k, 114.7% for AGIs $50k-75k, 143.0% for AGIs $75k-100k, 883.0% for AGIs $100k-200k)
Profit/loss from business: +$7,600 (reported on 22.7% of returns)
Here:
+$7,600
State:
+$10,888
(% of AGI for various income ranges: 129.1% for AGIs below $25k, 160.4% for AGIs $25k-50k, 472.4% for AGIs $50k-75k, 90.0% for AGIs $75k-100k, 541.0% for AGIs $100k-200k)
Taxable individual retirement arrangement distribution: $14,112 (reported on 6.1% of returns)
75416:
$14,112
Texas:
$24,740
(% of AGI for various income ranges: 123.4% for AGIs below $25k, 167.1% for AGIs $50k-75k, 450.0% for AGIs $75k-100k)
Total itemized deductions: $31,000 (reported on 2.3% of returns)
Here:
$31,000
State:
$40,428
(% of AGI for various income ranges: 344.4% for AGIs $25k-50k)
Taxes paid: $6,250 (reported on 1.5% of returns)
75416:
$6,250
State:
$7,821
(% of AGI for various income ranges: 46.3% for AGIs $25k-50k)
Earned income credit: $2,435 (reported on 19.7% of returns)
Here:
$2,435
State:
$2,584
(% of AGI for various income ranges: 129.4% for AGIs below $25k, 81.1% for AGIs $25k-50k)
Percentage of individuals using paid preparers for their 2020 taxes: 93.9%
Here:
94%
State:
92%
(% for various income ranges: 93.3% for AGIs below $25k, 94.1% for AGIs $25k-50k, 95.7% for AGIs $50k-75k, 92.9% for AGIs $75k-100k, 93.8% for AGIs $100k-200k)
Averages for the 2012 tax year for zip code 75416, filed in 2013:
Average Adjusted Gross Income (AGI) in 2012: $43,902 (Individual Income Tax Returns)
Here:
$43,902
State:
$65,384
Salary/wage: $40,662 (reported on 81.0% of returns)
Here:
$40,662
State:
$52,524
(% of AGI for various income ranges: 70.6% for AGIs below $25k, 80.6% for AGIs $25k-50k, 77.0% for AGIs $50k-75k, 82.7% for AGIs $75k-100k, 66.3% for AGIs $100k-200k)
Taxable interest for individuals: $1,016 (reported on 26.4% of returns)
This zip code:
$1,016
Texas:
$2,372
(% of AGI for various income ranges: 1.0% for AGIs below $25k, 0.9% for AGIs $25k-50k, 0.7% for AGIs $50k-75k, 0.3% for AGIs $75k-100k, 0.3% for AGIs $100k-200k)
Ordinary dividends: $1,320 (reported on 8.3% of returns)
Here:
$1,320
State:
$9,721
(% of AGI for various income ranges: 0.3% for AGIs below $25k, 0.6% for AGIs $25k-50k, 0.5% for AGIs $75k-100k)
Net capital gain/loss in AGI: +$13,262 (reported on 6.6% of returns)
Here:
+$13,262
State:
+$35,319
(% of AGI for various income ranges: 1.2% for AGIs $25k-50k, 0.5% for AGIs $50k-75k, 6.0% for AGIs $100k-200k)
Profit/loss from business: +$8,952 (reported on 20.7% of returns)
Here:
+$8,952
State:
+$13,732
(% of AGI for various income ranges: 12.5% for AGIs below $25k, 3.9% for AGIs $25k-50k, 5.6% for AGIs $50k-75k, 2.0% for AGIs $100k-200k)
Taxable individual retirement arrangement distribution: $14,544 (reported on 7.4% of returns)
75416:
$14,544
Texas:
$19,511
(% of AGI for various income ranges: 2.6% for AGIs below $25k, 2.0% for AGIs $25k-50k, 2.4% for AGIs $50k-75k, 7.4% for AGIs $75k-100k)
Total itemized deductions: $20,388 (23% of AGI, reported on 14.0% of returns)
Here:
$20,388
State:
$24,724
Here:
22.6% of AGI
State:
15.9% of AGI
(% of AGI for various income ranges: 4.8% for AGIs below $25k, 4.2% for AGIs $25k-50k, 8.0% for AGIs $50k-75k, 7.0% for AGIs $75k-100k, 7.6% for AGIs $100k-200k)
Charity contributions: $4,767 (reported on 9.9% of returns)
Here:
$4,767
State:
$6,808
(% of AGI for various income ranges: 0.9% for AGIs $25k-50k, 1.3% for AGIs $50k-75k, 1.1% for AGIs $75k-100k, 1.5% for AGIs $100k-200k)
Taxes paid: $3,253 (reported on 14.0% of returns)
75416:
$3,253
State:
$6,921
(% of AGI for various income ranges: 0.5% for AGIs below $25k, 0.6% for AGIs $25k-50k, 1.2% for AGIs $50k-75k, 1.0% for AGIs $75k-100k, 1.6% for AGIs $100k-200k)
Earned income credit: $2,569 (reported on 24.0% of returns)
Here:
$2,569
State:
$2,570
(% of AGI for various income ranges: 8.7% for AGIs below $25k, 1.6% for AGIs $25k-50k)
Percentage of individuals using paid preparers for their 2012 taxes: 61.2%
Here:
61%
State:
51%
(% for various income ranges: 59.2% for AGIs below $25k, 57.6% for AGIs $25k-50k, 65.0% for AGIs $50k-75k, 66.7% for AGIs $75k-100k, 70.0% for AGIs $100k-200k)
Averages for the 2004 tax year for zip code 75416, filed in 2005:
Average Adjusted Gross Income (AGI) in 2004: $31,691 (Individual Income Tax Returns)
Here:
$31,691
State:
$47,881
Salary/wage: $31,262 (reported on 81.4% of returns)
Here:
$31,262
State:
$41,947
(% of AGI for various income ranges: 123.4% for AGIs below $10k, 74.9% for AGIs $10k-25k, 83.4% for AGIs $25k-50k, 87.0% for AGIs $50k-75k, 79.2% for AGIs $75k-100k, 56.7% for AGIs over 100k)
Taxable interest for individuals: $1,285 (reported on 34.1% of returns)
This zip code:
$1,285
Texas:
$2,255
(% of AGI for various income ranges: 9.4% for AGIs below $10k, 1.8% for AGIs $10k-25k, 0.8% for AGIs $25k-50k, 1.1% for AGIs $50k-75k, 1.1% for AGIs $75k-100k, 1.8% for AGIs over 100k)
Taxable dividends: $1,065 (reported on 10.8% of returns)
Here:
$1,065
State:
$4,261
(% of AGI for various income ranges: 0.9% for AGIs below $10k, 0.6% for AGIs $10k-25k, 0.1% for AGIs $25k-50k, 0.3% for AGIs $50k-75k, 0.9% for AGIs $75k-100k)
Net capital gain/loss: +$3,309 (reported on 14.1% of returns)
Here:
+$3,309
State:
+$16,110
(% of AGI for various income ranges: 1.2% for AGIs below $10k, 1.7% for AGIs $10k-25k, 0.3% for AGIs $25k-50k, 0.3% for AGIs $50k-75k, 5.8% for AGIs $75k-100k, 1.8% for AGIs over 100k)
Profit/loss from business: +$7,704 (reported on 23.2% of returns)
Here:
+$7,704
State:
+$11,013
(% of AGI for various income ranges: 10.5% for AGIs below $10k, 10.7% for AGIs $10k-25k, 3.2% for AGIs $25k-50k, 1.5% for AGIs $50k-75k, 16.9% for AGIs $75k-100k)
IRA payment deduction: $2,312 (reported on 1.4% of returns)
75416:
$2,312
Texas:
$3,120
Total itemized deductions: $15,201 (27% of AGI, reported on 12.9% of returns)
Here:
$15,201
State:
$19,631
Here:
27.3% of AGI
State:
18.9% of AGI
(% of AGI for various income ranges: 6.9% for AGIs $10k-25k, 5.4% for AGIs $25k-50k, 5.8% for AGIs $50k-75k, 7.4% for AGIs $75k-100k, 8.2% for AGIs over 100k)
Charity contributions deductions: $3,882 (6% of AGI, reported on 9.5% of returns)
Here:
$3,882
State:
$4,753
Here:
6.4% of AGI
State:
4.2% of AGI
(% of AGI for various income ranges: 0.8% for AGIs $10k-25k, 1.0% for AGIs $25k-50k, 0.9% for AGIs $50k-75k, 2.0% for AGIs $75k-100k, 2.3% for AGIs over 100k)
Total tax: $3,656 (reported on 70.3% of returns)
75416:
$3,656
State:
$9,058
(% of AGI for various income ranges: 6.0% for AGIs below $10k, 3.9% for AGIs $10k-25k, 5.6% for AGIs $25k-50k, 8.5% for AGIs $50k-75k, 10.7% for AGIs $75k-100k, 18.0% for AGIs over 100k)
Earned income credit: $2,043 (reported on 24.1% of returns)
Here:
$2,043
State:
$2,024
Percentage of individuals using paid preparers for their 2004 taxes: 72.6%
Here:
73%
State:
57%
(% for various income ranges: 65.8% for AGIs below $10k, 72.5% for AGIs $10k-25k, 76.7% for AGIs $25k-50k, 72.8% for AGIs $50k-75k, 71.9% for AGIs $75k-100k, 85.2% for AGIs over 100k)
Household received Food Stamps/SNAP in the past 12 months: 80 Household did not receive Food Stamps/SNAP in the past 12 months: 1,165
Women who had a birth in the past 12 months: 32 (15 now married, 15 unmarried) Women who did not have a birth in the past 12 months: 447 (287 now married, 156 unmarried)
Housing units in zip code 75416 with a mortgage: 420 (8 second mortgage, 9 both second mortgage and home equity loan) Median monthly owner costs for units with a mortgage: $1,110 Median monthly owner costs for units without a mortgage: $507
Residents with income below the poverty level in 2022:
This zip code:
8.6%
Whole state:
14.0%
Residents with income below 50% of the poverty level in 2022:
This zip code:
4.2%
Whole state:
7.4%
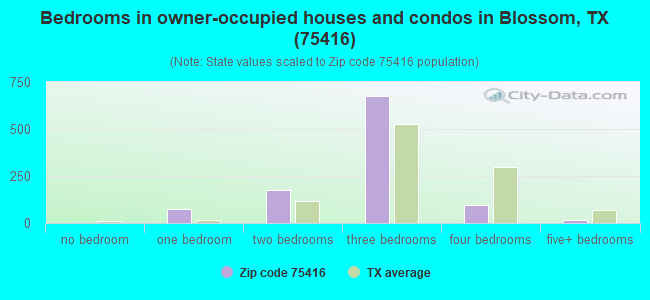
Median number of rooms in houses and condos:
Here:
6.4
State:
6.3
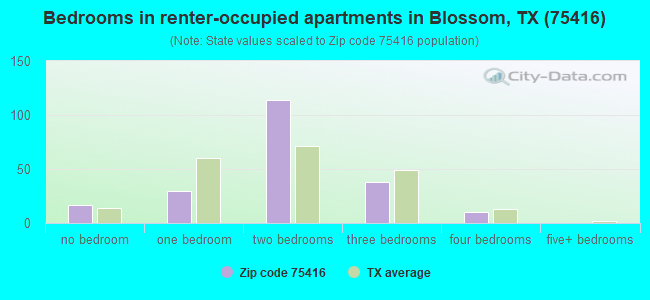
Median number of rooms in apartments:
Here:
4.5
State:
4.0
Notable locations in this zip code not listed on our city pages
Cemeteries: Red Oak Cemetery (1), Egypt Cemetery (2), Knights of Honor Cemetery (3), Holt Cemetery (4), Wrights Chapel Cemetery (5). Display/hide their locations on the map
Size of family households: 502 2-persons, 69 3-persons, 93 4-persons, 105 5-persons, 62 6-persons, 9 7-or-more-persons
Size of nonfamily households: 375 1-person, 33 2-persons
479 married couples with children.
111 single-parent households (76 men, 35 women).
96.8% of residents of 75416 zip code speak English at home.
2.4% of residents speak Spanish at home (93% very well, 3% not well, 4% not at all).
1.2% of residents speak other Indo-European language at home (100% very well).
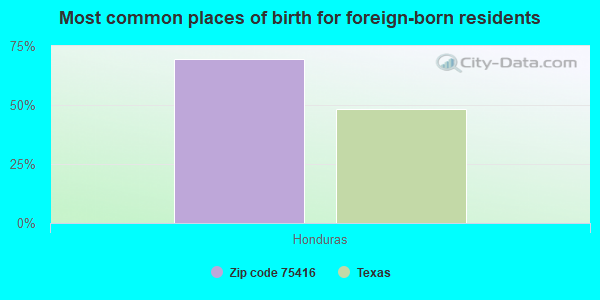
Foreign born population: 32 (1.1%) (27.0% of them are naturalized citizens)
This zip code:
1.1%
Whole state:
17.2%
70%Honduras
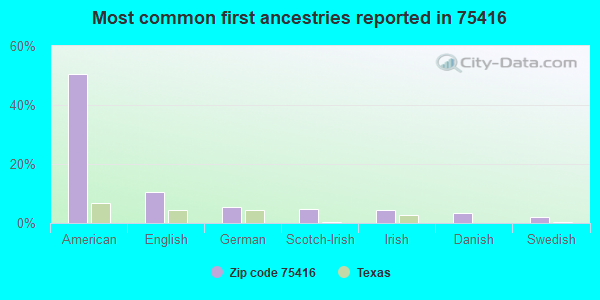
50%American
11%English
5%German
5%Scotch-Irish
4%Irish
3%Danish
2%Swedish
Year of entry for the foreign-born population
382010 or later
352000 to 2009
191990 to 1999
13Before 1990
Housing units lacking complete plumbing facilities: 3.0% Housing units lacking complete kitchen facilities: 1.0%
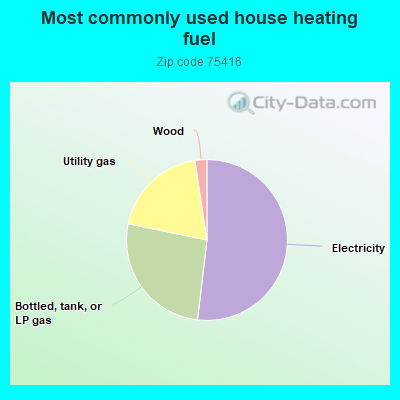
52.0%Electricity
26.4%Bottled, tank, or LP gas
19.4%Utility gas
2.4%Wood
Population in 1990: 3,253.
Place of birth for U.S.-born residents:
This state: 2,052
Northeast: 96
Midwest: 107
South: 296
West: 278
56% of the 75416 zip code residents lived in the same house 5 years ago. Out of people who lived in different houses, 67% lived in this county. Out of people who lived in different counties, 50% lived in Texas.
94% of the 75416 zip code residents lived in the same house 1 year ago. Out of people who lived in different houses, 74% moved from this county. Out of people who lived in different houses, 21% moved from different county within same state. Out of people who lived in different houses, 2% moved from abroad.
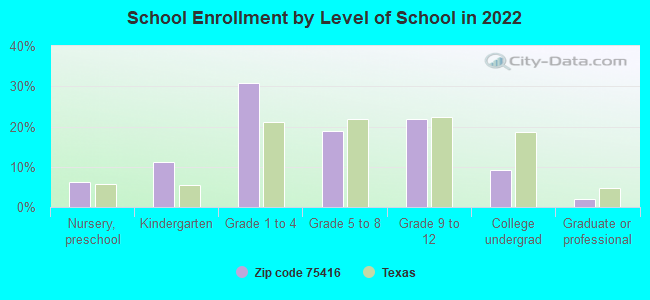
Private vs. public school enrollment:
Students in private schools in grades 1 to 8 (elementary and middle school): 61
Here:
19.1%
Texas:
8.8%
Students in private schools in grades 9 to 12 (high school): 6
Here:
4.6%
Texas:
8.0%
Students in private undergraduate colleges: 2
Here:
4.9%
Texas:
16.2%
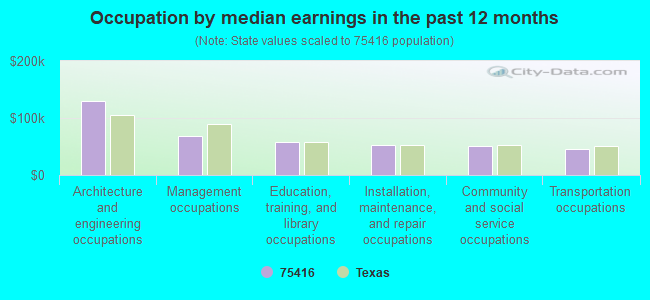
Occupation by median earnings in the past 12 months ($)
129,608Architecture and engineering occupations
68,294Management occupations
58,557Education, training, and library occupations
52,030Installation, maintenance, and repair occupations
50,772Community and social service occupations
46,364Transportation occupations
Companies with federal contracts located in this zip code:
LES CHAPMAN TRANSPORT, INC (U S HWY 82 EAST 3 1/2 MIL in BLOSSOM, TX; small business)
$4,188 with Army for Motor Freight. Taking place in NC. Signed on 2003-06-05. Completion date: 2003-06-27.
Top industries in this zip code by the number of employees in 2005:
Health Care and Social Assistance: Child Day Care Services (5-9: 1)
Other Services (except Public Administration): Business Associations (5-9: 1)
Construction: Electrical Contractors (1-4: 2)
Other Services (except Public Administration): Religious Organizations (1-4: 2)
Fatal accident statistics in 2014:
Fatal accident count: 1
Vehicles involved in fatal accidents: 1
Fatal accidents caused by drunken drivers: 0
Fatalities: 1
Persons involved in fatal accidents: 3
Pedestrians involved in fatal accidents: 0
Fatal accident statistics in 2011:
Fatal accident count: 3
Vehicles involved in fatal accidents: 3
Fatal accidents caused by drunken drivers: 2
Fatalities: 4
Persons involved in fatal accidents: 7
Pedestrians involved in fatal accidents: 0
2003 - 2018 National Fire Incident Reporting System (NFIRS) incidents
According to the data from the years 2003 - 2018 the average number of fires per year is 44. The highest number of reported fire incidents - 110 took place in 2006, and the least - 9 in 2003. The data has an increasing trend.
When looking into fire subcategories, the most reports belonged to: Outside Fires (53.7%), and Structure Fires (39.5%).
Fire incident types reported to NFIRS in Zip Code 75416
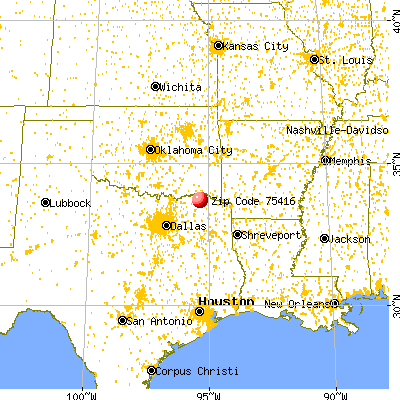


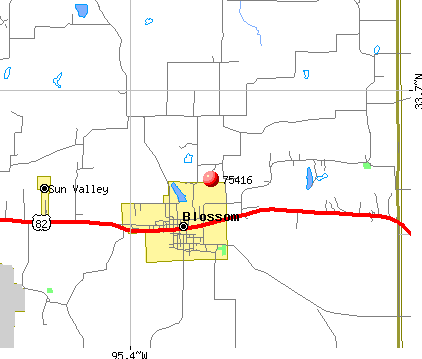 Nearest zip codes: 75436, 75462, 75468, 75473, 75435, 75412.
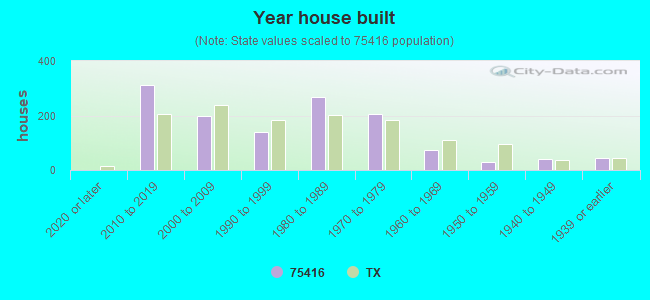


 According to the data from the years 2003 - 2018 the average number of fires per year is 44. The highest number of reported fire incidents - 110 took place in 2006, and the least - 9 in 2003. The data has an increasing trend.
 When looking into fire subcategories, the most reports belonged to: Outside Fires (53.7%), and Structure Fires (39.5%).