Estimated zip code population in 2022: 8,065 Zip code population in 2010: 7,219 Zip code population in 2000: 6,566
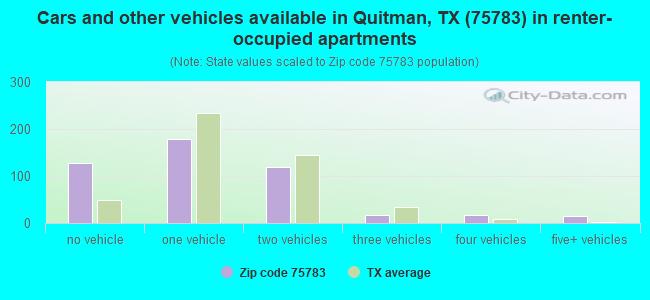
Houses and condos: 4,091 Renter-occupied apartments: 472
% of renters here:
14%
State:
38%
March 2022 cost of living index in zip code 75783: 79.7 (low, U.S. average is 100)
Land area: 121.8 sq. mi. Water area: 8.8 sq. mi.
Population density: 66 people per square mile
(very low).
OSM Map
General Map
Google Map
MSN Map
OSM Map
General Map
Google Map
MSN Map
OSM Map
General Map
Google Map
MSN Map
OSM Map
General Map
Google Map
MSN Map
Please wait while loading the map...
Real estate property taxes paid for housing units in 2022:
This zip code:
0.9% ($1,640)
Texas:
1.5% ($4,050)
Median real estate property taxes paid for housing units with mortgages in 2022: $1,963 (0.9%) Median real estate property taxes paid for housing units with no mortgage in 2022: $1,191 (0.8%)
Averages for the 2020 tax year for zip code 75783, filed in 2021:
Average Adjusted Gross Income (AGI) in 2020: $55,944 (Individual Income Tax Returns)
Here:
$55,944
State:
$77,054
Salary/wage: $45,811 (reported on 72.8% of returns)
Here:
$45,811
State:
$62,766
(% of AGI for various income ranges: 1134.8% for AGIs below $25k, 3145.7% for AGIs $25k-50k, 5636.6% for AGIs $50k-75k, 7999.1% for AGIs $75k-100k, 14098.6% for AGIs $100k-200k, 67495.0% for AGIs over 200k)
Taxable interest for individuals: $1,677 (reported on 31.2% of returns)
This zip code:
$1,677
Texas:
$2,665
(% of AGI for various income ranges: 20.3% for AGIs below $25k, 34.6% for AGIs $25k-50k, 100.0% for AGIs $50k-75k, 63.0% for AGIs $75k-100k, 213.6% for AGIs $100k-200k, 2100.0% for AGIs over 200k)
Ordinary dividends: $6,302 (reported on 14.0% of returns)
Here:
$6,302
State:
$10,044
(% of AGI for various income ranges: 17.2% for AGIs below $25k, 33.8% for AGIs $25k-50k, 73.7% for AGIs $50k-75k, 92.2% for AGIs $75k-100k, 495.5% for AGIs $100k-200k, 5600.0% for AGIs over 200k)
Net capital gain/loss in AGI: +$13,967 (reported on 14.0% of returns)
Here:
+$13,967
State:
+$39,590
(% of AGI for various income ranges: 9.0% for AGIs below $25k, 49.9% for AGIs $25k-50k, 167.7% for AGIs $50k-75k, 231.7% for AGIs $75k-100k, 831.4% for AGIs $100k-200k, 17215.0% for AGIs over 200k)
Profit/loss from business: +$10,718 (reported on 18.9% of returns)
Here:
+$10,718
State:
+$10,888
(% of AGI for various income ranges: 110.4% for AGIs below $25k, 157.7% for AGIs $25k-50k, 296.0% for AGIs $50k-75k, 422.2% for AGIs $75k-100k, 695.9% for AGIs $100k-200k, 6765.0% for AGIs over 200k)
Taxable individual retirement arrangement distribution: $21,811 (reported on 10.9% of returns)
75783:
$21,811
Texas:
$24,740
(% of AGI for various income ranges: 63.0% for AGIs below $25k, 150.0% for AGIs $25k-50k, 365.7% for AGIs $50k-75k, 473.0% for AGIs $75k-100k, 1245.0% for AGIs $100k-200k, 7455.0% for AGIs over 200k)
Total itemized deductions: $32,113 (reported on 4.3% of returns)
Here:
$32,113
State:
$40,428
(% of AGI for various income ranges: 122.0% for AGIs $25k-50k, 353.7% for AGIs $50k-75k, 835.5% for AGIs $100k-200k, 4190.0% for AGIs over 200k)
Charity contributions: $12,836 (reported on 3.2% of returns)
Here:
$12,836
State:
$18,201
(% of AGI for various income ranges: 11.1% for AGIs below $25k, 86.9% for AGIs $50k-75k, 457.3% for AGIs $100k-200k)
Taxes paid: $6,093 (reported on 4.0% of returns)
75783:
$6,093
State:
$7,821
(% of AGI for various income ranges: 18.5% for AGIs $25k-50k, 44.6% for AGIs $50k-75k, 165.0% for AGIs $100k-200k, 985.0% for AGIs over 200k)
Earned income credit: $2,321 (reported on 19.5% of returns)
Here:
$2,321
State:
$2,584
(% of AGI for various income ranges: 108.7% for AGIs below $25k, 78.1% for AGIs $25k-50k)
Percentage of individuals using paid preparers for their 2020 taxes: 93.1%
Here:
93%
State:
92%
(% for various income ranges: 89.9% for AGIs below $25k, 94.4% for AGIs $25k-50k, 94.0% for AGIs $50k-75k, 96.9% for AGIs $75k-100k, 97.4% for AGIs $100k-200k, 88.9% for AGIs over 200k)
Averages for the 2012 tax year for zip code 75783, filed in 2013:
Average Adjusted Gross Income (AGI) in 2012: $48,884 (Individual Income Tax Returns)
Here:
$48,884
State:
$65,384
Salary/wage: $41,237 (reported on 72.9% of returns)
Here:
$41,237
State:
$52,524
(% of AGI for various income ranges: 67.1% for AGIs below $25k, 68.4% for AGIs $25k-50k, 65.0% for AGIs $50k-75k, 68.1% for AGIs $75k-100k, 63.3% for AGIs $100k-200k, 36.2% for AGIs over 200k)
Taxable interest for individuals: $1,465 (reported on 37.8% of returns)
This zip code:
$1,465
Texas:
$2,372
(% of AGI for various income ranges: 1.9% for AGIs below $25k, 0.9% for AGIs $25k-50k, 1.0% for AGIs $50k-75k, 1.1% for AGIs $75k-100k, 1.4% for AGIs $100k-200k, 0.6% for AGIs over 200k)
Ordinary dividends: $3,846 (reported on 16.1% of returns)
Here:
$3,846
State:
$9,721
(% of AGI for various income ranges: 1.4% for AGIs below $25k, 0.6% for AGIs $25k-50k, 1.2% for AGIs $50k-75k, 1.2% for AGIs $75k-100k, 1.6% for AGIs $100k-200k, 1.5% for AGIs over 200k)
Net capital gain/loss in AGI: +$2,495 (reported on 13.0% of returns)
Here:
+$2,495
State:
+$35,319
(% of AGI for various income ranges: 0.9% for AGIs $50k-75k, 1.1% for AGIs $75k-100k, 1.3% for AGIs $100k-200k, 0.7% for AGIs over 200k)
Profit/loss from business: +$12,017 (reported on 21.4% of returns)
Here:
+$12,017
State:
+$13,732
(% of AGI for various income ranges: 12.4% for AGIs below $25k, 3.4% for AGIs $25k-50k, 3.7% for AGIs $50k-75k, 3.6% for AGIs $75k-100k, 9.8% for AGIs $100k-200k)
Taxable individual retirement arrangement distribution: $15,505 (reported on 13.7% of returns)
75783:
$15,505
Texas:
$19,511
(% of AGI for various income ranges: 4.4% for AGIs below $25k, 5.0% for AGIs $25k-50k, 3.7% for AGIs $50k-75k, 3.4% for AGIs $75k-100k, 8.2% for AGIs $100k-200k)
Total itemized deductions: $20,119 (23% of AGI, reported on 19.7% of returns)
Here:
$20,119
State:
$24,724
Here:
22.7% of AGI
State:
15.9% of AGI
(% of AGI for various income ranges: 10.3% for AGIs below $25k, 7.3% for AGIs $25k-50k, 8.1% for AGIs $50k-75k, 7.6% for AGIs $75k-100k, 11.0% for AGIs $100k-200k, 4.2% for AGIs over 200k)
Charity contributions: $5,426 (reported on 14.0% of returns)
Here:
$5,426
State:
$6,808
(% of AGI for various income ranges: 0.8% for AGIs below $25k, 0.8% for AGIs $25k-50k, 1.4% for AGIs $50k-75k, 1.6% for AGIs $75k-100k, 2.8% for AGIs $100k-200k, 1.4% for AGIs over 200k)
Taxes paid: $3,764 (reported on 19.7% of returns)
75783:
$3,764
State:
$6,921
(% of AGI for various income ranges: 1.3% for AGIs below $25k, 1.0% for AGIs $25k-50k, 1.4% for AGIs $50k-75k, 1.4% for AGIs $75k-100k, 2.5% for AGIs $100k-200k, 1.3% for AGIs over 200k)
Earned income credit: $2,281 (reported on 20.7% of returns)
Here:
$2,281
State:
$2,570
(% of AGI for various income ranges: 7.1% for AGIs below $25k, 1.2% for AGIs $25k-50k)
Percentage of individuals using paid preparers for their 2012 taxes: 60.5%
Here:
61%
State:
51%
(% for various income ranges: 56.8% for AGIs below $25k, 58.9% for AGIs $25k-50k, 63.0% for AGIs $50k-75k, 65.4% for AGIs $75k-100k, 70.8% for AGIs $100k-200k, 80.0% for AGIs over 200k)
Averages for the 2004 tax year for zip code 75783, filed in 2005:
Average Adjusted Gross Income (AGI) in 2004: $36,188 (Individual Income Tax Returns)
Here:
$36,188
State:
$47,881
Salary/wage: $31,086 (reported on 74.5% of returns)
Here:
$31,086
State:
$41,947
(% of AGI for various income ranges: 108.3% for AGIs below $10k, 66.6% for AGIs $10k-25k, 68.9% for AGIs $25k-50k, 72.4% for AGIs $50k-75k, 61.1% for AGIs $75k-100k, 46.3% for AGIs over 100k)
Taxable interest for individuals: $2,148 (reported on 42.5% of returns)
This zip code:
$2,148
Texas:
$2,255
(% of AGI for various income ranges: 7.5% for AGIs below $10k, 4.1% for AGIs $10k-25k, 2.3% for AGIs $25k-50k, 1.5% for AGIs $50k-75k, 2.6% for AGIs $75k-100k, 2.4% for AGIs over 100k)
Taxable dividends: $2,351 (reported on 17.3% of returns)
Here:
$2,351
State:
$4,261
(% of AGI for various income ranges: 2.2% for AGIs below $10k, 1.4% for AGIs $10k-25k, 0.8% for AGIs $25k-50k, 0.8% for AGIs $50k-75k, 1.5% for AGIs $75k-100k, 1.3% for AGIs over 100k)
Net capital gain/loss: +$5,450 (reported on 16.1% of returns)
Here:
+$5,450
State:
+$16,110
(% of AGI for various income ranges: -0.3% for AGIs below $10k, 0.7% for AGIs $10k-25k, 1.3% for AGIs $25k-50k, 1.0% for AGIs $50k-75k, 4.0% for AGIs $75k-100k, 5.4% for AGIs over 100k)
Profit/loss from business: +$10,339 (reported on 22.2% of returns)
Here:
+$10,339
State:
+$11,013
(% of AGI for various income ranges: 15.9% for AGIs below $10k, 8.5% for AGIs $10k-25k, 4.5% for AGIs $25k-50k, 2.9% for AGIs $50k-75k, 3.4% for AGIs $75k-100k, 11.8% for AGIs over 100k)
IRA payment deduction: $3,333 (reported on 3.1% of returns)
75783:
$3,333
Texas:
$3,120
(% of AGI for various income ranges: 0.2% for AGIs $10k-25k, 0.2% for AGIs $25k-50k, 0.2% for AGIs $50k-75k, 0.3% for AGIs $75k-100k, 0.5% for AGIs over 100k)
Total itemized deductions: $17,027 (24% of AGI, reported on 18.3% of returns)
Here:
$17,027
State:
$19,631
Here:
24.2% of AGI
State:
18.9% of AGI
(% of AGI for various income ranges: 15.2% for AGIs below $10k, 6.7% for AGIs $10k-25k, 7.4% for AGIs $25k-50k, 8.3% for AGIs $50k-75k, 9.3% for AGIs $75k-100k, 10.4% for AGIs over 100k)
Charity contributions deductions: $4,550 (6% of AGI, reported on 14.8% of returns)
Here:
$4,550
State:
$4,753
Here:
6.0% of AGI
State:
4.2% of AGI
(% of AGI for various income ranges: 0.6% for AGIs below $10k, 0.6% for AGIs $10k-25k, 1.4% for AGIs $25k-50k, 1.5% for AGIs $50k-75k, 2.2% for AGIs $75k-100k, 3.3% for AGIs over 100k)
Total tax: $5,086 (reported on 72.3% of returns)
75783:
$5,086
State:
$9,058
(% of AGI for various income ranges: 4.1% for AGIs below $10k, 4.0% for AGIs $10k-25k, 6.5% for AGIs $25k-50k, 8.9% for AGIs $50k-75k, 11.6% for AGIs $75k-100k, 18.6% for AGIs over 100k)
Earned income credit: $1,812 (reported on 20.1% of returns)
Here:
$1,812
State:
$2,024
Percentage of individuals using paid preparers for their 2004 taxes: 66.9%
Here:
67%
State:
57%
(% for various income ranges: 62.3% for AGIs below $10k, 66.8% for AGIs $10k-25k, 66.0% for AGIs $25k-50k, 70.9% for AGIs $50k-75k, 70.3% for AGIs $75k-100k, 75.9% for AGIs over 100k)
Household received Food Stamps/SNAP in the past 12 months: 346 Household did not receive Food Stamps/SNAP in the past 12 months: 3,039
Women who had a birth in the past 12 months: 26 (27 now married, 0 unmarried) Women who did not have a birth in the past 12 months: 1,353 (603 now married, 750 unmarried)
Housing units in zip code 75783 with a mortgage: 1,242 (44 second mortgage, 32 both second mortgage and home equity loan) Median monthly owner costs for units with a mortgage: $1,360 Median monthly owner costs for units without a mortgage: $464
Residents with income below the poverty level in 2022:
This zip code:
14.6%
Whole state:
14.0%
Residents with income below 50% of the poverty level in 2022:
This zip code:
10.7%
Whole state:
7.4%
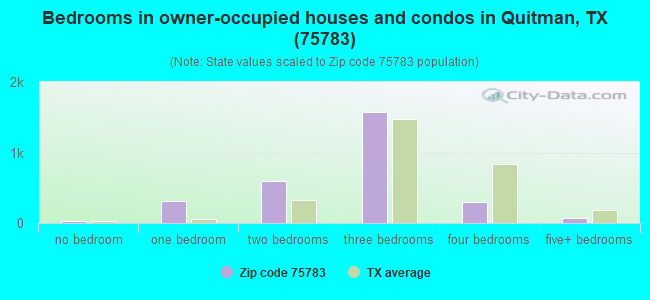
Median number of rooms in houses and condos:
Here:
5.5
State:
6.3
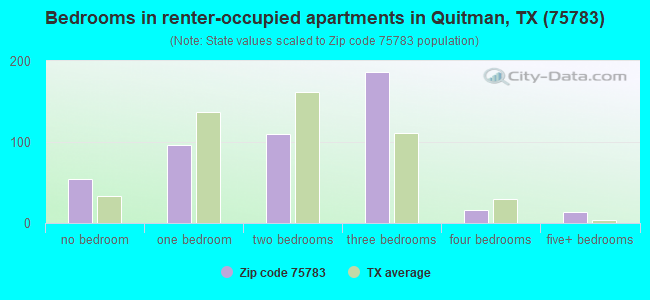
Median number of rooms in apartments:
Here:
4.6
State:
4.0
Notable locations in this zip code not listed on our city pages
Notable locations in zip code 75783: Oak Forest Branch Library (A), Smith Branch Library (B), Scenic Woods Regional Library (C), Young Branch Library (D), West University Branch Library (E), Walter Branch Library (F), Vinson Branch Library (G), Tuttle Branch Library (H), Stinson Home- Honeymoon Cottage Museum (I), Ima Hogg Museum (J), Quitman Fire Department (K). Display/hide their locations on the map
Churches in zip code 75783 include: Rock Hill Church (A), Stormville Church (B), Shiloh Church (C), Myrtle Springs Church (D), Muddy Creek Church (E), Liberty Church (F), Ebenezer Church (G), Cloverhill Church (H), The Church of Jesus Christ of Latter Day Saints (I). Display/hide their locations on the map
Cemeteries: Searcy Cemetery (1), Ingram Cemetery (2), Shiloh Cemetery (3), Mansell Cemetery (4), Price Cemetery (5), Rock Hill Cemetery (6), Peyton Cemetery (7). Display/hide their locations on the map
Lakes and reservoirs: Hannah Lake (A), Wells Lake (B), Long Lake (C), Brushy Lake (D), George Slough (E), Lake Quitman (F), Harris Lake (G), Wells Lake Number 5 (H). Display/hide their locations on the map
Streams, rivers, and creeks: Buck Creek (A), Brushy Creek (B), Bell Branch (C), Taylor Branch (D), Turkey Creek (E), Shiloh Branch (F), Searcy Branch (G), Salt Branch (H), Long Branch (I). Display/hide their locations on the map
In group quarters: 213 (-1 institutionalized population)
Size of family households: 1,344 2-persons, 446 3-persons, 355 4-persons, 139 5-persons, 21 6-persons, 38 7-or-more-persons
Size of nonfamily households: 970 1-person, 85 2-persons
899 married couples with children.
730 single-parent households (328 men, 402 women).
91.5% of residents of 75783 zip code speak English at home.
8.4% of residents speak Spanish at home (66% very well, 16% well, 16% not well, 2% not at all).
0.1% of residents speak other Indo-European language at home (100% very well).
0.4% of residents speak Asian or Pacific Island language at home (100% very well).
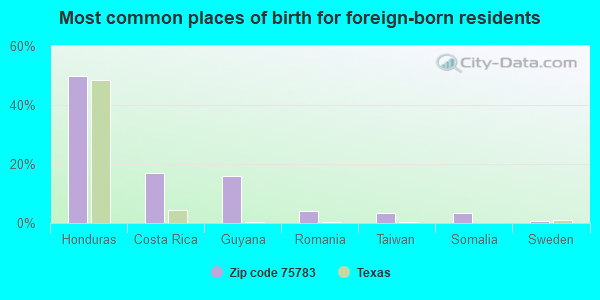
Foreign born population: 245 (3.0%) (64.1% of them are naturalized citizens)
This zip code:
3.0%
Whole state:
17.2%
50%Honduras
17%Costa Rica
16%Guyana
4%Romania
3%Taiwan
3%Somalia
1%Sweden
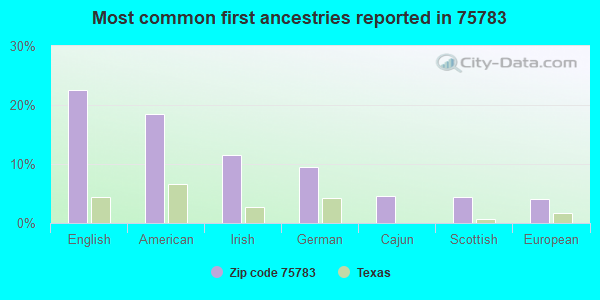
23%English
18%American
12%Irish
10%German
5%Cajun
4%Scottish
4%European
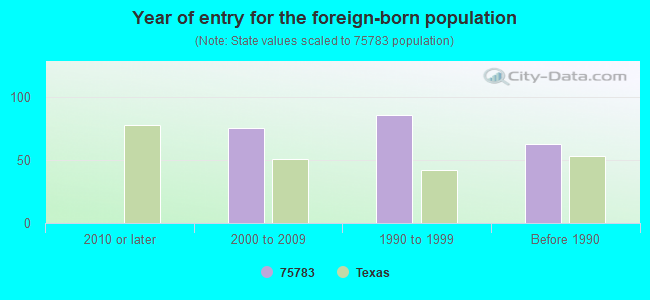
Year of entry for the foreign-born population
02010 or later
762000 to 2009
861990 to 1999
63Before 1990
Facilities with environmental interests located in this zip code:
AMOCO PIPELINE COMPANY (2.5 MI FROM HWY 154 ON FM 2225 in QUITMAN, TX)
AIR MINOR (AIRS/AFS) CRITERIA AND HAZARDOUS AIR POLLUTANT INVENTORY (Inventory of air pollution sources) Business SIC classification: CRUDE PETROLEUM PIPELINES
Housing units lacking complete plumbing facilities: 3.8% Housing units lacking complete kitchen facilities: 4.3%
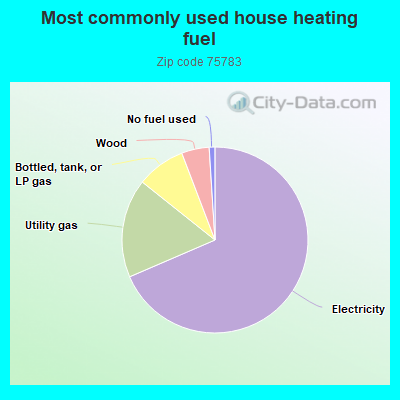
68.6%Electricity
17.2%Utility gas
8.5%Bottled, tank, or LP gas
4.8%Wood
1.0%No fuel used
Population in 1990: 5,864. Population change in the 1990s: +702 (+12.0%).
Place of birth for U.S.-born residents:
This state: 5,733
Northeast: 303
Midwest: 319
South: 774
West: 671
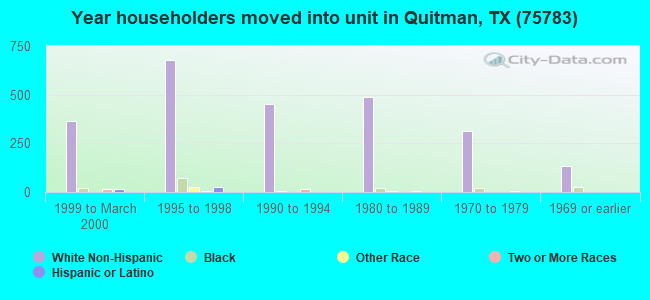
57% of the 75783 zip code residents lived in the same house 5 years ago. Out of people who lived in different houses, 50% lived in this county. Out of people who lived in different counties, 50% lived in Texas.
86% of the 75783 zip code residents lived in the same house 1 year ago. Out of people who lived in different houses, 32% moved from this county. Out of people who lived in different houses, 52% moved from different county within same state. Out of people who lived in different houses, 18% moved from different state.
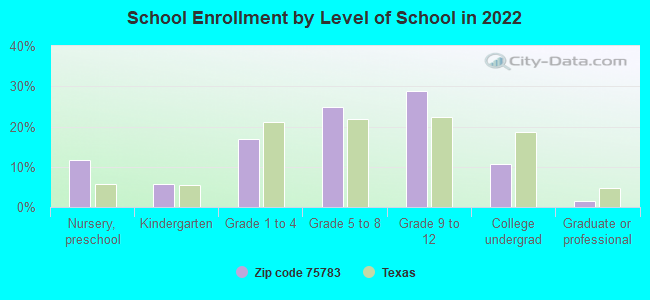
Private vs. public school enrollment:
Students in private schools in grades 1 to 8 (elementary and middle school): 103
Here:
14.7%
Texas:
8.8%
Students in private schools in grades 9 to 12 (high school): 34
Here:
7.1%
Texas:
8.0%
Students in private undergraduate colleges: 38
Here:
20.8%
Texas:
16.2%
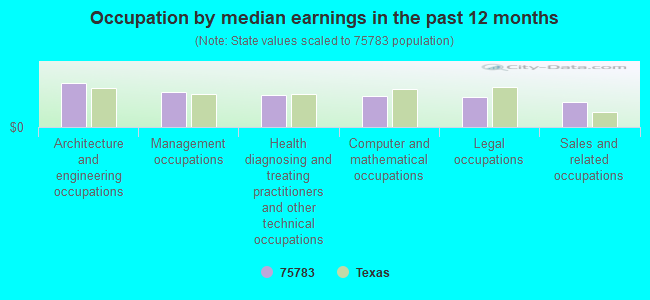
Occupation by median earnings in the past 12 months ($)
113,370Architecture and engineering occupations
89,665Management occupations
82,577Health diagnosing and treating practitioners and other technical occupations
80,954Computer and mathematical occupations
76,969Legal occupations
64,470Sales and related occupations
Companies with federal contracts located in this zip code:
BLACK, WILLIAM E (235 WHITEFOOT in QUITMAN, TX; small business) : $17,575 in 3 contractsin 2004
$13,080 with Army for Recreational Services. Signed on 2004-08-12. Completion date: 2004-12-31.
$7,055 with Army for Guard Services. Signed on 2004-02-25. Completion date: 2004-08-13.
-$2,560 with Army for Recreational Services. Signed on 2004-10-14. Completion date: 2004-12-31.
Top industries in this zip code by the number of employees in 2005:
Health Care and Social Assistance: Nursing Care Facilities (100-249 employees: 1 establishment)
Health Care and Social Assistance: General Medical and Surgical Hospitals (100-249: 1)
Other Services (except Public Administration): Religious Organizations (10-19: 2, 5-9: 2, 1-4: 3)
Health Care and Social Assistance: Offices of Physicians (except Mental Health Specialists) (10-19: 1, 5-9: 1, 1-4: 7)
Construction: Water and Sewer Line and Related Structures Construction (20-49: 1, 1-4: 1)
People in group quarters in 2010:
88 people in nursing facilities/skilled-nursing facilities
57 people in local jails and other municipal confinement facilities
People in group quarters in 2000:
158 people in nursing homes
70 people in local jails and other confinement facilities (including police lockups)
6 people in wards in general hospitals for patients who have no usual home elsewhere
Fatal accident statistics in 2014:
Fatal accident count: 2
Vehicles involved in fatal accidents: 2
Fatal accidents caused by drunken drivers: 1
Fatalities: 2
Persons involved in fatal accidents: 3
Pedestrians involved in fatal accidents: 0
Fatal accident statistics in 2013:
Fatal accident count: 2
Vehicles involved in fatal accidents: 3
Fatal accidents caused by drunken drivers: 0
Fatalities: 2
Persons involved in fatal accidents: 3
Pedestrians involved in fatal accidents: 0
2004 - 2018 National Fire Incident Reporting System (NFIRS) incidents
Based on the data from the years 2004 - 2018 the average number of fires per year is 92. The highest number of fires - 139 took place in 2011, and the least - 62 in 2007. The data has a dropping trend.
When looking into fire subcategories, the most reports belonged to: Outside Fires (73.7%), and Structure Fires (19.5%).
Fire incident types reported to NFIRS in Zip Code 75783


 Nearest zip codes: 75773, 75497, 75494, 75431, 75410, 75471.
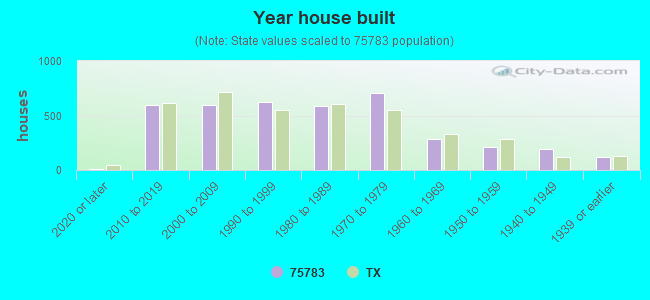


 Based on the data from the years 2004 - 2018 the average number of fires per year is 92. The highest number of fires - 139 took place in 2011, and the least - 62 in 2007. The data has a dropping trend.
 When looking into fire subcategories, the most reports belonged to: Outside Fires (73.7%), and Structure Fires (19.5%).