Estimated zip code population in 2022: 8,699 Zip code population in 2010: 7,976 Zip code population in 2000: 7,404
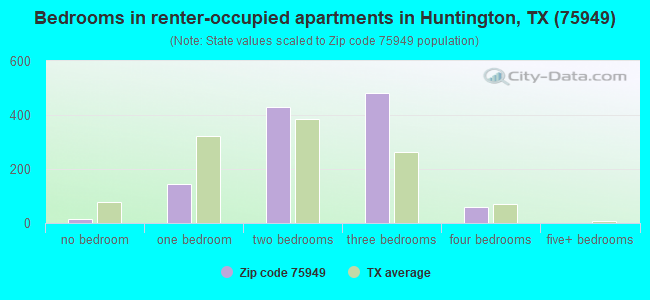
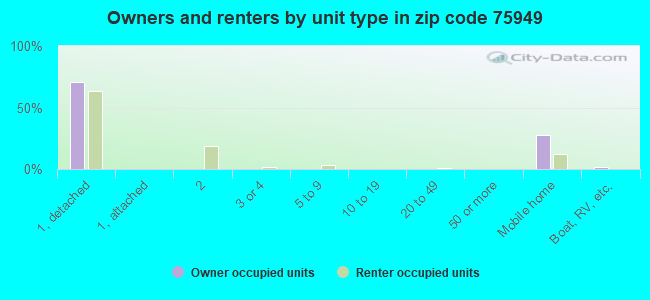
Houses and condos: 4,217 Renter-occupied apartments: 1,146
% of renters here:
32%
State:
38%
March 2022 cost of living index in zip code 75949: 78.7 (low, U.S. average is 100)
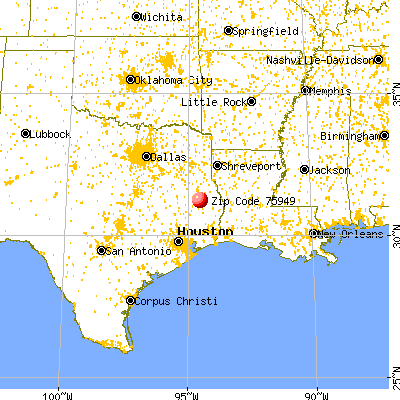
Land area: 197.6 sq. mi. Water area: 21.4 sq. mi.
Population density: 44 people per square mile
(very low).
OSM Map
General Map
Google Map
MSN Map
OSM Map
General Map
Google Map
MSN Map
OSM Map
General Map
Google Map
MSN Map
OSM Map
General Map
Google Map
MSN Map
Please wait while loading the map...
Real estate property taxes paid for housing units in 2022:
This zip code:
1.0% ($1,240)
Texas:
1.5% ($4,050)
Median real estate property taxes paid for housing units with mortgages in 2022: $2,356 (1.3%) Median real estate property taxes paid for housing units with no mortgage in 2022: $899 (1.2%)
Averages for the 2020 tax year for zip code 75949, filed in 2021:
Average Adjusted Gross Income (AGI) in 2020: $52,429 (Individual Income Tax Returns)
Here:
$52,429
State:
$77,054
Salary/wage: $46,832 (reported on 82.6% of returns)
Here:
$46,832
State:
$62,766
(% of AGI for various income ranges: 1107.7% for AGIs below $25k, 3343.8% for AGIs $25k-50k, 6254.1% for AGIs $50k-75k, 9574.2% for AGIs $75k-100k, 14936.3% for AGIs $100k-200k)
Taxable interest for individuals: $1,209 (reported on 23.1% of returns)
This zip code:
$1,209
Texas:
$2,665
(% of AGI for various income ranges: 12.6% for AGIs below $25k, 13.1% for AGIs $25k-50k, 33.7% for AGIs $50k-75k, 35.8% for AGIs $75k-100k, 80.7% for AGIs $100k-200k)
Ordinary dividends: $2,988 (reported on 9.4% of returns)
Here:
$2,988
State:
$10,044
(% of AGI for various income ranges: 7.5% for AGIs below $25k, 15.9% for AGIs $25k-50k, 17.6% for AGIs $50k-75k, 38.8% for AGIs $75k-100k, 180.4% for AGIs $100k-200k)
Net capital gain/loss in AGI: +$20,582 (reported on 9.7% of returns)
Here:
+$20,582
State:
+$39,590
(% of AGI for various income ranges: 2.8% for AGIs below $25k, 21.8% for AGIs $25k-50k, 63.2% for AGIs $50k-75k, 147.9% for AGIs $75k-100k, 302.6% for AGIs $100k-200k)
Profit/loss from business: +$8,432 (reported on 17.1% of returns)
Here:
+$8,432
State:
+$10,888
(% of AGI for various income ranges: 96.1% for AGIs below $25k, 187.1% for AGIs $25k-50k, 154.4% for AGIs $50k-75k, 109.2% for AGIs $75k-100k, 638.9% for AGIs $100k-200k)
Taxable individual retirement arrangement distribution: $14,512 (reported on 7.4% of returns)
75949:
$14,512
Texas:
$24,740
(% of AGI for various income ranges: 38.0% for AGIs below $25k, 85.3% for AGIs $25k-50k, 159.3% for AGIs $50k-75k, 195.0% for AGIs $75k-100k, 592.2% for AGIs $100k-200k)
Total itemized deductions: $34,533 (reported on 2.6% of returns)
Here:
$34,533
State:
$40,428
(% of AGI for various income ranges: 52.8% for AGIs below $25k, 238.8% for AGIs $50k-75k, 588.9% for AGIs $100k-200k)
Charity contributions: $13,286 (reported on 2.0% of returns)
Here:
$13,286
State:
$18,201
(% of AGI for various income ranges: 62.7% for AGIs $50k-75k, 249.3% for AGIs $100k-200k)
Taxes paid: $4,678 (reported on 2.6% of returns)
75949:
$4,678
State:
$7,821
(% of AGI for various income ranges: 5.9% for AGIs below $25k, 29.5% for AGIs $50k-75k, 88.9% for AGIs $100k-200k)
Earned income credit: $2,538 (reported on 22.0% of returns)
Here:
$2,538
State:
$2,584
(% of AGI for various income ranges: 118.8% for AGIs below $25k, 93.5% for AGIs $25k-50k, 3.2% for AGIs $50k-75k)
Percentage of individuals using paid preparers for their 2020 taxes: 94.0%
Here:
94%
State:
92%
(% for various income ranges: 92.9% for AGIs below $25k, 95.7% for AGIs $25k-50k, 96.2% for AGIs $50k-75k, 93.8% for AGIs $75k-100k, 92.3% for AGIs $100k-200k, 83.3% for AGIs over 200k)
Averages for the 2012 tax year for zip code 75949, filed in 2013:
Average Adjusted Gross Income (AGI) in 2012: $46,030 (Individual Income Tax Returns)
Here:
$46,030
State:
$65,384
Salary/wage: $41,493 (reported on 86.5% of returns)
Here:
$41,493
State:
$52,524
(% of AGI for various income ranges: 76.1% for AGIs below $25k, 81.7% for AGIs $25k-50k, 83.9% for AGIs $50k-75k, 82.8% for AGIs $75k-100k, 83.9% for AGIs $100k-200k, 37.2% for AGIs over 200k)
Taxable interest for individuals: $1,072 (reported on 22.3% of returns)
This zip code:
$1,072
Texas:
$2,372
(% of AGI for various income ranges: 0.9% for AGIs below $25k, 0.4% for AGIs $25k-50k, 0.5% for AGIs $50k-75k, 0.6% for AGIs $75k-100k, 0.5% for AGIs $100k-200k, 0.2% for AGIs over 200k)
Ordinary dividends: $2,669 (reported on 8.2% of returns)
Here:
$2,669
State:
$9,721
(% of AGI for various income ranges: 0.3% for AGIs below $25k, 0.4% for AGIs $25k-50k, 0.3% for AGIs $50k-75k, 0.5% for AGIs $75k-100k, 0.9% for AGIs $100k-200k)
Net capital gain/loss in AGI: +$4,141 (reported on 6.9% of returns)
Here:
+$4,141
State:
+$35,319
(% of AGI for various income ranges: 0.2% for AGIs $25k-50k, 0.5% for AGIs $50k-75k, 0.3% for AGIs $75k-100k, 2.1% for AGIs $100k-200k)
Profit/loss from business: +$8,379 (reported on 16.6% of returns)
Here:
+$8,379
State:
+$13,732
(% of AGI for various income ranges: 8.1% for AGIs below $25k, 3.3% for AGIs $25k-50k, 2.0% for AGIs $50k-75k, 2.8% for AGIs $75k-100k, 2.5% for AGIs $100k-200k)
Taxable individual retirement arrangement distribution: $11,318 (reported on 6.9% of returns)
75949:
$11,318
Texas:
$19,511
(% of AGI for various income ranges: 2.4% for AGIs below $25k, 1.5% for AGIs $25k-50k, 1.2% for AGIs $50k-75k, 5.0% for AGIs $75k-100k)
Total itemized deductions: $22,692 (24% of AGI, reported on 15.7% of returns)
Here:
$22,692
State:
$24,724
Here:
23.6% of AGI
State:
15.9% of AGI
(% of AGI for various income ranges: 4.1% for AGIs below $25k, 6.1% for AGIs $25k-50k, 7.6% for AGIs $50k-75k, 8.4% for AGIs $75k-100k, 10.2% for AGIs $100k-200k, 8.7% for AGIs over 200k)
Charity contributions: $5,626 (reported on 10.7% of returns)
Here:
$5,626
State:
$6,808
(% of AGI for various income ranges: 0.6% for AGIs below $25k, 0.7% for AGIs $25k-50k, 1.2% for AGIs $50k-75k, 1.5% for AGIs $75k-100k, 2.7% for AGIs $100k-200k)
Taxes paid: $4,115 (reported on 15.0% of returns)
75949:
$4,115
State:
$6,921
(% of AGI for various income ranges: 0.6% for AGIs below $25k, 1.0% for AGIs $25k-50k, 1.1% for AGIs $50k-75k, 1.4% for AGIs $75k-100k, 2.1% for AGIs $100k-200k, 1.7% for AGIs over 200k)
Earned income credit: $2,421 (reported on 25.1% of returns)
Here:
$2,421
State:
$2,570
(% of AGI for various income ranges: 8.3% for AGIs below $25k, 1.8% for AGIs $25k-50k)
Percentage of individuals using paid preparers for their 2012 taxes: 53.0%
Here:
53%
State:
51%
(% for various income ranges: 47.8% for AGIs below $25k, 52.5% for AGIs $25k-50k, 57.4% for AGIs $50k-75k, 60.0% for AGIs $75k-100k, 60.0% for AGIs $100k-200k, 100.0% for AGIs over 200k)
Averages for the 2004 tax year for zip code 75949, filed in 2005:
Average Adjusted Gross Income (AGI) in 2004: $32,215 (Individual Income Tax Returns)
Here:
$32,215
State:
$47,881
Salary/wage: $31,444 (reported on 84.8% of returns)
Here:
$31,444
State:
$41,947
(% of AGI for various income ranges: 147.2% for AGIs below $10k, 77.1% for AGIs $10k-25k, 86.3% for AGIs $25k-50k, 87.5% for AGIs $50k-75k, 83.8% for AGIs $75k-100k, 62.5% for AGIs over 100k)
Taxable interest for individuals: $1,299 (reported on 27.8% of returns)
This zip code:
$1,299
Texas:
$2,255
(% of AGI for various income ranges: 4.3% for AGIs below $10k, 1.7% for AGIs $10k-25k, 1.2% for AGIs $25k-50k, 0.8% for AGIs $50k-75k, 1.0% for AGIs $75k-100k, 0.7% for AGIs over 100k)
Taxable dividends: $1,083 (reported on 9.2% of returns)
Here:
$1,083
State:
$4,261
(% of AGI for various income ranges: 1.1% for AGIs below $10k, 0.2% for AGIs $10k-25k, 0.3% for AGIs $25k-50k, 0.2% for AGIs $50k-75k, 0.4% for AGIs $75k-100k, 0.4% for AGIs over 100k)
Net capital gain/loss: +$2,792 (reported on 8.4% of returns)
Here:
+$2,792
State:
+$16,110
(% of AGI for various income ranges: 0.5% for AGIs below $10k, 0.5% for AGIs $10k-25k, 1.1% for AGIs $25k-50k, 0.4% for AGIs $50k-75k, 0.4% for AGIs $75k-100k, 1.0% for AGIs over 100k)
Profit/loss from business: +$5,764 (reported on 18.2% of returns)
Here:
+$5,764
State:
+$11,013
(% of AGI for various income ranges: 9.2% for AGIs below $10k, 6.6% for AGIs $10k-25k, 2.8% for AGIs $25k-50k, 1.9% for AGIs $50k-75k, 2.4% for AGIs $75k-100k, 2.8% for AGIs over 100k)
IRA payment deduction: $2,854 (reported on 1.7% of returns)
75949:
$2,854
Texas:
$3,120
Total itemized deductions: $16,849 (26% of AGI, reported on 12.7% of returns)
Here:
$16,849
State:
$19,631
Here:
25.8% of AGI
State:
18.9% of AGI
(% of AGI for various income ranges: 4.5% for AGIs below $10k, 4.0% for AGIs $10k-25k, 6.5% for AGIs $25k-50k, 6.8% for AGIs $50k-75k, 7.4% for AGIs $75k-100k, 9.2% for AGIs over 100k)
Charity contributions deductions: $4,513 (6% of AGI, reported on 9.3% of returns)
Here:
$4,513
State:
$4,753
Here:
6.4% of AGI
State:
4.2% of AGI
(% of AGI for various income ranges: 0.8% for AGIs $10k-25k, 0.9% for AGIs $25k-50k, 1.3% for AGIs $50k-75k, 1.6% for AGIs $75k-100k, 2.6% for AGIs over 100k)
Total tax: $4,034 (reported on 67.3% of returns)
75949:
$4,034
State:
$9,058
(% of AGI for various income ranges: 4.4% for AGIs below $10k, 3.4% for AGIs $10k-25k, 5.6% for AGIs $25k-50k, 8.4% for AGIs $50k-75k, 10.4% for AGIs $75k-100k, 18.5% for AGIs over 100k)
Earned income credit: $1,918 (reported on 26.8% of returns)
Here:
$1,918
State:
$2,024
Percentage of individuals using paid preparers for their 2004 taxes: 58.8%
Here:
59%
State:
57%
(% for various income ranges: 54.5% for AGIs below $10k, 61.5% for AGIs $10k-25k, 61.1% for AGIs $25k-50k, 51.5% for AGIs $50k-75k, 57.0% for AGIs $75k-100k, 80.5% for AGIs over 100k)
Household received Food Stamps/SNAP in the past 12 months: 714 Household did not receive Food Stamps/SNAP in the past 12 months: 2,842
Women who had a birth in the past 12 months: 57 (59 now married, 0 unmarried) Women who did not have a birth in the past 12 months: 1,982 (948 now married, 1,031 unmarried)
Housing units in zip code 75949 with a mortgage: 733 (11 second mortgage, 12 both second mortgage and home equity loan) Houses without a mortgage: 25
Median monthly owner costs for units with a mortgage: $1,322 Median monthly owner costs for units without a mortgage: $330
Residents with income below the poverty level in 2022:
This zip code:
15.0%
Whole state:
14.0%
Residents with income below 50% of the poverty level in 2022:
This zip code:
6.0%
Whole state:
7.4%
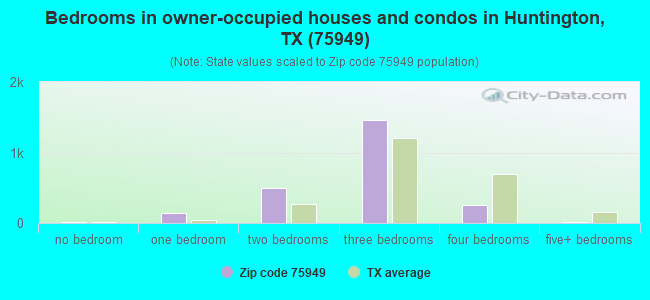
Median number of rooms in houses and condos:
Here:
5.6
State:
6.3
Median number of rooms in apartments:
Here:
4.4
State:
4.0
Notable locations in this zip code not listed on our city pages
Notable locations in zip code 75949: Shawnee (A), Boynton (B), Hanks Creek Park Campground (C), Marion Ferry Recreation Site (D), Marion (E), Gibbs-Flournoy House (F), Huntington Volunteer Fire Department (G), Ora Volunteer Fire Department (H), Dunham Hill (I). Display/hide their locations on the map
Churches in zip code 75949 include: Lambert Chapel (A), James Chapel (B), Lala Hill Church (C), Little Hope Church (D), Odell Church (E), Salem Church (F). Display/hide their locations on the map
Cemeteries: Carrell Cemetery (1), McClure Cemetery (2), McNeil Cemetery (3), Cochran Cemetery (4), Crain Cemetery (5), Cameron Cemetery (6), McNiel Cemetery (7). Display/hide their locations on the map
Reservoirs: Millpond (A), Club Lake (B), Castleberry Lake (C), Hans Lake (D), Manning Club Lake (E), Manning Mill Ponds (F). Display/hide their locations on the map
Streams, rivers, and creeks: Biloxi Creek (A), Big Branch (B), Banks Creek (C), Possum Trot Creek (D), Caney Creek (E), Tubbs Creek (F), Swagerty Creek (G), Stanley Creek (H), Shirley Creek (I). Display/hide their locations on the map
In group quarters: 79 (-1 institutionalized population)
Size of family households: 1,412 2-persons, 479 3-persons, 579 4-persons, 105 5-persons, 15 6-persons, 69 7-or-more-persons
Size of nonfamily households: 736 1-person, 134 2-persons, 12 3-persons
1,253 married couples with children.
501 single-parent households (162 men, 339 women).
99.4% of residents of 75949 zip code speak English at home.
0.7% of residents speak Spanish at home (100% very well).
0.2% of residents speak other Indo-European language at home (100% very well).
0.1% of residents speak Asian or Pacific Island language at home (100% well).
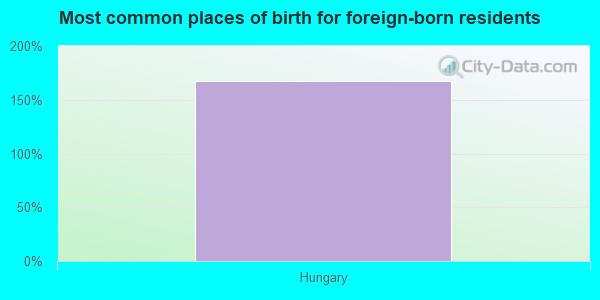
Foreign born population: 11 (0.1%) (0.0% of them are naturalized citizens)
:
0.1%
Whole state:
17.2%
167%Hungary
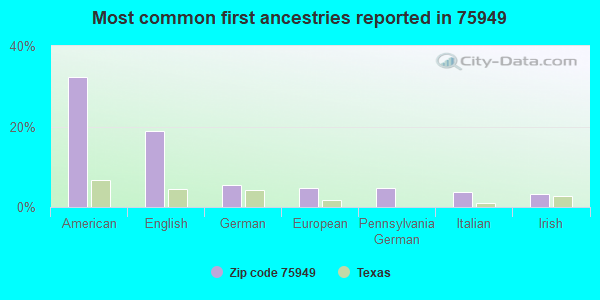
32%American
19%English
5%German
5%European
5%Pennsylvania German
4%Italian
3%Irish
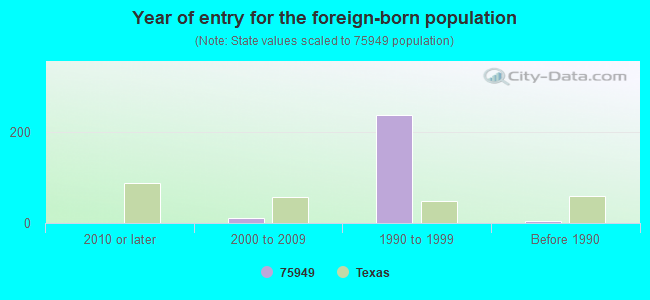
Year of entry for the foreign-born population
02010 or later
112000 to 2009
2381990 to 1999
5Before 1990
Housing units lacking complete plumbing facilities: 4.7% Housing units lacking complete kitchen facilities: 6.8%
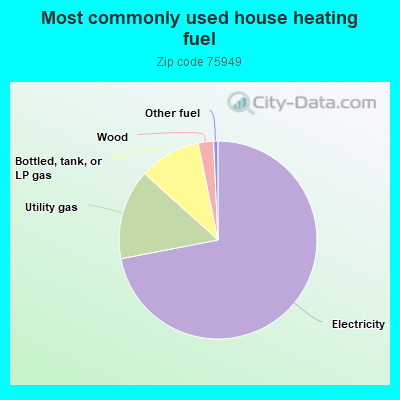
71.9%Electricity
14.7%Utility gas
10.1%Bottled, tank, or LP gas
2.5%Wood
0.7%Other fuel
Population in 1990: 8,415.
Place of birth for U.S.-born residents:
This state: 6,982
Northeast: 73
Midwest: 253
South: 758
West: 292
60% of the 75949 zip code residents lived in the same house 5 years ago. Out of people who lived in different houses, 67% lived in this county. Out of people who lived in different counties, 50% lived in Texas.
86% of the 75949 zip code residents lived in the same house 1 year ago. Out of people who lived in different houses, 39% moved from this county. Out of people who lived in different houses, 10% moved from different county within same state. Out of people who lived in different houses, 54% moved from different state.
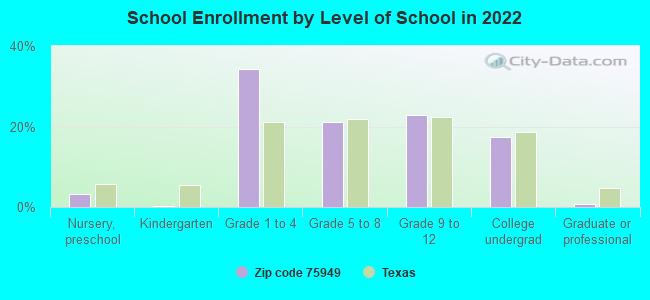
Private vs. public school enrollment:
Students in private schools in grades 1 to 8 (elementary and middle school): 37
Here:
3.6%
Texas:
8.8%
Students in private schools in grades 9 to 12 (high school):
Here:
0.0%
Texas:
8.0%
Students in private undergraduate colleges: 25
Here:
7.6%
Texas:
16.2%
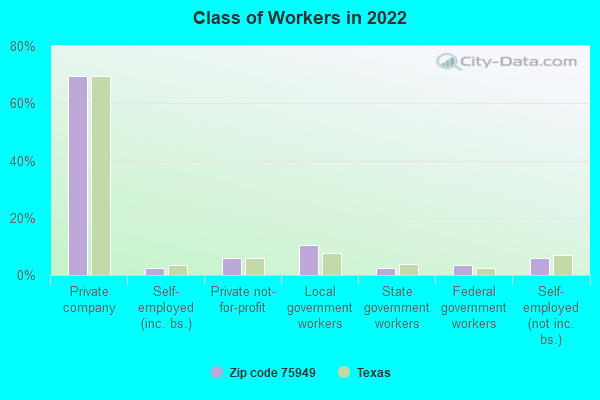
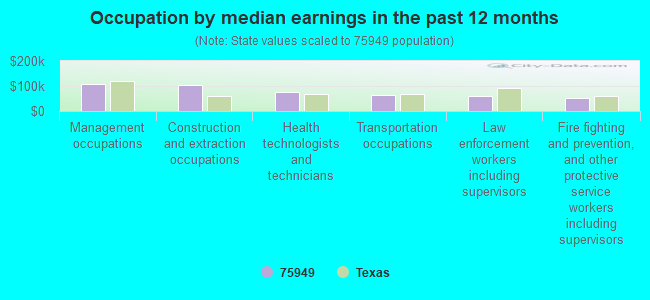
Occupation by median earnings in the past 12 months ($)
106,575Management occupations
102,641Construction and extraction occupations
77,044Health technologists and technicians
65,512Transportation occupations
61,851Law enforcement workers including supervisors
50,562Fire fighting and prevention, and other protective service workers including supervisors
Companies with federal contracts located in this zip code:
TATUMS SANITATION SERVICE, INC (517 HWY 69 NORTH in HUNTINGTON, TX; small business) : $350,116 in 14 contractsfrom 2000 to 2006
Contracts for Trash/Garbage Collection Services - Including Portable Sanitation Services by U.S. Army Corps of Engineers - civil program financing only, Army Signed by year:2000: $59,800; 2001: $59,800; 2002: $0; 2003: $50,924; 2004: $58,528; 2005: $68,239; 2006: $52,825.
Biggest contracts:
$59,800 with U.S. Army Corps of Engineers - civil program financing only for Trash/Garbage Collection Services - Including Portable Sanitation Services. Signed on 2001-10-16. Completion date: 2005-09-30.
$59,800, same as above.Signed on 2000-10-31. Completion date: 2005-09-30.
$53,800 with Army for Trash/Garbage Collection Services - Including Portable Sanitation Services. Signed on 2004-01-26. Completion date: 2005-09-30.
$52,825, same as above.Signed on 2006-01-12. Completion date: 2005-11-28.
ANDREWS, ORAN (562 HANKS CREEK ROAD in HUNTINGTON, TX; small business) : $39,754 in 9 contractsfrom 2003 to 2005
Contracts for Recreation Site Maintenance Services (non-construction) by Army, U.S. Army Corps of Engineers - civil program financing only Signed by year:2000: $0; 2001: $0; 2002: $0; 2003: $4,690; 2004: $16,620; 2005: $18,444; 2006: $0.
Biggest contracts:
$15,820 with Army for Recreation Site Maintenance Services (non-construction). Signed on 2004-01-16. Completion date: 2003-12-30.
$12,093, same as above.Signed on 2005-02-23. Completion date: 2005-09-06.
$12,093 with U.S. Army Corps of Engineers - civil program financing only for Recreation Site Maintenance Services (non-construction). Signed on 2005-02-23. Completion date: 2005-09-06.
$1,820 with Army for Recreation Site Maintenance Services (non-construction). Signed on 2003-10-07. Completion date: 2003-10-30.
BESS LAMB (562 HANKS CAMP ROAD in HUNTINGTON, TX) : $20,615 in 6 contractsfrom 2003 to 2005
Contracts for Guard Services, Recreation Site Maintenance Services (non-construction) by Army, U.S. Army Corps of Engineers - civil program financing only Signed by year:2000: $0; 2001: $0; 2002: $0; 2003: $4,560; 2004: $14,330; 2005: $1,725; 2006: $0.
Biggest contracts:
$7,280 with Army for Guard Services. Signed on 2004-03-08. Completion date: 2004-08-16.
$4,560, same as above.Signed on 2003-12-10. Completion date: 2003-12-31.
$3,300 with U.S. Army Corps of Engineers - civil program financing only for Recreation Site Maintenance Services (non-construction). Signed on 2004-10-25. Completion date: 2004-08-10.
$1,875 with Army for Recreation Site Maintenance Services (non-construction). Signed on 2004-12-16. Completion date: 2004-08-10.
Top industries in this zip code by the number of employees in 2005:
Health Care and Social Assistance: Child Day Care Services (10-19: 2)
Other Services (except Public Administration): Religious Organizations (10-19: 1, 5-9: 1, 1-4: 4)
People in group quarters in 2010:
96 people in nursing facilities/skilled-nursing facilities
Fatal accident statistics in 2013:
Fatal accident count: 2
Vehicles involved in fatal accidents: 3
Fatal accidents caused by drunken drivers: 0
Fatalities: 2
Persons involved in fatal accidents: 3
Pedestrians involved in fatal accidents: 0
Fatal accident statistics in 2011:
Fatal accident count: 2
Vehicles involved in fatal accidents: 4
Fatal accidents caused by drunken drivers: 0
Fatalities: 2
Persons involved in fatal accidents: 5
Pedestrians involved in fatal accidents: 0
2003 - 2016 National Fire Incident Reporting System (NFIRS) incidents
According to the data from the years 2003 - 2016 the average number of fires per year is 24. The highest number of fire incidents - 102 took place in 2006, and the least - 0 in 2004. The data has a growing trend.
When looking into fire subcategories, the most reports belonged to: Outside Fires (56.2%), and Structure Fires (29.9%).
Fire incident types reported to NFIRS in Zip Code 75949


 Nearest zip codes: 75901, 75944, 75980, 75941, 75937, 75978.


 : $350,116 in 14 contracts from 2000 to 2006
 According to the data from the years 2003 - 2016 the average number of fires per year is 24. The highest number of fire incidents - 102 took place in 2006, and the least - 0 in 2004. The data has a growing trend.
 When looking into fire subcategories, the most reports belonged to: Outside Fires (56.2%), and Structure Fires (29.9%).