Estimated zip code population in 2022: 78,395 Zip code population in 2010: 59,744 Zip code population in 2000: 38,776
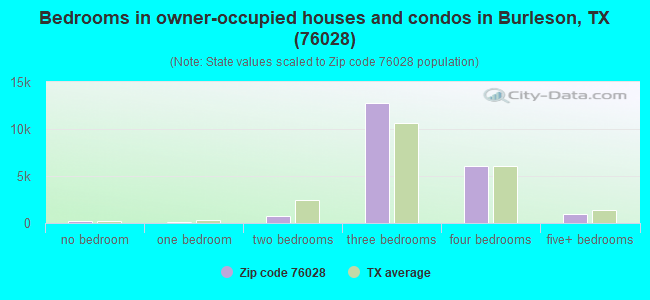
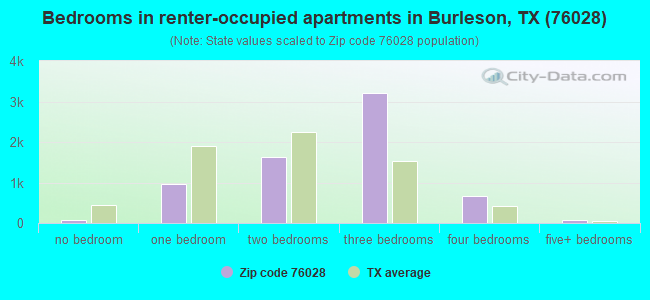
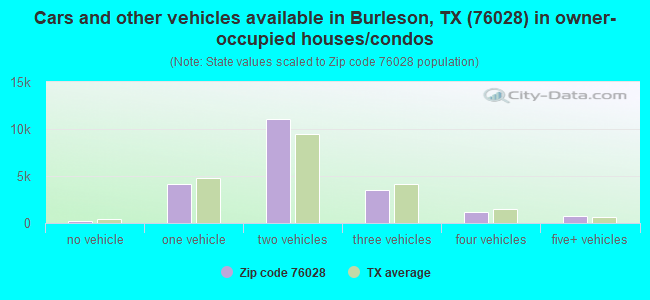
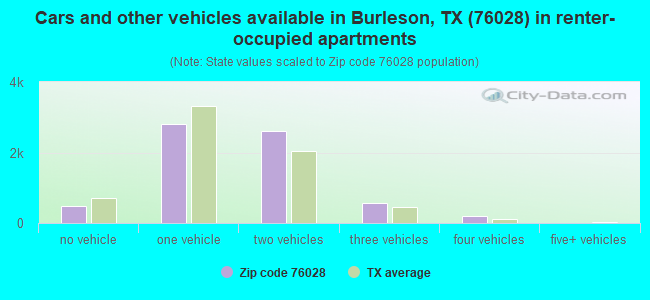
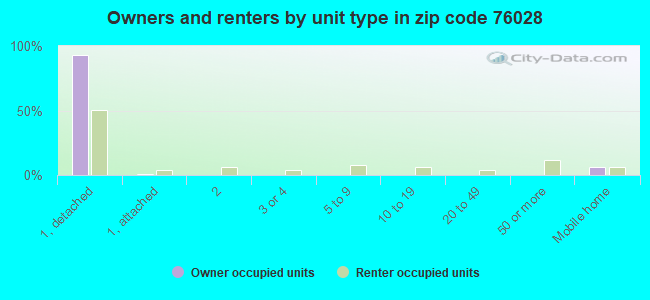
Houses and condos: 28,570 Renter-occupied apartments: 6,713
% of renters here:
24%
State:
38%
March 2022 cost of living index in zip code 76028: 95.8 (near average, U.S. average is 100)
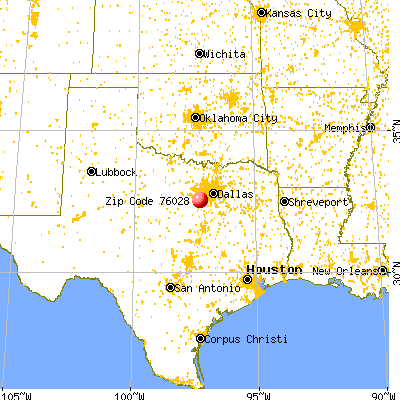
Land area: 77.1 sq. mi. Water area: 0.1 sq. mi.
Population density: 1,016 people per square mile
(low).
OSM Map
General Map
Google Map
MSN Map
OSM Map
General Map
Google Map
MSN Map
OSM Map
General Map
Google Map
MSN Map
OSM Map
General Map
Google Map
MSN Map
Please wait while loading the map...
Real estate property taxes paid for housing units in 2022:
This zip code:
1.4% ($4,472)
Texas:
1.5% ($4,050)
Median real estate property taxes paid for housing units with mortgages in 2022: $5,288 (1.6%) Median real estate property taxes paid for housing units with no mortgage in 2022: $3,328 (1.2%)
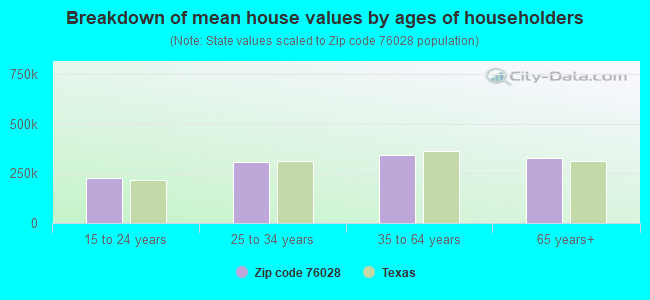
Estimated median house/condo value in 2022: $315,784
76028:
$315,784
Texas:
$275,400
According to our research of Texas and other state lists, there were 140 registered sex offenders living in 76028 zip code as of April 27, 2024. The ratio of all residents to sex offenders in zip code 76028 is 481 to 1. The ratio of registered sex offenders to all residents in this zip code is near the state average.
Median resident age:
This zip code:
37.9 years
Texas median age:
35.6 years
Average household size:
This zip code:
2.8 people
Texas:
2.6 people
Averages for the 2020 tax year for zip code 76028, filed in 2021:
Average Adjusted Gross Income (AGI) in 2020: $76,403 (Individual Income Tax Returns)
Here:
$76,403
State:
$77,054
Salary/wage: $67,199 (reported on 83.1% of returns)
Here:
$67,199
State:
$62,766
(% of AGI for various income ranges: 1137.1% for AGIs below $25k, 3482.7% for AGIs $25k-50k, 6425.0% for AGIs $50k-75k, 9450.7% for AGIs $75k-100k, 17405.2% for AGIs $100k-200k, 56698.5% for AGIs over 200k)
Taxable interest for individuals: $1,498 (reported on 25.0% of returns)
This zip code:
$1,498
Texas:
$2,665
(% of AGI for various income ranges: 14.2% for AGIs below $25k, 19.3% for AGIs $25k-50k, 31.5% for AGIs $50k-75k, 41.2% for AGIs $75k-100k, 82.5% for AGIs $100k-200k, 737.5% for AGIs over 200k)
Ordinary dividends: $5,599 (reported on 14.9% of returns)
Here:
$5,599
State:
$10,044
(% of AGI for various income ranges: 18.1% for AGIs below $25k, 24.4% for AGIs $25k-50k, 52.1% for AGIs $50k-75k, 70.2% for AGIs $75k-100k, 125.2% for AGIs $100k-200k, 2544.6% for AGIs over 200k)
Net capital gain/loss in AGI: +$15,749 (reported on 14.5% of returns)
Here:
+$15,749
State:
+$39,590
(% of AGI for various income ranges: 12.1% for AGIs below $25k, 27.8% for AGIs $25k-50k, 51.9% for AGIs $50k-75k, 100.9% for AGIs $75k-100k, 264.8% for AGIs $100k-200k, 9169.4% for AGIs over 200k)
Profit/loss from business: +$11,149 (reported on 19.8% of returns)
Here:
+$11,149
State:
+$10,888
(% of AGI for various income ranges: 110.5% for AGIs below $25k, 96.7% for AGIs $25k-50k, 182.9% for AGIs $50k-75k, 254.3% for AGIs $75k-100k, 546.5% for AGIs $100k-200k, 3775.4% for AGIs over 200k)
Taxable individual retirement arrangement distribution: $20,271 (reported on 8.8% of returns)
76028:
$20,271
Texas:
$24,740
(% of AGI for various income ranges: 61.0% for AGIs below $25k, 98.8% for AGIs $25k-50k, 195.6% for AGIs $50k-75k, 285.5% for AGIs $75k-100k, 498.8% for AGIs $100k-200k, 2174.8% for AGIs over 200k)
Self-employed (Keogh) retirement plans: $16,700 (reported on 0.3% of returns)
76028:
$16,700
Texas:
$29,298
(% of AGI for various income ranges: 14.0% for AGIs $100k-200k, 139.7% for AGIs over 200k)
Total itemized deductions: $34,499 (reported on 9.1% of returns)
Here:
$34,499
State:
$40,428
(% of AGI for various income ranges: 41.8% for AGIs below $25k, 125.0% for AGIs $25k-50k, 306.8% for AGIs $50k-75k, 444.5% for AGIs $75k-100k, 836.9% for AGIs $100k-200k, 5720.9% for AGIs over 200k)
Charity contributions: $13,637 (reported on 7.5% of returns)
Here:
$13,637
State:
$18,201
(% of AGI for various income ranges: 4.9% for AGIs below $25k, 23.8% for AGIs $25k-50k, 61.1% for AGIs $50k-75k, 107.4% for AGIs $75k-100k, 279.6% for AGIs $100k-200k, 2472.3% for AGIs over 200k)
Taxes paid: $7,830 (reported on 8.9% of returns)
76028:
$7,830
State:
$7,821
(% of AGI for various income ranges: 7.9% for AGIs below $25k, 27.2% for AGIs $25k-50k, 78.5% for AGIs $50k-75k, 113.7% for AGIs $75k-100k, 215.4% for AGIs $100k-200k, 965.5% for AGIs over 200k)
Earned income credit: $2,350 (reported on 12.7% of returns)
Here:
$2,350
State:
$2,584
(% of AGI for various income ranges: 85.7% for AGIs below $25k, 69.3% for AGIs $25k-50k, 1.4% for AGIs $50k-75k)
Percentage of individuals using paid preparers for their 2020 taxes: 93.4%
Here:
93%
State:
92%
(% for various income ranges: 92.4% for AGIs below $25k, 94.0% for AGIs $25k-50k, 93.5% for AGIs $50k-75k, 93.3% for AGIs $75k-100k, 94.1% for AGIs $100k-200k, 94.1% for AGIs over 200k)
Averages for the 2012 tax year for zip code 76028, filed in 2013:
Average Adjusted Gross Income (AGI) in 2012: $63,852 (Individual Income Tax Returns)
Here:
$63,852
State:
$65,384
Salary/wage: $57,573 (reported on 85.7% of returns)
Here:
$57,573
State:
$52,524
(% of AGI for various income ranges: 74.5% for AGIs below $25k, 79.9% for AGIs $25k-50k, 80.4% for AGIs $50k-75k, 81.5% for AGIs $75k-100k, 83.0% for AGIs $100k-200k, 59.2% for AGIs over 200k)
Taxable interest for individuals: $1,099 (reported on 29.3% of returns)
This zip code:
$1,099
Texas:
$2,372
(% of AGI for various income ranges: 1.0% for AGIs below $25k, 0.5% for AGIs $25k-50k, 0.4% for AGIs $50k-75k, 0.3% for AGIs $75k-100k, 0.4% for AGIs $100k-200k, 0.8% for AGIs over 200k)
Ordinary dividends: $3,648 (reported on 15.0% of returns)
Here:
$3,648
State:
$9,721
(% of AGI for various income ranges: 1.3% for AGIs below $25k, 0.6% for AGIs $25k-50k, 0.5% for AGIs $50k-75k, 0.5% for AGIs $75k-100k, 0.5% for AGIs $100k-200k, 2.2% for AGIs over 200k)
Net capital gain/loss in AGI: +$8,550 (reported on 12.2% of returns)
Here:
+$8,550
State:
+$35,319
(% of AGI for various income ranges: 0.3% for AGIs $50k-75k, 0.4% for AGIs $75k-100k, 0.6% for AGIs $100k-200k, 7.6% for AGIs over 200k)
Profit/loss from business: +$11,274 (reported on 17.7% of returns)
Here:
+$11,274
State:
+$13,732
(% of AGI for various income ranges: 6.6% for AGIs below $25k, 3.1% for AGIs $25k-50k, 2.6% for AGIs $50k-75k, 2.3% for AGIs $75k-100k, 2.6% for AGIs $100k-200k, 4.3% for AGIs over 200k)
Taxable individual retirement arrangement distribution: $15,643 (reported on 9.7% of returns)
76028:
$15,643
Texas:
$19,511
(% of AGI for various income ranges: 3.3% for AGIs below $25k, 2.3% for AGIs $25k-50k, 2.4% for AGIs $50k-75k, 2.3% for AGIs $75k-100k, 2.3% for AGIs $100k-200k, 2.2% for AGIs over 200k)
Self-employment retirement plans: $13,788 (reported on 0.3% of returns)
76028:
$13,788
Texas:
$23,938
(% of AGI for various income ranges: 0.2% for AGIs over 200k)
Total itemized deductions: $20,743 (19% of AGI, reported on 33.0% of returns)
Here:
$20,743
State:
$24,724
Here:
19.5% of AGI
State:
15.9% of AGI
(% of AGI for various income ranges: 8.9% for AGIs below $25k, 10.1% for AGIs $25k-50k, 11.3% for AGIs $50k-75k, 11.1% for AGIs $75k-100k, 11.8% for AGIs $100k-200k, 8.9% for AGIs over 200k)
Charity contributions: $5,350 (reported on 26.1% of returns)
Here:
$5,350
State:
$6,808
(% of AGI for various income ranges: 1.0% for AGIs below $25k, 1.5% for AGIs $25k-50k, 1.9% for AGIs $50k-75k, 2.0% for AGIs $75k-100k, 2.6% for AGIs $100k-200k, 2.8% for AGIs over 200k)
Taxes paid: $5,644 (reported on 32.5% of returns)
76028:
$5,644
State:
$6,921
(% of AGI for various income ranges: 1.8% for AGIs below $25k, 2.3% for AGIs $25k-50k, 2.8% for AGIs $50k-75k, 3.0% for AGIs $75k-100k, 3.5% for AGIs $100k-200k, 2.5% for AGIs over 200k)
Earned income credit: $2,220 (reported on 14.6% of returns)
Here:
$2,220
State:
$2,570
(% of AGI for various income ranges: 6.1% for AGIs below $25k, 1.2% for AGIs $25k-50k)
Percentage of individuals using paid preparers for their 2012 taxes: 47.0%
Here:
47%
State:
51%
(% for various income ranges: 42.1% for AGIs below $25k, 45.5% for AGIs $25k-50k, 48.1% for AGIs $50k-75k, 49.1% for AGIs $75k-100k, 52.0% for AGIs $100k-200k, 69.6% for AGIs over 200k)
Averages for the 2004 tax year for zip code 76028, filed in 2005:
Average Adjusted Gross Income (AGI) in 2004: $50,252 (Individual Income Tax Returns)
Here:
$50,252
State:
$47,881
Salary/wage: $47,109 (reported on 87.3% of returns)
Here:
$47,109
State:
$41,947
(% of AGI for various income ranges: 131.3% for AGIs below $10k, 76.2% for AGIs $10k-25k, 83.1% for AGIs $25k-50k, 86.1% for AGIs $50k-75k, 87.8% for AGIs $75k-100k, 74.5% for AGIs over 100k)
Taxable interest for individuals: $1,347 (reported on 38.8% of returns)
This zip code:
$1,347
Texas:
$2,255
(% of AGI for various income ranges: 5.1% for AGIs below $10k, 1.9% for AGIs $10k-25k, 1.1% for AGIs $25k-50k, 0.8% for AGIs $50k-75k, 0.7% for AGIs $75k-100k, 1.1% for AGIs over 100k)
Taxable dividends: $1,443 (reported on 19.2% of returns)
Here:
$1,443
State:
$4,261
(% of AGI for various income ranges: 2.7% for AGIs below $10k, 0.8% for AGIs $10k-25k, 0.4% for AGIs $25k-50k, 0.4% for AGIs $50k-75k, 0.4% for AGIs $75k-100k, 0.7% for AGIs over 100k)
Net capital gain/loss: +$5,641 (reported on 15.3% of returns)
Here:
+$5,641
State:
+$16,110
(% of AGI for various income ranges: -1.2% for AGIs below $10k, 0.4% for AGIs $10k-25k, 0.3% for AGIs $25k-50k, 0.6% for AGIs $50k-75k, 0.7% for AGIs $75k-100k, 4.1% for AGIs over 100k)
Profit/loss from business: +$9,517 (reported on 18.5% of returns)
Here:
+$9,517
State:
+$11,013
(% of AGI for various income ranges: 6.8% for AGIs below $10k, 6.2% for AGIs $10k-25k, 2.9% for AGIs $25k-50k, 2.2% for AGIs $50k-75k, 1.8% for AGIs $75k-100k, 5.0% for AGIs over 100k)
IRA payment deduction: $3,132 (reported on 2.3% of returns)
76028:
$3,132
Texas:
$3,120
(% of AGI for various income ranges: 0.2% for AGIs below $10k, 0.1% for AGIs $10k-25k, 0.2% for AGIs $25k-50k, 0.1% for AGIs $50k-75k, 0.1% for AGIs $75k-100k, 0.1% for AGIs over 100k)
Self-employed pension: $11,606 (reported on 0.5% of returns)
Here:
$11,606
Texas:
$16,401
(% of AGI for various income ranges: 0.0% for AGIs $25k-50k, 0.0% for AGIs $50k-75k, 0.0% for AGIs $75k-100k, 0.2% for AGIs over 100k)
Total itemized deductions: $17,034 (21% of AGI, reported on 35.3% of returns)
Here:
$17,034
State:
$19,631
Here:
20.8% of AGI
State:
18.9% of AGI
(% of AGI for various income ranges: 10.6% for AGIs below $10k, 9.4% for AGIs $10k-25k, 11.1% for AGIs $25k-50k, 12.9% for AGIs $50k-75k, 13.1% for AGIs $75k-100k, 11.7% for AGIs over 100k)
Charity contributions deductions: $3,996 (5% of AGI, reported on 29.0% of returns)
Here:
$3,996
State:
$4,753
Here:
4.6% of AGI
State:
4.2% of AGI
(% of AGI for various income ranges: 0.7% for AGIs below $10k, 1.2% for AGIs $10k-25k, 1.7% for AGIs $25k-50k, 2.2% for AGIs $50k-75k, 2.4% for AGIs $75k-100k, 2.9% for AGIs over 100k)
Total tax: $7,193 (reported on 78.8% of returns)
76028:
$7,193
State:
$9,058
(% of AGI for various income ranges: 4.3% for AGIs below $10k, 4.4% for AGIs $10k-25k, 6.5% for AGIs $25k-50k, 8.4% for AGIs $50k-75k, 10.3% for AGIs $75k-100k, 17.9% for AGIs over 100k)
Earned income credit: $1,681 (reported on 12.6% of returns)
Here:
$1,681
State:
$2,024
Percentage of individuals using paid preparers for their 2004 taxes: 52.4%
Here:
52%
State:
57%
(% for various income ranges: 42.1% for AGIs below $10k, 56.2% for AGIs $10k-25k, 54.5% for AGIs $25k-50k, 52.7% for AGIs $50k-75k, 52.4% for AGIs $75k-100k, 57.5% for AGIs over 100k)
Likely homosexual households (counted as self-reported same-sex unmarried-partner households)
Lesbian couples: 0.3% of all households
Gay men: 0.4% of all households
Household received Food Stamps/SNAP in the past 12 months: 1,335 Household did not receive Food Stamps/SNAP in the past 12 months: 26,207
Women who had a birth in the past 12 months: 954 (721 now married, 236 unmarried) Women who did not have a birth in the past 12 months: 17,773 (9,655 now married, 8,060 unmarried)
Housing units in zip code 76028 with a mortgage: 13,348 (521 second mortgage, 35 home equity loan, 329 both second mortgage and home equity loan) Houses without a mortgage: 53
Median monthly owner costs for units with a mortgage: $1,946 Median monthly owner costs for units without a mortgage: $675
Residents with income below the poverty level in 2022:
This zip code:
6.7%
Whole state:
14.0%
Residents with income below 50% of the poverty level in 2022:
This zip code:
3.7%
Whole state:
7.4%
Median number of rooms in houses and condos:
Here:
6.0
State:
6.3
Median number of rooms in apartments:
Here:
4.8
State:
4.0
Notable locations in this zip code not listed on our city pages
14,522 married couples with children.
4,867 single-parent households (584 men, 4,283 women).
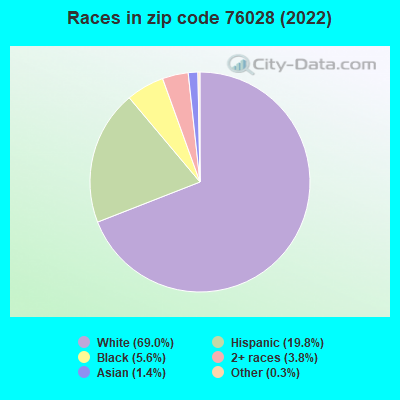
87.2% of residents of 76028 zip code speak English at home.
9.8% of residents speak Spanish at home (61% very well, 23% well, 10% not well, 6% not at all).
1.5% of residents speak other Indo-European language at home (53% very well, 27% well, 11% not well, 9% not at all).
1.1% of residents speak Asian or Pacific Island language at home (61% very well, 17% well, 20% not well, 2% not at all).
0.5% of residents speak other language at home (77% very well, 17% well, 6% not well).
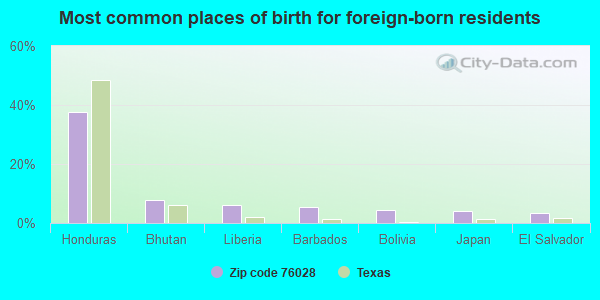
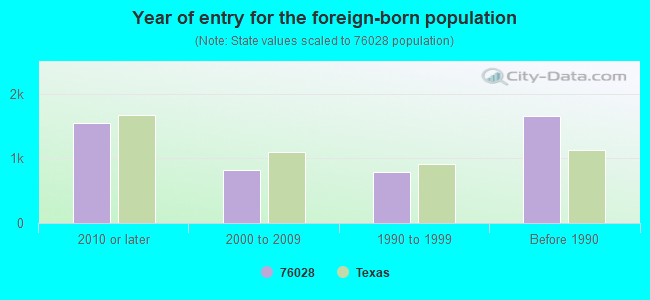
Foreign born population: 4,122 (5.3%) (59.3% of them are naturalized citizens)
This zip code:
5.3%
Whole state:
17.2%
38%Honduras
8%Bhutan
6%Liberia
5%Barbados
4%Bolivia
4%Japan
4%El Salvador
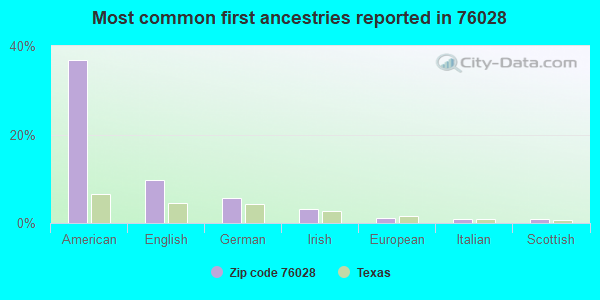
37%American
10%English
6%German
3%Irish
1%European
1%Italian
1%Scottish
Year of entry for the foreign-born population
1,5542010 or later
8212000 to 2009
7891990 to 1999
1,656Before 1990
Facilities with environmental interests located in this zip code:
ACE MARBLE INCORPORATED (631 MOCKINGBIRD LANE in BURLESON, TX)
TRI REPORTER (Tracking of toxic chemicals releasing facilities) Business SIC classification: PLASTICS PRODUCTS; CUT STONE AND STONE PRODUCTS Alternative names: U.S. CAST PRODS. INC.
Housing units lacking complete plumbing facilities: 0.4% Housing units lacking complete kitchen facilities: 2.7%
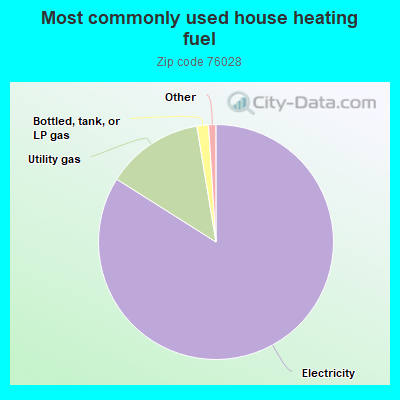
83.9%Electricity
13.4%Utility gas
1.6%Bottled, tank, or LP gas
Population in 1990: 33,535. Population change in the 1990s: +5,241 (+15.6%).
Place of birth for U.S.-born residents:
This state: 53,489
Northeast: 2,229
Midwest: 6,243
South: 6,122
West: 5,252
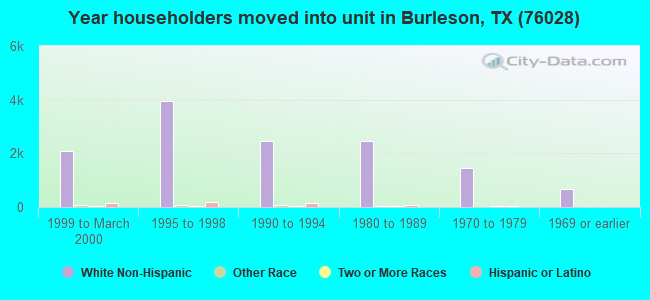
56% of the 76028 zip code residents lived in the same house 5 years ago. Out of people who lived in different houses, 42% lived in this county. Out of people who lived in different counties, 50% lived in Texas.
91% of the 76028 zip code residents lived in the same house 1 year ago. Out of people who lived in different houses, 37% moved from this county. Out of people who lived in different houses, 41% moved from different county within same state. Out of people who lived in different houses, 23% moved from different state. Out of people who lived in different houses, 3% moved from abroad.
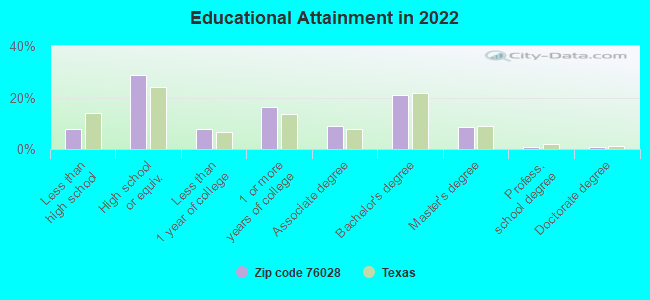
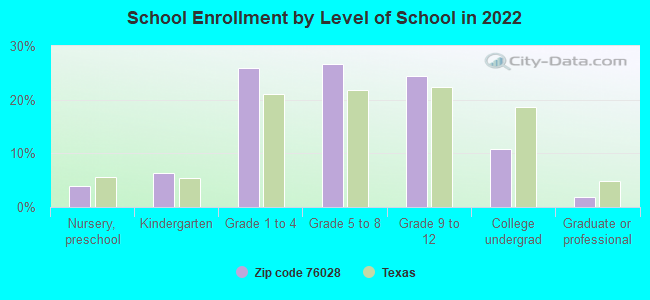
Private vs. public school enrollment:
Students in private schools in grades 1 to 8 (elementary and middle school): 812
Here:
8.4%
Texas:
8.8%
Students in private schools in grades 9 to 12 (high school): 396
Here:
8.8%
Texas:
8.0%
Students in private undergraduate colleges: 340
Here:
17.1%
Texas:
16.2%
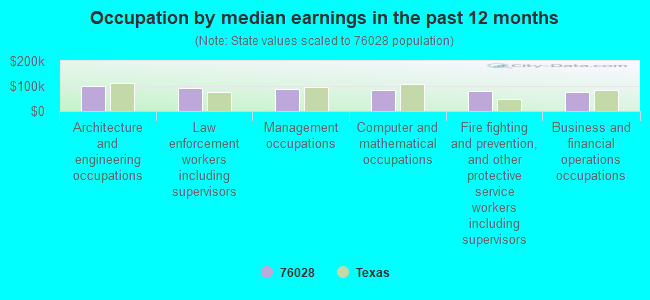
Occupation by median earnings in the past 12 months ($)
101,507Architecture and engineering occupations
90,678Law enforcement workers including supervisors
89,041Management occupations
82,929Computer and mathematical occupations
79,807Fire fighting and prevention, and other protective service workers including supervisors
77,529Business and financial operations occupations
Companies with biggest federal contracts located in this zip code (BURLESON, TX):
CONSORTIUM FOR ADVANCE MANUFAC (119 NW WILSHIRE BLVD #E; small business) : $359,500 in 13 contractsfrom 2000 to 2006
Contracts for Other Professional Services, Educational Services, Program Management/Support Services, Lectures For Training, and moreby ENERGY, Department of, Navy, U.S. Coast Guard, Air Force, and others Signed by year:2000: $25,000; 2001: $32,000; 2002: $75,000; 2003: $57,500; 2004: $25,000; 2005: $110,000; 2006: $35,000.
Biggest contracts:
$50,000 with ENERGY, Department of for Other Professional Services. Signed on 2002-03-15. Completion date: 2003-04-15.
$47,000 with Navy for Educational Services. Signed on 2003-02-03. Completion date: 2003-04-12.
$35,000 with U.S. Coast Guard for Program Management/Support Services. Taking place in DC. Signed on 2005-11-08. Effective on 2005-12-31. Completion date: 2006-01-01.
$32,000 with Navy for Lectures For Training. Signed on 2001-11-02. Completion date: 2001-11-09.
U S UNDERWATER SERVICES INC (101 NE HASKEW; small business) : $204,878 in 15 contractsfrom 2000 to 2006
Contracts for Maintenance, Repair or Alteration of Real Property -- Water Supply Facilities, Maintenance, Repair and Rebuilding of Equipment -- Chemicals and Chemical Products, Maintenance, Repair and Rebuilding of Equipment -- Miscellaneous, Inspection Services (including commercial testing and lab services, except medical/dental) -- Water Purification and Sewage Treatment Equipment, and moreby Air Force, Navy, Army, U.S. Army Corps of Engineers - civil program financing only, and others Signed by year:2000: $89,500; 2001: $0; 2002: $0; 2003: $7,900; 2004: $76,185; 2005: $13,950; 2006: $17,343.
Biggest contracts:
$48,000 with Air Force for Maintenance, Repair or Alteration of Real Property -- Water Supply Facilities. Taking place in FL. Signed on 2000-09-25. Completion date: 2001-01-05.
$41,500 with Air Force for Maintenance, Repair and Rebuilding of Equipment -- Chemicals and Chemical Products. Taking place in CA. Signed on 2000-08-09. Completion date: 2000-10-20.
$34,200 with Air Force for Maintenance, Repair and Rebuilding of Equipment -- Miscellaneous. Taking place in FL. Signed on 2004-04-12. Completion date: 2004-08-30.
$20,100 with Air Force for Inspection Services (including commercial testing and lab services, except medical/dental) -- Water Purification and Sewage Treatment Equipment. Taking place in FL. Signed on 2004-10-29. Completion date: 2005-09-30.
AERO CNC INC (960 S BURLESON BLVD; small business) : $141,561 in 23 contractsfrom 2004 to 2006
Contracts for Airframe Structural Components, Nails, Machine Keys, and Pins, Hose, Pipe, Tube, Lubrication, and Railing Fittings, Miscellaneous Power Transmission Equipment, and moreby Defense Logistics Agency Signed by year:2000: $0; 2001: $0; 2002: $0; 2003: $0; 2004: $45,377; 2005: $74,070; 2006: $22,114.
Biggest contracts:
$27,393 with Defense Logistics Agency for Airframe Structural Components. Signed on 2004-11-08. Completion date: 2005-10-04.
$16,264 with Defense Logistics Agency for Nails, Machine Keys, and Pins. Signed on 2005-11-03. Completion date: 2006-07-01.
$11,490 with Defense Logistics Agency for Hose, Pipe, Tube, Lubrication, and Railing Fittings. Signed on 2005-01-18. Completion date: 2005-05-18.
$8,305 with Defense Logistics Agency for Miscellaneous Power Transmission Equipment. Signed on 2004-11-17. Completion date: 2004-11-17.
MECA, INC (9820 COUNTY ROAD 603C; small business) : $104,529 in 2 contractsin 2000
$54,750 with Army for Endangered Species Studies - Plant and Animal. Taking place in LA. Signed on 2000-09-13. Completion date: 2002-09-08.
$49,779 with Army for Automated Information System Design and Integration Services. Taking place in LA. Signed on 2000-04-21. Completion date: 2002-04-26.
QUEEN'S PEST CONTROL (1817 COUNTY ROAD 529; small business) : $75,686 in 7 contractsfrom 2001 to 2002
Contracts for Insect and Rodent Control Services by Navy Signed by year:2000: $0; 2001: $72,082; 2002: $3,604; 2003: $0; 2004: $0; 2005: $0; 2006: $0.
Biggest contracts:
$42,509 with Navy for Insect and Rodent Control Services. Signed on 2001-01-22. Completion date: 2002-01-31.
$28,324, same as above.Signed on 2001-09-28. Completion date: 2001-10-12.
$3,719, same as above.Signed on 2002-06-26. Completion date: 2002-01-31.
$885, same as above.Signed on 2001-11-11. Completion date: 2002-01-31.
TEXAS COMPRESSOR SERVICE (1545 HOUSTON RD; small business) : $52,612 in 2 contractsfrom 2004 to 2005
$47,984 with Air Force for Maintenance, Repair and Rebuilding of Equipment -- Service and Trade Equipment. Taking place in OK. Signed on 2004-06-18. Completion date: 2004-07-20.
$4,628, same as above.Signed on 2005-05-26. Completion date: 2005-03-21.
PRECISION DYNAMICS, INC (406 N COMMERCE; small business) : $50,167 in 2 contractsin 2005
$43,767 with Navy for Trailers. Taking place in FL. Signed on 2005-06-24. Completion date: 2005-09-01.
$6,400 with Navy for Optical Instruments, Test Equipment, Components and Accessories. Signed on 2005-05-25. Completion date: 2005-06-14.
REEVES & ASSOCIATES (1058 CARDINAL RIDGE RD; small business) : $25,017 in 2 contractsin 2001
$25,017 with Air Force for Maintenance, Repair and Rebuilding of Equipment -- Metalworking Machinery. Taking place in OK. Signed on 2001-09-30. Completion date: 2001-10-31.
$0, same as above.Signed on 2001-09-30. Completion date: 2001-10-31.
CARPENTER, ALISHA LAUGHLIN (1064 SHADY HILL LN; small business) : $14,100 in 2 contractsin 2005
$14,100 with Air Force for Educational Services. Signed on 2005-10-01. Completion date: 2006-09-30.
$0, same as above.Signed on 2005-10-01. Completion date: 2006-09-30.
TADSEN BUILDERS INC (1525 CR 529; small business) : $13,950 in 2 contractsin 2004
$8,950 with Army for Construction of Structures and Facilities -- Tank Automotive Facilities. Signed on 2004-12-15. Completion date: 2005-03-02.
$5,000 with Army for Miscellaneous Construction Materials. Signed on 2004-08-04. Completion date: 2004-09-30.
Top industries in this zip code by the number of employees in 2005:
2002 - 2018 National Fire Incident Reporting System (NFIRS) incidents
According to the data from the years 2002 - 2018 the average number of fires per year is 260. The highest number of reported fires - 417 took place in 2011, and the least - 151 in 2010. The data has an increasing trend.
When looking into fire subcategories, the most reports belonged to: Outside Fires (50.6%), and Structure Fires (35.7%).
Fire incident types reported to NFIRS in Zip Code 76028


 Nearest zip codes: 76140, 76134, 76061, 76123, 76036, 76058.


 According to the data from the years 2002 - 2018 the average number of fires per year is 260. The highest number of reported fires - 417 took place in 2011, and the least - 151 in 2010. The data has an increasing trend.
 When looking into fire subcategories, the most reports belonged to: Outside Fires (50.6%), and Structure Fires (35.7%).