Estimated zip code population in 2022: 45,302 Zip code population in 2010: 38,993 Zip code population in 2000: 39,436
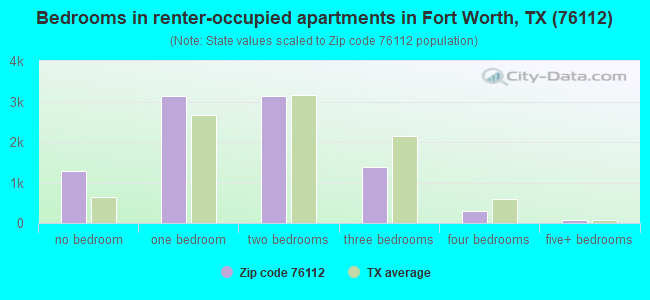
Houses and condos: 19,965 Renter-occupied apartments: 9,149
% of renters here:
51%
State:
38%
March 2022 cost of living index in zip code 76112: 95.2 (near average, U.S. average is 100)
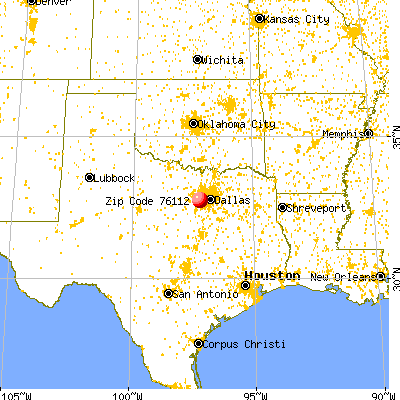
Land area: 11.3 sq. mi. Water area: 0.3 sq. mi.
Population density: 4,000 people per square mile
(average).
OSM Map
General Map
Google Map
MSN Map
OSM Map
General Map
Google Map
MSN Map
OSM Map
General Map
Google Map
MSN Map
OSM Map
General Map
Google Map
MSN Map
Please wait while loading the map...
Real estate property taxes paid for housing units in 2022:
This zip code:
1.4% ($3,123)
Texas:
1.5% ($4,050)
Median real estate property taxes paid for housing units with mortgages in 2022: $3,636 (1.6%) Median real estate property taxes paid for housing units with no mortgage in 2022: $2,466 (1.3%)
Averages for the 2020 tax year for zip code 76112, filed in 2021:
Average Adjusted Gross Income (AGI) in 2020: $42,631 (Individual Income Tax Returns)
Here:
$42,631
State:
$77,054
Salary/wage: $38,615 (reported on 85.1% of returns)
Here:
$38,615
State:
$62,766
(% of AGI for various income ranges: 1228.9% for AGIs below $25k, 3661.4% for AGIs $25k-50k, 6558.7% for AGIs $50k-75k, 9554.4% for AGIs $75k-100k, 16271.1% for AGIs $100k-200k, 72625.7% for AGIs over 200k)
Taxable interest for individuals: $1,989 (reported on 12.6% of returns)
This zip code:
$1,989
Texas:
$2,665
(% of AGI for various income ranges: 4.1% for AGIs below $25k, 6.8% for AGIs $25k-50k, 17.7% for AGIs $50k-75k, 38.0% for AGIs $75k-100k, 109.2% for AGIs $100k-200k, 4052.9% for AGIs over 200k)
Ordinary dividends: $4,923 (reported on 6.8% of returns)
Here:
$4,923
State:
$10,044
(% of AGI for various income ranges: 5.5% for AGIs below $25k, 11.8% for AGIs $25k-50k, 39.6% for AGIs $50k-75k, 66.3% for AGIs $75k-100k, 213.4% for AGIs $100k-200k, 4024.3% for AGIs over 200k)
Net capital gain/loss in AGI: +$17,639 (reported on 6.8% of returns)
Here:
+$17,639
State:
+$39,590
(% of AGI for various income ranges: 3.5% for AGIs below $25k, 6.8% for AGIs $25k-50k, 25.1% for AGIs $50k-75k, 59.2% for AGIs $75k-100k, 525.2% for AGIs $100k-200k, 26198.6% for AGIs over 200k)
Profit/loss from business: +$2,580 (reported on 23.1% of returns)
Here:
+$2,580
State:
+$10,888
(% of AGI for various income ranges: 51.7% for AGIs below $25k, 24.6% for AGIs $25k-50k, 51.4% for AGIs $50k-75k, 206.7% for AGIs $75k-100k, 539.7% for AGIs $100k-200k, 702.9% for AGIs over 200k)
Taxable individual retirement arrangement distribution: $17,905 (reported on 4.4% of returns)
76112:
$17,905
Texas:
$24,740
(% of AGI for various income ranges: 20.8% for AGIs below $25k, 38.9% for AGIs $25k-50k, 128.8% for AGIs $50k-75k, 217.0% for AGIs $75k-100k, 723.9% for AGIs $100k-200k, 4011.4% for AGIs over 200k)
Total itemized deductions: $30,374 (reported on 4.9% of returns)
Here:
$30,374
State:
$40,428
(% of AGI for various income ranges: 21.6% for AGIs below $25k, 89.7% for AGIs $25k-50k, 284.2% for AGIs $50k-75k, 520.5% for AGIs $75k-100k, 953.0% for AGIs $100k-200k, 9140.0% for AGIs over 200k)
Charity contributions: $12,951 (reported on 4.0% of returns)
Here:
$12,951
State:
$18,201
(% of AGI for various income ranges: 3.2% for AGIs below $25k, 25.8% for AGIs $25k-50k, 87.1% for AGIs $50k-75k, 196.2% for AGIs $75k-100k, 378.3% for AGIs $100k-200k, 3954.3% for AGIs over 200k)
Taxes paid: $5,821 (reported on 4.7% of returns)
76112:
$5,821
State:
$7,821
(% of AGI for various income ranges: 3.1% for AGIs below $25k, 17.3% for AGIs $25k-50k, 64.5% for AGIs $50k-75k, 106.5% for AGIs $75k-100k, 195.6% for AGIs $100k-200k, 1118.6% for AGIs over 200k)
Earned income credit: $2,735 (reported on 29.3% of returns)
Here:
$2,735
State:
$2,584
(% of AGI for various income ranges: 158.9% for AGIs below $25k, 89.8% for AGIs $25k-50k, 1.2% for AGIs $50k-75k)
Percentage of individuals using paid preparers for their 2020 taxes: 92.7%
Here:
93%
State:
92%
(% for various income ranges: 92.3% for AGIs below $25k, 93.6% for AGIs $25k-50k, 92.9% for AGIs $50k-75k, 92.4% for AGIs $75k-100k, 90.9% for AGIs $100k-200k, 91.3% for AGIs over 200k)
Averages for the 2012 tax year for zip code 76112, filed in 2013:
Average Adjusted Gross Income (AGI) in 2012: $37,213 (Individual Income Tax Returns)
Here:
$37,213
State:
$65,384
Salary/wage: $33,786 (reported on 85.0% of returns)
Here:
$33,786
State:
$52,524
(% of AGI for various income ranges: 80.6% for AGIs below $25k, 86.8% for AGIs $25k-50k, 79.8% for AGIs $50k-75k, 77.3% for AGIs $75k-100k, 72.9% for AGIs $100k-200k, 50.7% for AGIs over 200k)
Taxable interest for individuals: $2,393 (reported on 15.5% of returns)
This zip code:
$2,393
Texas:
$2,372
(% of AGI for various income ranges: 0.4% for AGIs below $25k, 0.4% for AGIs $25k-50k, 0.5% for AGIs $50k-75k, 0.6% for AGIs $75k-100k, 0.6% for AGIs $100k-200k, 5.6% for AGIs over 200k)
Ordinary dividends: $5,374 (reported on 8.6% of returns)
Here:
$5,374
State:
$9,721
(% of AGI for various income ranges: 0.8% for AGIs below $25k, 0.7% for AGIs $25k-50k, 0.7% for AGIs $50k-75k, 0.8% for AGIs $75k-100k, 1.4% for AGIs $100k-200k, 4.4% for AGIs over 200k)
Net capital gain/loss in AGI: +$4,532 (reported on 6.7% of returns)
Here:
+$4,532
State:
+$35,319
(% of AGI for various income ranges: 0.2% for AGIs $25k-50k, 0.2% for AGIs $50k-75k, 0.3% for AGIs $75k-100k, 0.8% for AGIs $100k-200k, 5.3% for AGIs over 200k)
Profit/loss from business: +$5,163 (reported on 22.0% of returns)
Here:
+$5,163
State:
+$13,732
(% of AGI for various income ranges: 9.1% for AGIs below $25k, 0.5% for AGIs $25k-50k, 1.3% for AGIs $50k-75k, 1.2% for AGIs $75k-100k, 2.8% for AGIs $100k-200k, 3.7% for AGIs over 200k)
Taxable individual retirement arrangement distribution: $14,210 (reported on 6.5% of returns)
76112:
$14,210
Texas:
$19,511
(% of AGI for various income ranges: 1.2% for AGIs below $25k, 1.6% for AGIs $25k-50k, 2.2% for AGIs $50k-75k, 3.2% for AGIs $75k-100k, 3.7% for AGIs $100k-200k, 4.8% for AGIs over 200k)
Self-employment retirement plans: $17,133 (reported on 0.2% of returns)
76112:
$17,133
Texas:
$23,938
Total itemized deductions: $19,085 (24% of AGI, reported on 18.4% of returns)
Here:
$19,085
State:
$24,724
Here:
24.5% of AGI
State:
15.9% of AGI
(% of AGI for various income ranges: 5.2% for AGIs below $25k, 8.7% for AGIs $25k-50k, 11.4% for AGIs $50k-75k, 11.3% for AGIs $75k-100k, 10.2% for AGIs $100k-200k, 12.2% for AGIs over 200k)
Charity contributions: $6,165 (reported on 14.8% of returns)
Here:
$6,165
State:
$6,808
(% of AGI for various income ranges: 0.7% for AGIs below $25k, 1.7% for AGIs $25k-50k, 2.8% for AGIs $50k-75k, 2.9% for AGIs $75k-100k, 3.3% for AGIs $100k-200k, 5.0% for AGIs over 200k)
Taxes paid: $4,453 (reported on 17.8% of returns)
76112:
$4,453
State:
$6,921
(% of AGI for various income ranges: 0.8% for AGIs below $25k, 1.8% for AGIs $25k-50k, 2.4% for AGIs $50k-75k, 2.9% for AGIs $75k-100k, 2.8% for AGIs $100k-200k, 3.0% for AGIs over 200k)
Earned income credit: $2,804 (reported on 35.6% of returns)
Here:
$2,804
State:
$2,570
(% of AGI for various income ranges: 12.4% for AGIs below $25k, 1.5% for AGIs $25k-50k)
Percentage of individuals using paid preparers for their 2012 taxes: 56.0%
Here:
56%
State:
51%
(% for various income ranges: 58.7% for AGIs below $25k, 53.6% for AGIs $25k-50k, 50.0% for AGIs $50k-75k, 51.1% for AGIs $75k-100k, 53.9% for AGIs $100k-200k, 77.8% for AGIs over 200k)
Averages for the 2004 tax year for zip code 76112, filed in 2005:
Average Adjusted Gross Income (AGI) in 2004: $35,169 (Individual Income Tax Returns)
Here:
$35,169
State:
$47,881
Salary/wage: $31,449 (reported on 87.2% of returns)
Here:
$31,449
State:
$41,947
(% of AGI for various income ranges: 102.9% for AGIs below $10k, 89.3% for AGIs $10k-25k, 87.5% for AGIs $25k-50k, 80.4% for AGIs $50k-75k, 75.9% for AGIs $75k-100k, 57.3% for AGIs over 100k)
Taxable interest for individuals: $2,448 (reported on 24.3% of returns)
This zip code:
$2,448
Texas:
$2,255
(% of AGI for various income ranges: 2.5% for AGIs below $10k, 1.0% for AGIs $10k-25k, 0.9% for AGIs $25k-50k, 1.2% for AGIs $50k-75k, 1.8% for AGIs $75k-100k, 3.2% for AGIs over 100k)
Taxable dividends: $2,633 (reported on 12.4% of returns)
Here:
$2,633
State:
$4,261
(% of AGI for various income ranges: 0.9% for AGIs below $10k, 0.5% for AGIs $10k-25k, 0.5% for AGIs $25k-50k, 0.6% for AGIs $50k-75k, 0.9% for AGIs $75k-100k, 2.0% for AGIs over 100k)
Net capital gain/loss: +$9,234 (reported on 10.3% of returns)
Here:
+$9,234
State:
+$16,110
(% of AGI for various income ranges: -1.0% for AGIs below $10k, 0.0% for AGIs $10k-25k, -0.1% for AGIs $25k-50k, 0.6% for AGIs $50k-75k, 0.8% for AGIs $75k-100k, 10.0% for AGIs over 100k)
Profit/loss from business: +$3,908 (reported on 15.8% of returns)
Here:
+$3,908
State:
+$11,013
(% of AGI for various income ranges: 4.0% for AGIs below $10k, 0.7% for AGIs $10k-25k, 0.6% for AGIs $25k-50k, 1.2% for AGIs $50k-75k, 2.2% for AGIs $75k-100k, 3.7% for AGIs over 100k)
IRA payment deduction: $2,805 (reported on 1.7% of returns)
76112:
$2,805
Texas:
$3,120
(% of AGI for various income ranges: 0.1% for AGIs $10k-25k, 0.2% for AGIs $25k-50k, 0.2% for AGIs $50k-75k, 0.2% for AGIs $75k-100k, 0.1% for AGIs over 100k)
Self-employed pension: $15,444 (reported on 0.3% of returns)
Here:
$15,444
Texas:
$16,401
Total itemized deductions: $16,583 (25% of AGI, reported on 22.1% of returns)
Here:
$16,583
State:
$19,631
Here:
24.6% of AGI
State:
18.9% of AGI
(% of AGI for various income ranges: 6.2% for AGIs below $10k, 6.0% for AGIs $10k-25k, 11.2% for AGIs $25k-50k, 12.9% for AGIs $50k-75k, 12.8% for AGIs $75k-100k, 10.0% for AGIs over 100k)
Charity contributions deductions: $4,979 (7% of AGI, reported on 19.1% of returns)
Here:
$4,979
State:
$4,753
Here:
7.0% of AGI
State:
4.2% of AGI
(% of AGI for various income ranges: 0.6% for AGIs below $10k, 1.0% for AGIs $10k-25k, 2.3% for AGIs $25k-50k, 3.1% for AGIs $50k-75k, 3.5% for AGIs $75k-100k, 3.8% for AGIs over 100k)
Total tax: $5,560 (reported on 63.1% of returns)
76112:
$5,560
State:
$9,058
(% of AGI for various income ranges: 3.0% for AGIs below $10k, 2.9% for AGIs $10k-25k, 6.3% for AGIs $25k-50k, 9.6% for AGIs $50k-75k, 11.7% for AGIs $75k-100k, 18.5% for AGIs over 100k)
Earned income credit: $2,078 (reported on 32.4% of returns)
Here:
$2,078
State:
$2,024
Percentage of individuals using paid preparers for their 2004 taxes: 61.3%
Here:
61%
State:
57%
(% for various income ranges: 58.3% for AGIs below $10k, 69.9% for AGIs $10k-25k, 57.4% for AGIs $25k-50k, 53.2% for AGIs $50k-75k, 56.7% for AGIs $75k-100k, 58.2% for AGIs over 100k)
Likely homosexual households (counted as self-reported same-sex unmarried-partner households)
Lesbian couples: 0.2% of all households
Gay men: 0.3% of all households
Household received Food Stamps/SNAP in the past 12 months: 3,624 Household did not receive Food Stamps/SNAP in the past 12 months: 14,529
Women who had a birth in the past 12 months: 893 (346 now married, 530 unmarried) Women who did not have a birth in the past 12 months: 11,191 (3,667 now married, 7,563 unmarried)
Housing units in zip code 76112 with a mortgage: 5,420 (174 second mortgage, 15 home equity loan, 149 both second mortgage and home equity loan) Houses without a mortgage: 109
Median monthly owner costs for units with a mortgage: $1,574 Median monthly owner costs for units without a mortgage: $653
Residents with income below the poverty level in 2022:
This zip code:
20.1%
Whole state:
14.0%
Residents with income below 50% of the poverty level in 2022:
This zip code:
10.6%
Whole state:
7.4%
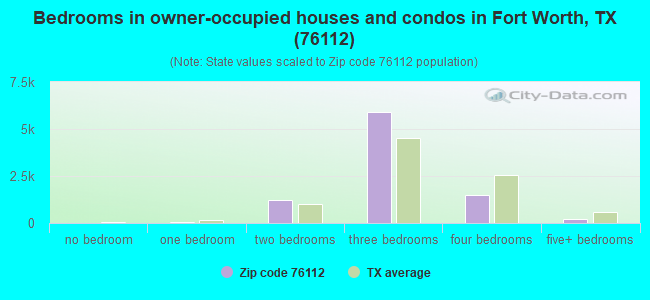
Median number of rooms in houses and condos:
Here:
6.1
State:
6.3
Median number of rooms in apartments:
Here:
3.8
State:
4.0
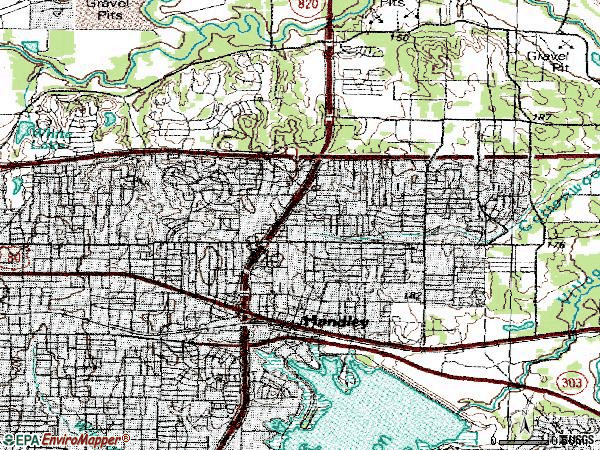
Notable locations in this zip code not listed on our city pages
Notable locations in zip code 76112: Meadowbrook Municipal Golf Course (A), Fort Worth Fire Department Station 20 (B), Fort Worth Fire Department Station 24 (C). Display/hide their locations on the map
Churches in zip code 76112 include: Saint Peter Church (A), Seminary Bible Fellowship Church (B), New Life Deaf Fellowship Church (C), Meadowbrook East Bible Chapel Church (D), Meadowbrook First Baptist Church (E), Sandy Lane Baptist Church (F), New Victorious Baptist Church (G), Ryanwood Baptist Church (H), Providence Baptist Church (I). Display/hide their locations on the map
4,771 married couples with children.
5,879 single-parent households (1,235 men, 4,644 women).
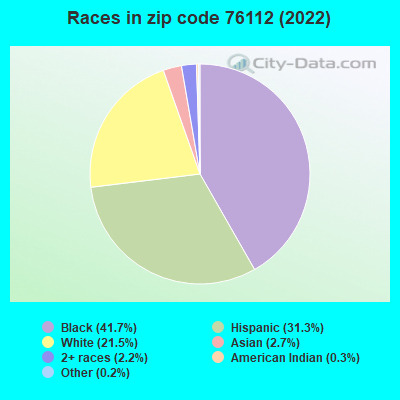
69.8% of residents of 76112 zip code speak English at home.
26.2% of residents speak Spanish at home (62% very well, 19% well, 10% not well, 9% not at all).
1.6% of residents speak other Indo-European language at home (89% very well, 6% well, 5% not well).
1.5% of residents speak Asian or Pacific Island language at home (51% very well, 34% well, 11% not well, 4% not at all).
0.6% of residents speak other language at home (70% very well, 30% well).
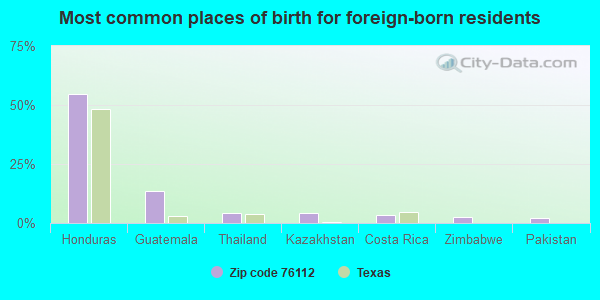
Foreign born population: 6,271 (13.8%) (40.6% of them are naturalized citizens)
Facilities with environmental interests located in this zip code:
AEROSPACE TECHNOLOGIES INC (7445 EAST LANCASTER AVENUE in FORT WORTH, TX)
AIR MINOR (AIRS/AFS) COMPLIANCE ACTIVITY (Tracking inspections of insecticide, fungicide, and rodenticide, and toxic substances) CRITERIA AND HAZARDOUS AIR POLLUTANT INVENTORY (Inventory of air pollution sources) HAZARDOUS WASTE BIENNIAL REPORTER (Resource Conservation and Recovery Act (tracking hazardous waste)) Large Quantity Generators, more that 1000 kg of hazardous waste/month (Resource Conservation and Recovery Act (tracking hazardous waste)) - notification TRI REPORTER (Tracking of toxic chemicals releasing facilities) Business SIC classification: INDUSTRIAL TRUCKS, TRACTORS, TRAILERS, AND STACKERS; AIRCRAFT ENGINES AND ENGINE PARTS; AIRCRAFT PARTS AND AUXILIARY EQUIPMENT; GUIDED MISSILE AND SPACE VEHICLE PARTS AND AUXILIARY EQUIPMENT Business NAICS classification: OTHER AIRCRAFT PARTS AND AUXILIARY EQUIPMENT MANUFACTURING. Alternative names: AEORSPACE TECHS. INC.
ATWOOD MCDONALD EL (1850 BARRON LN in FORT WORTH, TX)
(National Center for Education Statistics) - STATE ID-220905188 Organizations: FORT WORTH ISD (SCHOOL DISTRICT)
ACQUISITIONS UNLIMITED INC (5839 ROSEDALE in FORT WORTH, TX)
(Resource Conservation and Recovery Act (tracking hazardous waste)) Alternative names: VAN WATERS & ROGERS
AEROSPACE OPTICS INC (3201 SANDY LN in FORT WORTH, TX)
(Resource Conservation and Recovery Act (tracking hazardous waste)) Business NAICS classification: OTHER AIRCRAFT PARTS AND AUXILIARY EQUIPMENT MANUFACTURING.
AEROSPACE TECHNOLOGIES INC (5965 E ROSEDALE ST in FORT WORTH, TX)
(Resource Conservation and Recovery Act (tracking hazardous waste))
ALCON LABORATORIES INC (5927 E ROSEDALE ST in FORT WORTH, TX)
(Resource Conservation and Recovery Act (tracking hazardous waste))
AVIATION PRODUCTS INC (5621 E ROSEDALE ST in FORT WORTH, TX)
(Resource Conservation and Recovery Act (tracking hazardous waste))
ACUSHNET CO (7445 E LANCASTER SUITE B in FORT WORTH, TX)
Large Quantity Generators, more that 1000 kg of hazardous waste/month (Resource Conservation and Recovery Act (tracking hazardous waste)) - notification
ARTWARY CLEANERS (1862 HANLEY DRIFE in FORT WORTH, TX)
AIR MINOR (AIRS/AFS) Business SIC classification: DRYCLEANING PLANTS, EXCEPT RUG CLEANING
Housing units lacking complete plumbing facilities: 1.4% Housing units lacking complete kitchen facilities: 2.3%
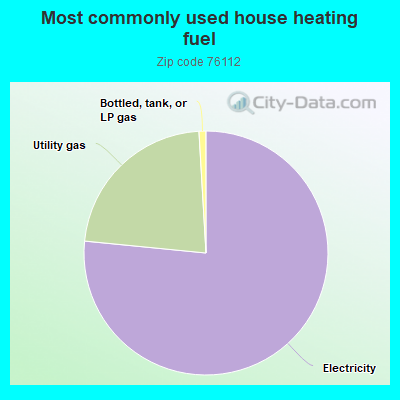
76.1%Electricity
22.4%Utility gas
0.9%Bottled, tank, or LP gas
Population in 1990: 35,311. Population change in the 1990s: +4,125 (+11.7%).
Place of birth for U.S.-born residents:
This state: 27,979
Northeast: 727
Midwest: 2,800
South: 3,780
West: 2,819
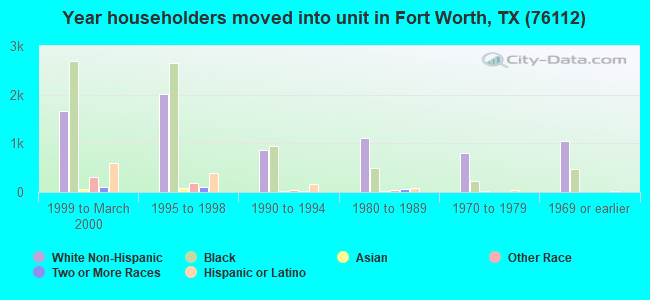
46% of the 76112 zip code residents lived in the same house 5 years ago. Out of people who lived in different houses, 70% lived in this county. Out of people who lived in different counties, 50% lived in Texas.
82% of the 76112 zip code residents lived in the same house 1 year ago. Out of people who lived in different houses, 63% moved from this county. Out of people who lived in different houses, 18% moved from different county within same state. Out of people who lived in different houses, 12% moved from different state. Out of people who lived in different houses, 5% moved from abroad.
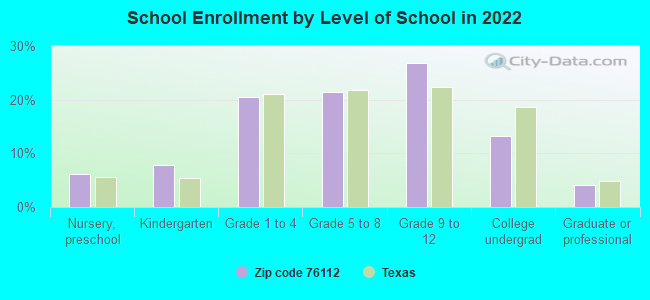
Private vs. public school enrollment:
Students in private schools in grades 1 to 8 (elementary and middle school): 298
Here:
6.1%
Texas:
8.8%
Students in private schools in grades 9 to 12 (high school): 172
Here:
5.5%
Texas:
8.0%
Students in private undergraduate colleges: 383
Here:
24.5%
Texas:
16.2%
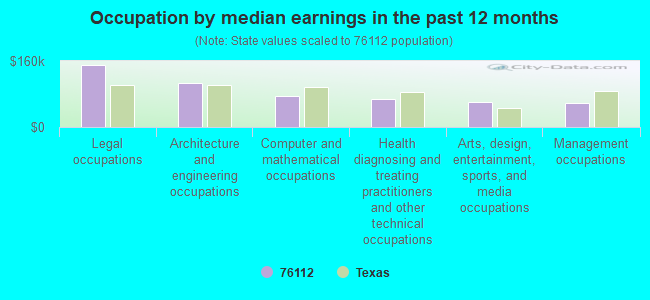
Occupation by median earnings in the past 12 months ($)
151,323Legal occupations
105,600Architecture and engineering occupations
74,655Computer and mathematical occupations
67,036Health diagnosing and treating practitioners and other technical occupations
61,298Arts, design, entertainment, sports, and media occupations
57,177Management occupations
Companies with biggest federal contracts located in this zip code (FORT WORTH, TX):
RAMM DEFENSE PRODUCTS INC (3161 MAJOR ST STE D; small business) : $661,476 in 75 contractsfrom 2001 to 2006
Contracts for Airframe Structural Components, Bearings, Antifriction, Unmounted, Bushings, Rings, Shims, and Spacers, Miscellaneous Power Transmission Equipment, and moreby Defense Logistics Agency Signed by year:2000: $0; 2001: $121,410; 2002: $26,900; 2003: $0; 2004: $76,307; 2005: $225,459; 2006: $211,400.
Biggest contracts:
$113,855 with Defense Logistics Agency for Airframe Structural Components. Signed on 2006-03-17. Completion date: 2006-07-06.
$65,798 with Defense Logistics Agency for Bearings, Antifriction, Unmounted. Signed on 2001-02-09. Completion date: 2001-09-07.
$55,612 with Defense Logistics Agency for Bushings, Rings, Shims, and Spacers. Signed on 2001-02-20. Completion date: 2001-06-20.
$33,277 with Defense Logistics Agency for Miscellaneous Power Transmission Equipment. Signed on 2005-12-09. Completion date: 2006-04-07.
AEROSPACE TECHNOLOGIES INC (7445 E LANCASTER AVE; small business) : $558,644 in 12 contractsfrom 2000 to 2003
Contracts for Airframe Structural Components by Air Force, Defense Logistics Agency Signed by year:2000: $320,648; 2001: $72,718; 2002: $25,474; 2003: $139,804; 2004: $0; 2005: $0; 2006: $0.
Biggest contracts:
$139,804 with Air Force for Airframe Structural Components. Signed on 2003-05-14. Completion date: 2003-10-31.
$56,011 with Defense Logistics Agency for Airframe Structural Components. Signed on 2000-08-14. Completion date: 2001-01-24.
$52,706, same as above.Signed on 2000-07-14. Completion date: 2001-01-18.
$44,723, same as above.Signed on 2000-08-20. Completion date: 2001-02-26.
AVIATION PRODUCTS INC (5621 E ROSEDALE ST; small business) : $464,900 in 18 contractsfrom 2001 to 2006
Contracts for Airframe Structural Components, Paints, Dopes, Varnishes, and Related Products, Preservative and Sealing Compounds, Helicopter Rotor Blades, Drive Mechanisms and Components, and moreby Defense Logistics Agency, Army, Navy, Federal Supply Service, and others Signed by year:2000: $0; 2001: $33,646; 2002: $95,574; 2003: $42,182; 2004: $156,185; 2005: $84,240; 2006: $53,073.
Biggest contracts:
$88,449 with Defense Logistics Agency for Airframe Structural Components. Signed on 2002-06-14. Completion date: 2002-09-07.
$49,052, same as above.Signed on 2004-10-29. Completion date: 2004-11-28.
$45,661, same as above.Signed on 2005-07-29. Completion date: 2005-08-25.
$41,754, same as above.Signed on 2003-12-23. Completion date: 2004-04-15.
INTERNATIONAL FORD GROUP, L L (6050 FOREST RIVER DR; small business) : $390,806 in 3 contractsfrom 2004 to 2006
$312,474 with Air Force for Communications Services. Signed on 2004-10-01. Completion date: 2005-09-30.
$41,584 with Air Force for Other Management Support Services. Signed on 2006-06-20. Completion date: 2006-12-31.
$36,748, same as above.Signed on 2006-06-01. Completion date: 2006-12-31.
ROOF TECHNICAL SERVICES INC (1944 HANDLEY DR; small business) : $202,762 in 16 contractsfrom 1999 to 2003
Contracts for Administrative and Service Buildings, Industrial Buildings, Architect - Engineer Services (including landscaping, interior layout, and designing) by Public Buildings Service, Air Force Signed by year:2000: $62,000; 2001: $88,000; 2002: $22,000; 2003: $28,762; 2004: $0; 2005: $0; 2006: $0.
Biggest contracts:
$82,000 with Public Buildings Service for Administrative and Service Buildings. Signed on 2001-03-15. Completion date: 2001-09-15.
$33,000, same as above.Signed on 2000-08-15. Completion date: 2001-02-15.
$24,161 with Air Force for Industrial Buildings. Taking place in NM. Signed on 2003-08-29. Completion date: 2003-12-08.
$22,000 with Public Buildings Service for Administrative and Service Buildings. Signed on 2002-05-15. Completion date: 2002-11-15.
SPEC FASTENERS, INC (3116 HAYNIE ST STE B; small business) : $144,034 in 23 contractsin 2005
Contracts for Bushings, Rings, Shims, and Spacers, Bolts, Coil, Flat, Leaf, and Wire Springs, Hardware, Commercial, and moreby Defense Logistics Agency Signed by year:2000: $0; 2001: $0; 2002: $0; 2003: $0; 2004: $0; 2005: $144,034; 2006: $0.
Biggest contracts:
$18,216 with Defense Logistics Agency for Bushings, Rings, Shims, and Spacers. Signed on 2005-03-02. Completion date: 2005-06-01.
$17,085, same as above.Signed on 2005-03-25. Completion date: 2005-06-24.
$10,428, same as above.Signed on 2005-03-25. Completion date: 2005-07-14.
$9,005, same as above.Signed on 2005-04-19. Completion date: 2005-10-23.
L N AEROSPACE INC (6011 TENSION DR; small business) : $28,569 in 2 contractsfrom 2002 to 2004
$25,488 with Defense Logistics Agency for Vehicular Furniture and Accessories. Signed on 2002-09-13. Completion date: 2002-11-12.
$3,081 with Defense Logistics Agency for Hose and Flexible Tubing. Signed on 2004-10-01. Completion date: 2005-09-30.
WASTE-WATER, INC (5005 BRENTWOOD STAIR RD; small business) : $25,000 in 2 contractsin 1999
$25,000 with Navy for Maintenance, Repair or Alteration of Real Property -- Sewage and Waste Facilities. Signed on 1999-10-01. Completion date: 1999-09-17.
$0, same as above.Signed on 1999-10-01. Completion date: 1999-09-17.
GOLF WORLD UNLIMITED INC (1100 E LOOP 820 S; small business)
$19,717 with Air Force for Passenger Motor Vehicles. Signed on 2005-09-30. Completion date: 2005-11-18.
MARCUS B FREY (6709 YOLANDA DRIVE)
$7,663 with Army for Tire Rebuilding and Tire and Tube Repair Materials. Signed on 2005-04-06. Completion date: 2005-04-29.
Top industries in this zip code by the number of employees in 2005:
Health Care and Social Assistance: Home Health Care Services (100-249 employees: 2 establishments, 20-49 employees: 3 establishments, 10-19 employees: 2 establishments)
Real Estate and Rental and Leasing: Residential Property Managers (250-499: 1, 10-19: 1, 5-9: 1, 1-4: 3)
2002 - 2017 National Fire Incident Reporting System (NFIRS) incidents
Based on the data from the years 2002 - 2017 the average number of fires per year is 212. The highest number of reported fires - 303 took place in 2006, and the least - 16 in 2017. The data has a declining trend.
When looking into fire subcategories, the most incidents belonged to: Outside Fires (39.6%), and Structure Fires (35.2%).
Fire incident types reported to NFIRS in Zip Code 76112


 Nearest zip codes: 76120, 76103, 76105, 76118, 76016, 76013.
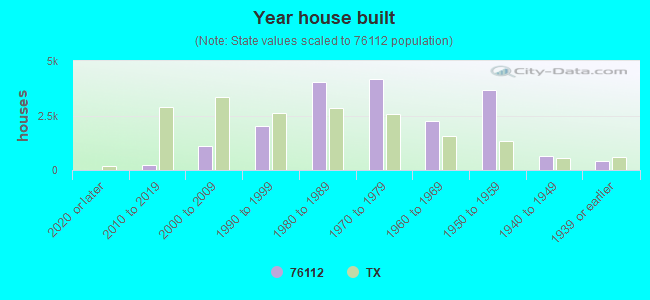


 Based on the data from the years 2002 - 2017 the average number of fires per year is 212. The highest number of reported fires - 303 took place in 2006, and the least - 16 in 2017. The data has a declining trend.
 When looking into fire subcategories, the most incidents belonged to: Outside Fires (39.6%), and Structure Fires (35.2%).