Estimated zip code population in 2022: 50,555 Zip code population in 2010: 46,746 Zip code population in 2000: 45,343
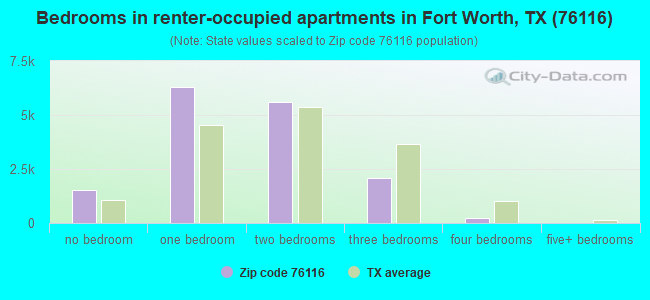
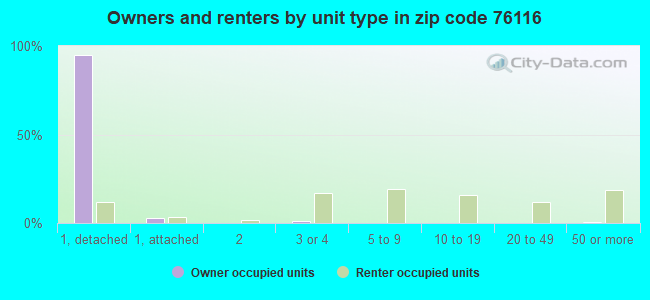
Houses and condos: 26,225 Renter-occupied apartments: 15,616
% of renters here:
67%
State:
38%
March 2022 cost of living index in zip code 76116: 97.8 (near average, U.S. average is 100)
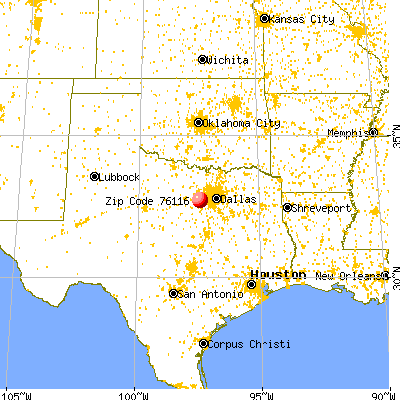
Land area: 12.2 sq. mi. Water area: 0.0 sq. mi.
Population density: 4,158 people per square mile
(average).
OSM Map
General Map
Google Map
MSN Map
OSM Map
General Map
Google Map
MSN Map
OSM Map
General Map
Google Map
MSN Map
OSM Map
General Map
Google Map
MSN Map
Please wait while loading the map...
Real estate property taxes paid for housing units in 2022:
This zip code:
1.4% ($4,686)
Texas:
1.5% ($4,050)
Median real estate property taxes paid for housing units with mortgages in 2022: $5,880 (1.6%) Median real estate property taxes paid for housing units with no mortgage in 2022: $3,856 (1.4%)
Averages for the 2020 tax year for zip code 76116, filed in 2021:
Average Adjusted Gross Income (AGI) in 2020: $67,305 (Individual Income Tax Returns)
Here:
$67,305
State:
$77,054
Salary/wage: $52,401 (reported on 83.1% of returns)
Here:
$52,401
State:
$62,766
(% of AGI for various income ranges: 1242.5% for AGIs below $25k, 3583.7% for AGIs $25k-50k, 6492.5% for AGIs $50k-75k, 9379.3% for AGIs $75k-100k, 17349.3% for AGIs $100k-200k, 79783.5% for AGIs over 200k)
Taxable interest for individuals: $3,015 (reported on 21.1% of returns)
This zip code:
$3,015
Texas:
$2,665
(% of AGI for various income ranges: 8.5% for AGIs below $25k, 13.1% for AGIs $25k-50k, 43.8% for AGIs $50k-75k, 57.8% for AGIs $75k-100k, 182.9% for AGIs $100k-200k, 2840.0% for AGIs over 200k)
Ordinary dividends: $14,278 (reported on 16.1% of returns)
Here:
$14,278
State:
$10,044
(% of AGI for various income ranges: 17.0% for AGIs below $25k, 31.3% for AGIs $25k-50k, 89.6% for AGIs $50k-75k, 216.6% for AGIs $75k-100k, 623.9% for AGIs $100k-200k, 11335.6% for AGIs over 200k)
Net capital gain/loss in AGI: +$28,076 (reported on 15.1% of returns)
Here:
+$28,076
State:
+$39,590
(% of AGI for various income ranges: 6.6% for AGIs below $25k, 18.5% for AGIs $25k-50k, 82.2% for AGIs $50k-75k, 235.1% for AGIs $75k-100k, 700.7% for AGIs $100k-200k, 24830.3% for AGIs over 200k)
Profit/loss from business: +$14,488 (reported on 18.7% of returns)
Here:
+$14,488
State:
+$10,888
(% of AGI for various income ranges: 98.4% for AGIs below $25k, 77.6% for AGIs $25k-50k, 187.4% for AGIs $50k-75k, 376.3% for AGIs $75k-100k, 869.0% for AGIs $100k-200k, 9689.7% for AGIs over 200k)
Taxable individual retirement arrangement distribution: $24,457 (reported on 7.0% of returns)
76116:
$24,457
Texas:
$24,740
(% of AGI for various income ranges: 26.7% for AGIs below $25k, 54.4% for AGIs $25k-50k, 159.0% for AGIs $50k-75k, 377.5% for AGIs $75k-100k, 1036.1% for AGIs $100k-200k, 4262.4% for AGIs over 200k)
Self-employed (Keogh) retirement plans: $26,900 (reported on 0.5% of returns)
76116:
$26,900
Texas:
$29,298
(% of AGI for various income ranges: 51.1% for AGIs $100k-200k, 765.9% for AGIs over 200k)
Total itemized deductions: $36,297 (reported on 6.8% of returns)
Here:
$36,297
State:
$40,428
(% of AGI for various income ranges: 25.8% for AGIs below $25k, 88.5% for AGIs $25k-50k, 235.0% for AGIs $50k-75k, 393.8% for AGIs $75k-100k, 1134.9% for AGIs $100k-200k, 8140.3% for AGIs over 200k)
Charity contributions: $14,355 (reported on 5.6% of returns)
Here:
$14,355
State:
$18,201
(% of AGI for various income ranges: 2.7% for AGIs below $25k, 12.8% for AGIs $25k-50k, 46.2% for AGIs $50k-75k, 87.0% for AGIs $75k-100k, 293.0% for AGIs $100k-200k, 3592.9% for AGIs over 200k)
Taxes paid: $7,585 (reported on 6.7% of returns)
76116:
$7,585
State:
$7,821
(% of AGI for various income ranges: 5.8% for AGIs below $25k, 14.6% for AGIs $25k-50k, 54.2% for AGIs $50k-75k, 92.1% for AGIs $75k-100k, 299.7% for AGIs $100k-200k, 1400.3% for AGIs over 200k)
Earned income credit: $2,572 (reported on 22.3% of returns)
Here:
$2,572
State:
$2,584
(% of AGI for various income ranges: 130.4% for AGIs below $25k, 77.9% for AGIs $25k-50k, 1.2% for AGIs $50k-75k)
Percentage of individuals using paid preparers for their 2020 taxes: 92.6%
Here:
93%
State:
92%
(% for various income ranges: 92.2% for AGIs below $25k, 93.6% for AGIs $25k-50k, 93.1% for AGIs $50k-75k, 90.8% for AGIs $75k-100k, 92.3% for AGIs $100k-200k, 91.4% for AGIs over 200k)
Averages for the 2012 tax year for zip code 76116, filed in 2013:
Average Adjusted Gross Income (AGI) in 2012: $61,302 (Individual Income Tax Returns)
Here:
$61,302
State:
$65,384
Salary/wage: $44,894 (reported on 82.8% of returns)
Here:
$44,894
State:
$52,524
(% of AGI for various income ranges: 80.1% for AGIs below $25k, 83.4% for AGIs $25k-50k, 75.0% for AGIs $50k-75k, 68.5% for AGIs $75k-100k, 65.8% for AGIs $100k-200k, 35.8% for AGIs over 200k)
Taxable interest for individuals: $5,547 (reported on 26.2% of returns)
This zip code:
$5,547
Texas:
$2,372
(% of AGI for various income ranges: 0.8% for AGIs below $25k, 0.5% for AGIs $25k-50k, 0.8% for AGIs $50k-75k, 1.1% for AGIs $75k-100k, 1.2% for AGIs $100k-200k, 5.1% for AGIs over 200k)
Ordinary dividends: $10,198 (reported on 17.7% of returns)
Here:
$10,198
State:
$9,721
(% of AGI for various income ranges: 1.4% for AGIs below $25k, 0.8% for AGIs $25k-50k, 1.7% for AGIs $50k-75k, 2.1% for AGIs $75k-100k, 2.5% for AGIs $100k-200k, 5.2% for AGIs over 200k)
Net capital gain/loss in AGI: +$24,051 (reported on 14.7% of returns)
Here:
+$24,051
State:
+$35,319
(% of AGI for various income ranges: 0.1% for AGIs below $25k, 0.2% for AGIs $25k-50k, 0.6% for AGIs $50k-75k, 1.1% for AGIs $75k-100k, 1.9% for AGIs $100k-200k, 14.8% for AGIs over 200k)
Profit/loss from business: +$17,334 (reported on 17.5% of returns)
Here:
+$17,334
State:
+$13,732
(% of AGI for various income ranges: 7.9% for AGIs below $25k, 3.3% for AGIs $25k-50k, 3.6% for AGIs $50k-75k, 3.3% for AGIs $75k-100k, 5.9% for AGIs $100k-200k, 5.3% for AGIs over 200k)
Taxable individual retirement arrangement distribution: $17,676 (reported on 9.9% of returns)
76116:
$17,676
Texas:
$19,511
(% of AGI for various income ranges: 1.7% for AGIs below $25k, 1.9% for AGIs $25k-50k, 3.1% for AGIs $50k-75k, 4.1% for AGIs $75k-100k, 4.4% for AGIs $100k-200k, 2.3% for AGIs over 200k)
Self-employment retirement plans: $22,480 (reported on 0.7% of returns)
76116:
$22,480
Texas:
$23,938
(% of AGI for various income ranges: 0.3% for AGIs $100k-200k, 0.5% for AGIs over 200k)
Total itemized deductions: $25,839 (16% of AGI, reported on 21.0% of returns)
Here:
$25,839
State:
$24,724
Here:
15.9% of AGI
State:
15.9% of AGI
(% of AGI for various income ranges: 5.1% for AGIs below $25k, 6.7% for AGIs $25k-50k, 9.1% for AGIs $50k-75k, 9.2% for AGIs $75k-100k, 10.7% for AGIs $100k-200k, 9.6% for AGIs over 200k)
Charity contributions: $7,454 (reported on 16.7% of returns)
Here:
$7,454
State:
$6,808
(% of AGI for various income ranges: 0.5% for AGIs below $25k, 0.7% for AGIs $25k-50k, 1.5% for AGIs $50k-75k, 1.9% for AGIs $75k-100k, 2.4% for AGIs $100k-200k, 3.0% for AGIs over 200k)
Taxes paid: $7,065 (reported on 20.4% of returns)
76116:
$7,065
State:
$6,921
(% of AGI for various income ranges: 1.0% for AGIs below $25k, 1.5% for AGIs $25k-50k, 2.3% for AGIs $50k-75k, 2.8% for AGIs $75k-100k, 3.7% for AGIs $100k-200k, 2.3% for AGIs over 200k)
Earned income credit: $2,473 (reported on 21.9% of returns)
Here:
$2,473
State:
$2,570
(% of AGI for various income ranges: 7.9% for AGIs below $25k, 1.0% for AGIs $25k-50k)
Percentage of individuals using paid preparers for their 2012 taxes: 52.9%
Here:
53%
State:
51%
(% for various income ranges: 53.9% for AGIs below $25k, 50.8% for AGIs $25k-50k, 48.8% for AGIs $50k-75k, 48.2% for AGIs $75k-100k, 53.3% for AGIs $100k-200k, 77.2% for AGIs over 200k)
Averages for the 2004 tax year for zip code 76116, filed in 2005:
Average Adjusted Gross Income (AGI) in 2004: $46,536 (Individual Income Tax Returns)
Here:
$46,536
State:
$47,881
Salary/wage: $39,416 (reported on 81.6% of returns)
Here:
$39,416
State:
$41,947
(% of AGI for various income ranges: 178.5% for AGIs below $10k, 80.9% for AGIs $10k-25k, 81.5% for AGIs $25k-50k, 74.5% for AGIs $50k-75k, 70.4% for AGIs $75k-100k, 55.0% for AGIs over 100k)
Taxable interest for individuals: $2,693 (reported on 35.9% of returns)
This zip code:
$2,693
Texas:
$2,255
(% of AGI for various income ranges: 15.6% for AGIs below $10k, 2.1% for AGIs $10k-25k, 1.5% for AGIs $25k-50k, 2.1% for AGIs $50k-75k, 1.9% for AGIs $75k-100k, 2.1% for AGIs over 100k)
Taxable dividends: $5,353 (reported on 22.7% of returns)
Here:
$5,353
State:
$4,261
(% of AGI for various income ranges: 8.0% for AGIs below $10k, 1.2% for AGIs $10k-25k, 1.1% for AGIs $25k-50k, 1.5% for AGIs $50k-75k, 1.7% for AGIs $75k-100k, 4.3% for AGIs over 100k)
Net capital gain/loss: +$12,801 (reported on 18.9% of returns)
Here:
+$12,801
State:
+$16,110
(% of AGI for various income ranges: -0.4% for AGIs below $10k, 0.5% for AGIs $10k-25k, 0.3% for AGIs $25k-50k, 0.7% for AGIs $50k-75k, 1.3% for AGIs $75k-100k, 11.8% for AGIs over 100k)
Profit/loss from business: +$13,152 (reported on 14.8% of returns)
Here:
+$13,152
State:
+$11,013
(% of AGI for various income ranges: 10.8% for AGIs below $10k, 3.9% for AGIs $10k-25k, 2.1% for AGIs $25k-50k, 2.2% for AGIs $50k-75k, 3.0% for AGIs $75k-100k, 6.2% for AGIs over 100k)
IRA payment deduction: $3,084 (reported on 2.1% of returns)
76116:
$3,084
Texas:
$3,120
(% of AGI for various income ranges: 0.7% for AGIs below $10k, 0.1% for AGIs $10k-25k, 0.2% for AGIs $25k-50k, 0.1% for AGIs $50k-75k, 0.2% for AGIs $75k-100k, 0.1% for AGIs over 100k)
Self-employed pension: $15,906 (reported on 0.7% of returns)
Here:
$15,906
Texas:
$16,401
(% of AGI for various income ranges: 0.1% for AGIs $10k-25k, 0.1% for AGIs $50k-75k, 0.2% for AGIs $75k-100k, 0.5% for AGIs over 100k)
Total itemized deductions: $18,387 (18% of AGI, reported on 22.2% of returns)
Here:
$18,387
State:
$19,631
Here:
18.1% of AGI
State:
18.9% of AGI
(% of AGI for various income ranges: 19.6% for AGIs below $10k, 5.8% for AGIs $10k-25k, 7.3% for AGIs $25k-50k, 9.4% for AGIs $50k-75k, 10.1% for AGIs $75k-100k, 9.4% for AGIs over 100k)
Charity contributions deductions: $4,661 (4% of AGI, reported on 18.6% of returns)
Here:
$4,661
State:
$4,753
Here:
4.2% of AGI
State:
4.2% of AGI
(% of AGI for various income ranges: 1.2% for AGIs below $10k, 0.7% for AGIs $10k-25k, 1.1% for AGIs $25k-50k, 1.6% for AGIs $50k-75k, 2.2% for AGIs $75k-100k, 2.6% for AGIs over 100k)
Total tax: $8,571 (reported on 72.8% of returns)
76116:
$8,571
State:
$9,058
(% of AGI for various income ranges: 7.3% for AGIs below $10k, 3.8% for AGIs $10k-25k, 7.4% for AGIs $25k-50k, 10.6% for AGIs $50k-75k, 12.3% for AGIs $75k-100k, 20.4% for AGIs over 100k)
Earned income credit: $1,894 (reported on 18.8% of returns)
Here:
$1,894
State:
$2,024
Percentage of individuals using paid preparers for their 2004 taxes: 55.7%
Here:
56%
State:
57%
(% for various income ranges: 53.1% for AGIs below $10k, 61.1% for AGIs $10k-25k, 52.4% for AGIs $25k-50k, 52.2% for AGIs $50k-75k, 50.7% for AGIs $75k-100k, 62.4% for AGIs over 100k)
Likely homosexual households (counted as self-reported same-sex unmarried-partner households)
Lesbian couples: 0.2% of all households
Gay men: 0.1% of all households
Household received Food Stamps/SNAP in the past 12 months: 3,554 Household did not receive Food Stamps/SNAP in the past 12 months: 19,891
Women who had a birth in the past 12 months: 1,099 (563 now married, 523 unmarried) Women who did not have a birth in the past 12 months: 11,222 (4,560 now married, 6,673 unmarried)
Housing units in zip code 76116 with a mortgage: 4,281 (205 second mortgage, 9 home equity loan, 157 both second mortgage and home equity loan) Houses without a mortgage: 240
Median monthly owner costs for units with a mortgage: $1,979 Median monthly owner costs for units without a mortgage: $737
Residents with income below the poverty level in 2022:
This zip code:
23.1%
Whole state:
14.0%
Residents with income below 50% of the poverty level in 2022:
This zip code:
11.2%
Whole state:
7.4%
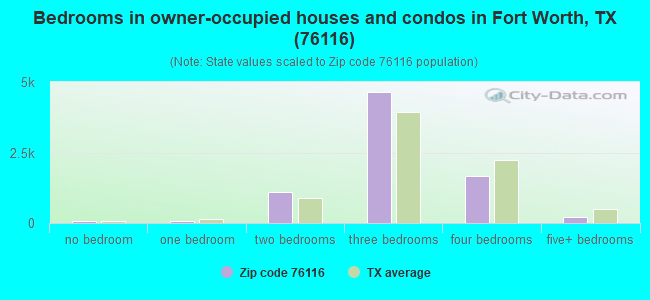
Median number of rooms in houses and condos:
Here:
6.3
State:
6.3
Median number of rooms in apartments:
Here:
3.8
State:
4.0
Notable locations in this zip code not listed on our city pages
Notable locations in zip code 76116: Boaz Golf Course (A), Ridglea Country Club (B), Westridge Country Club (C), Fort Worth Fire Department Station 23 (D), Fort Worth Fire Department Station 30 (E), Evans Recreation Center (F). Display/hide their locations on the map
Shopping Centers: Broadway Plaza-Westover Hills Shopping Center (1), Fort Worth Mall Shopping Center (2), La Gran Plaza Shopping Center (3), Las Vegas Trail Shopping Center (4), Ridgelea Village Shopping Center (5), Ridgmar Mall Shopping Center (6). Display/hide their locations on the map
Churches in zip code 76116 include: Crusaders Chapel Church (A), Olive Place Baptist Church (B), Williams Road Baptist Church (C), Westland Heights Baptist Church (D), Western Hills Free Will Baptist Church (E), Western Hills Church of Christ (F), Ridglea Church of God (G), Bethel United Methodist Church (H), Redeemer Lutheran Church (I). Display/hide their locations on the map
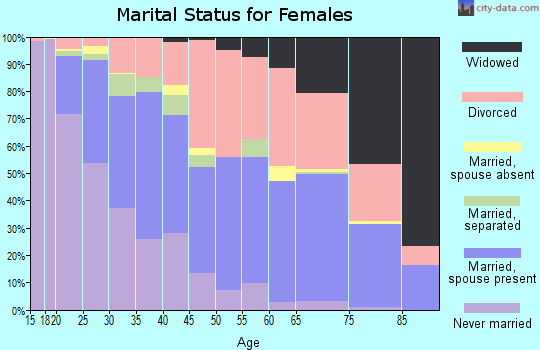
6,333 married couples with children.
3,831 single-parent households (312 men, 3,519 women).
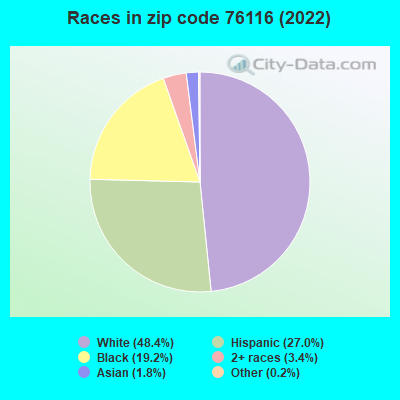
79.7% of residents of 76116 zip code speak English at home.
16.2% of residents speak Spanish at home (69% very well, 16% well, 11% not well, 4% not at all).
2.1% of residents speak other Indo-European language at home (73% very well, 26% well, 1% not well).
0.9% of residents speak Asian or Pacific Island language at home (84% very well, 14% well, 2% not well).
1.2% of residents speak other language at home (83% very well, 17% well).
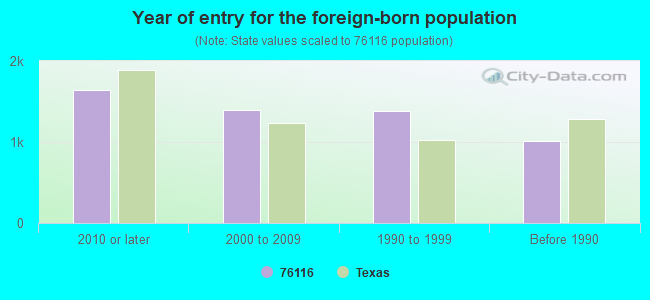
Foreign born population: 4,862 (9.6%) (31.4% of them are naturalized citizens)
Facilities with environmental interests located in this zip code:
APPLIED LEARNING ACAD (7060 CAMP BOWIE in FORT WORTH, TX)
(National Center for Education Statistics) - STATE ID-220905055 Organizations: FORT WORTH ISD (SCHOOL DISTRICT)
AAA AUTOFIX EASONS PAINT AND BODY (7333 W VICKERY BLVD in BENBROOK, TX)
(Resource Conservation and Recovery Act (tracking hazardous waste)) Alternative names: AAA AUTOFIX/EASON PAINT & BODY
ALBERTSONS (4650 SOUTHWEST LOOP 820 in FORT WORTH, TX)
AIR MINOR (AIRS/AFS) ENFORCEMENT/COMPLIANCE ACTIVITY (Integrated Compliance Information System) Business SIC classification: GROCERY STORES
AUTO COLLISION SPECIALIST (3317 CHERRY LN in FORT WORTH, TX)
(Resource Conservation and Recovery Act (tracking hazardous waste)) Organizations: AUTO COLLISION SPECIALIST INC (CONTACT/OWNER)
Alternative names: REEDS AUTO COLLISON
Housing units lacking complete plumbing facilities: 1.3% Housing units lacking complete kitchen facilities: 2.3%
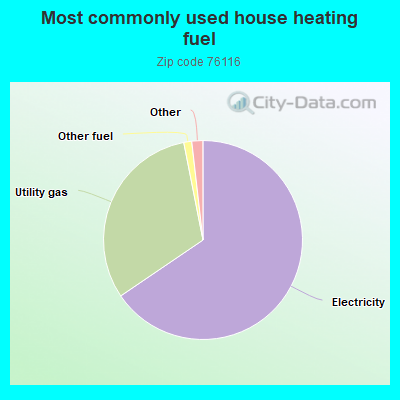
65.5%Electricity
31.4%Utility gas
1.3%Other fuel
0.7%No fuel used
0.6%Bottled, tank, or LP gas
Population in 1990: 38,210. Population change in the 1990s: +7,133 (+18.7%).
Place of birth for U.S.-born residents:
This state: 31,548
Northeast: 1,194
Midwest: 3,821
South: 5,415
West: 3,043
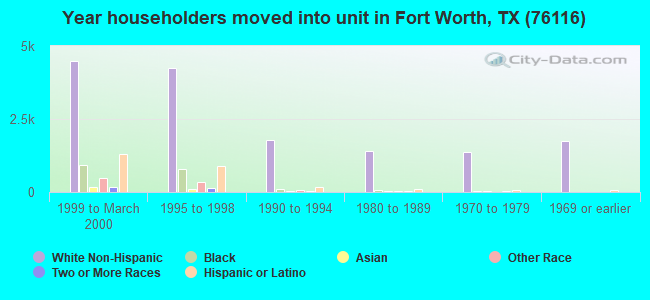
40% of the 76116 zip code residents lived in the same house 5 years ago. Out of people who lived in different houses, 66% lived in this county. Out of people who lived in different counties, 50% lived in Texas.
81% of the 76116 zip code residents lived in the same house 1 year ago. Out of people who lived in different houses, 65% moved from this county. Out of people who lived in different houses, 17% moved from different county within same state. Out of people who lived in different houses, 11% moved from different state. Out of people who lived in different houses, 4% moved from abroad.
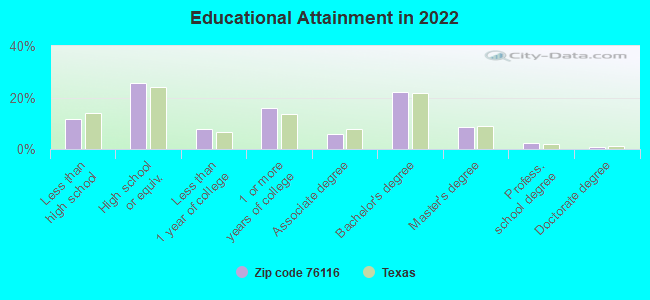
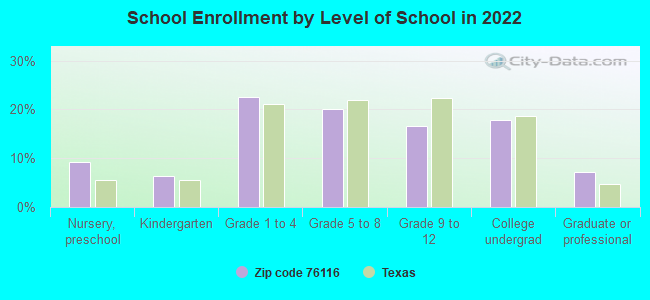
Private vs. public school enrollment:
Students in private schools in grades 1 to 8 (elementary and middle school): 450
Here:
9.2%
Texas:
8.8%
Students in private schools in grades 9 to 12 (high school): 274
Here:
14.4%
Texas:
8.0%
Students in private undergraduate colleges: 309
Here:
15.2%
Texas:
16.2%
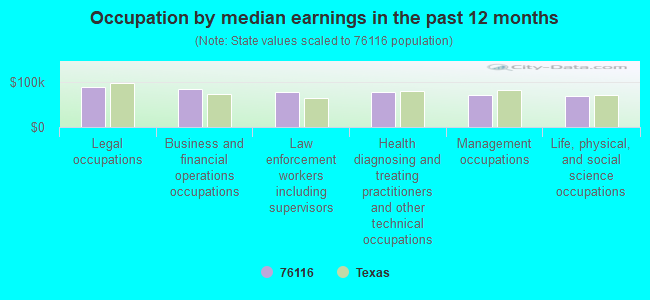
Occupation by median earnings in the past 12 months ($)
89,364Legal occupations
84,425Business and financial operations occupations
78,907Law enforcement workers including supervisors
78,884Health diagnosing and treating practitioners and other technical occupations
72,196Management occupations
69,763Life, physical, and social science occupations
Companies with biggest federal contracts located in this zip code (FORT WORTH, TX):
DYNCORP (6500 WEST FWY STE 600) : $1,264,722,469 in 1814 contractsfrom 1999 to 2006
Contracts for Modification of Equipment -- Aircraft and Airframe Structural Components, Maintenance, Repair and Rebuilding of Equipment -- Aircraft and Airframe Structural Components, Operation of Government-Owned Facilities -- Other Administrative Facilities and Service Buildings, Maintenance, Repair and Rebuilding of Equipment -- Aircraft Components and Accessories, and moreby Air Force, NASA, Army, Department of State, and others Signed by year:2000: $260,885,039; 2001: $160,834,941; 2002: $113,408,711; 2003: $77,883,148; 2004: $82,496,490; 2005: $306,717,386; 2006: $162,978,663.
Biggest contracts:
$28,400,802 with Air Force for Modification of Equipment -- Aircraft and Airframe Structural Components. Signed on 2000-10-03. Completion date: 2001-09-30.
$24,284,800 with Air Force for Maintenance, Repair and Rebuilding of Equipment -- Aircraft and Airframe Structural Components. Taking place in KY. Signed on 2005-01-14. Completion date: 2005-12-14.
$23,901,609 with Air Force for Modification of Equipment -- Aircraft and Airframe Structural Components. Signed on 1999-10-28. Completion date: 2000-09-30.
$16,020,300 with Air Force for Maintenance, Repair and Rebuilding of Equipment -- Aircraft and Airframe Structural Components. Taking place in MD. Signed on 2004-10-01. Completion date: 2005-09-30.
DYNCORP (6500 W FREEWAY) : $799,126,905 in 131 contractsfrom 1999 to 2004
Contracts for Maintenance, Repair and Rebuilding of Equipment -- Aircraft and Airframe Structural Components, Operation of Government-Owned Facilities -- Radar and Navigational Facilities by Army, Air Force Signed by year:2000: $193,469,632; 2001: $166,224,980; 2002: $228,955,451; 2003: $173,316,544; 2004: $34,392,120; 2005: $0; 2006: $0.
Biggest contracts:
$24,016,938 with Army for Maintenance, Repair and Rebuilding of Equipment -- Aircraft and Airframe Structural Components. Taking place in AL. Signed on 2003-03-25. Completion date: 2003-09-30.
$22,777,647, same as above.Signed on 2003-02-21. Completion date: 2003-09-30.
$22,540,297, same as above.Signed on 2003-06-01. Completion date: 2003-09-30.
$19,702,154, same as above.Signed on 2002-02-20. Completion date: 2002-09-30.
DCM CLEAN AIR PRODUCTS INC. (9605 HWY 80 W; small business) 7 employees, $1500000 revenue. : $3,654,203 in 160 contractsfrom 2000 to 2006
Contracts for Sets, Kits, and Outfits of Hand Tools, Refrigeration and Air Conditioning Components, Fans, Air Circulators, and Blower Equipment, Floor Polishers and Vacuum Cleaning Equipment, and moreby Navy, Defense Logistics Agency, Air Force, Army, and others Signed by year:2000: $142,631; 2001: $636,012; 2002: $350,570; 2003: $117,458; 2004: $911,075; 2005: $1,365,565; 2006: $130,892.
Biggest contracts:
$766,160 with Navy for Sets, Kits, and Outfits of Hand Tools. Signed on 2005-09-07. Completion date: 2006-03-06.
$257,749 with Defense Logistics Agency for Refrigeration and Air Conditioning Components. Signed on 2004-01-22. Completion date: 2004-02-22.
$247,875 with Navy for Fans, Air Circulators, and Blower Equipment. Signed on 2004-09-20. Completion date: 2004-11-15.
$169,736 with Navy for Floor Polishers and Vacuum Cleaning Equipment. Signed on 2001-08-21. Completion date: 2001-10-17.
MACTIER COMPONENTS INC AIRTECH (9601 CAMP BOWIE WEST; small business) : $680,630 in 88 contractsfrom 2004 to 2006
Contracts for Miscellaneous Electric Power and Distribution Equipment, Aircraft Ground Servicing Equipment, Hardware, Weapon System, Sets, Kits, and Outfits of Hand Tools, and moreby Defense Logistics Agency, Army Signed by year:2000: $0; 2001: $0; 2002: $0; 2003: $0; 2004: $202,678; 2005: $250,420; 2006: $227,532.
Biggest contracts:
$47,371 with Defense Logistics Agency for Miscellaneous Electric Power and Distribution Equipment. Signed on 2006-05-01. Completion date: 2007-02-05.
$46,148 with Defense Logistics Agency for Aircraft Ground Servicing Equipment. Signed on 2004-09-10. Completion date: 2005-05-08.
$37,251 with Defense Logistics Agency for Hardware, Weapon System. Signed on 2006-03-22. Completion date: 2006-12-26.
$32,347 with Defense Logistics Agency for Sets, Kits, and Outfits of Hand Tools. Signed on 2004-07-17. Completion date: 2004-12-14.
O C M MACHINE CO INC (9601 HIGHWAY 80; small business) : $634,801 in 20 contractsfrom 1999 to 2006
Contracts for Optical Instruments, Test Equipment, Components and Accessories, Screws, Liquid and Gas Flow, Liquid Level, and Mechanical Motion Measuring Instruments, Miscellaneous Battery Retaining Fixtures and Liners, and moreby Defense Logistics Agency, Army, Navy Signed by year:2000: $55,394; 2001: $132,033; 2002: $140,645; 2003: $0; 2004: $113,993; 2005: $862; 2006: $14,216.
Biggest contracts:
$98,196 with Defense Logistics Agency for Optical Instruments, Test Equipment, Components and Accessories. Signed on 2004-01-29. Completion date: 2005-01-03.
$97,771 with Defense Logistics Agency for Screws. Signed on 2001-10-19. Completion date: 2002-02-04.
$97,105 with Defense Logistics Agency for Liquid and Gas Flow, Liquid Level, and Mechanical Motion Measuring Instruments. Signed on 1999-11-05. Completion date: 2000-11-05.
$95,987 with Defense Logistics Agency for Optical Instruments, Test Equipment, Components and Accessories. Signed on 2001-07-05. Completion date: 2002-03-02.
PATTERSON CONSULTING INC (1500 ADEN RD; small business) : $483,750 in 7 contractsfrom 2000 to 2006
Contracts for Policy Review/Development Services, Program Management/Support Services, Other Management Support Services by Air Force Signed by year:2000: $90,000; 2001: $90,000; 2002: $90,000; 2003: $90,000; 2004: $90,000; 2005: $90,000; 2006: -$56,250.
Biggest contracts:
$90,000 with Air Force for Policy Review/Development Services. Signed on 2005-11-01. Completion date: 2006-10-30.
$90,000 with Air Force for Program Management/Support Services. Signed on 2004-10-29. Completion date: 2005-10-31.
$90,000 with Air Force for Other Management Support Services. Signed on 2003-11-01. Completion date: 2004-10-31.
$90,000, same as above.Signed on 2002-11-01. Completion date: 2003-10-31.
JFB CONSTRUCTION, INC (7201 WEST VICKERY BLVD; small business) : $463,333 in 25 contractsfrom 1999 to 2001
Contracts for Maintenance, Repair or Alteration of Real Property -- Miscellaneous Buildings, Construction of Structures and Facilities -- Other Hospital Buildings, Maintenance, Repair or Alteration of Real Property -- Hospitals and Infirmaries by Navy, Army Signed by year:2000: $454,142; 2001: -$2,314; 2002: $0; 2003: $0; 2004: $0; 2005: $0; 2006: $0.
Biggest contracts:
$158,100 with Navy for Maintenance, Repair or Alteration of Real Property -- Miscellaneous Buildings. Signed on 2000-11-07. Completion date: 1998-11-03.
$81,285 with Navy for Construction of Structures and Facilities -- Other Hospital Buildings. Taking place in SC. Signed on 2000-10-03. Completion date: 2002-08-18.
$73,761, same as above.Signed on 2000-05-17. Completion date: 2002-08-18.
$48,000 with Army for Maintenance, Repair or Alteration of Real Property -- Hospitals and Infirmaries. Signed on 2000-02-02. Completion date: 1999-01-01.
TEXAS SPACE AND AERONAUTICAL R (6777 CAMP BOWIE BLVD. SUIT; small business)
$322,016 with Air Force for Defense Missile and Space Systems -- Management and Support (R&D). Signed on 2000-04-10. Completion date: 2000-12-15.
ABACUS INDUSTRIES INC (8205 CAMP BOWIE W STE 116; small business) : $203,288 in 19 contractsfrom 2005 to 2006
Contracts for Antennas, Waveguides, and Related Equipment, Fuses, Arresters, Absorbers, and Protectors, Semiconductor Devices and Associated Hardware, Connectors, Electrical, and moreby Defense Logistics Agency Signed by year:2000: $0; 2001: $0; 2002: $0; 2003: $0; 2004: $0; 2005: $189,493; 2006: $13,795.
Biggest contracts:
$98,983 with Defense Logistics Agency for Antennas, Waveguides, and Related Equipment. Signed on 2005-10-11. Completion date: 2005-12-16.
$17,856 with Defense Logistics Agency for Fuses, Arresters, Absorbers, and Protectors. Signed on 2005-07-12. Completion date: 2005-10-26.
$12,086 with Defense Logistics Agency for Semiconductor Devices and Associated Hardware. Signed on 2005-11-21. Completion date: 2006-02-19.
$10,795, same as above.Signed on 2005-06-23. Completion date: 2005-09-29.
AVIS INDUSTRIES, INC (8851 WEST FREEWAY BLDG 107; small business) : $169,788 in 34 contractsfrom 2004 to 2006
Contracts for Miscellaneous Vehicular Components, Miscellaneous Engine Accessories, Nonaircraft, Hand Tools, Nonedged, Nonpowered, Electrical Hardware and Supplies, and moreby Defense Logistics Agency, Army Signed by year:2000: $0; 2001: $0; 2002: $0; 2003: $0; 2004: $102,047; 2005: $22,250; 2006: $45,491.
Biggest contracts:
$60,446 with Defense Logistics Agency for Miscellaneous Vehicular Components. Signed on 2004-12-10. Completion date: 2005-05-09.
$8,764 with Defense Logistics Agency for Miscellaneous Engine Accessories, Nonaircraft. Signed on 2006-02-27. Completion date: 2006-08-11.
$8,217 with Army for Hand Tools, Nonedged, Nonpowered. Signed on 2004-07-15. Completion date: 2004-08-09.
$6,950 with Defense Logistics Agency for Electrical Hardware and Supplies. Signed on 2006-06-27. Completion date: 2006-12-09.
Top industries in this zip code by the number of employees in 2005:
2002 - 2018 National Fire Incident Reporting System (NFIRS) incidents
Based on the data from the years 2002 - 2018 the average number of fires per year is 153. The highest number of reported fires - 245 took place in 2005, and the least - 13 in 2018. The data has a declining trend.
When looking into fire subcategories, the most incidents belonged to: Outside Fires (48.1%), and Structure Fires (30.6%).
Fire incident types reported to NFIRS in Zip Code 76116


 Nearest zip codes: 76127, 76132, 76109, 76107, 76114, 76129.
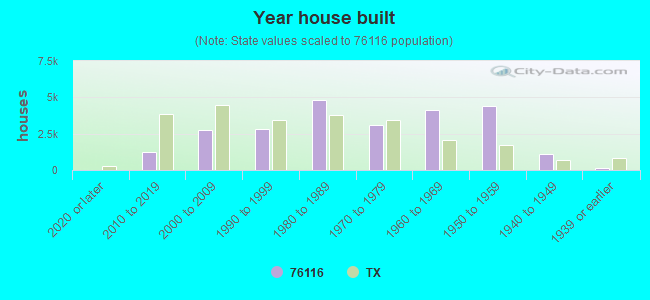


 Based on the data from the years 2002 - 2018 the average number of fires per year is 153. The highest number of reported fires - 245 took place in 2005, and the least - 13 in 2018. The data has a declining trend.
 When looking into fire subcategories, the most incidents belonged to: Outside Fires (48.1%), and Structure Fires (30.6%).