Estimated zip code population in 2022: 6,079 Zip code population in 2010: 5,721 Zip code population in 2000: 5,521
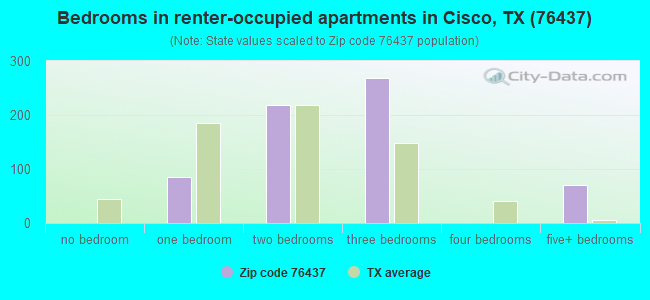
Houses and condos: 3,014 Renter-occupied apartments: 657
% of renters here:
27%
State:
38%
March 2022 cost of living index in zip code 76437: 76.5 (low, U.S. average is 100)
Land area: 405.0 sq. mi. Water area: 1.1 sq. mi.
Population density: 15 people per square mile
(very low).
OSM Map
General Map
Google Map
MSN Map
OSM Map
General Map
Google Map
MSN Map
OSM Map
General Map
Google Map
MSN Map
OSM Map
General Map
Google Map
MSN Map
Please wait while loading the map...
Real estate property taxes paid for housing units in 2022:
This zip code:
1.3% ($1,691)
Texas:
1.5% ($4,050)
Median real estate property taxes paid for housing units with mortgages in 2022: $2,392 (1.7%) Median real estate property taxes paid for housing units with no mortgage in 2022: $1,493 (1.3%)
Business Search- 14 Million verified businesses
Males: 3,132
(51.5%)
Females: 2,946
(48.5%)
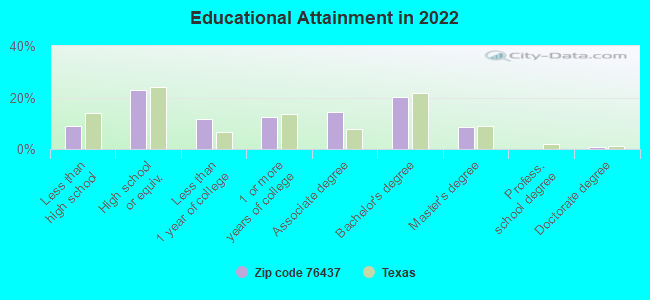
For population 25 years and over in 76437:
High school or higher: 91.7%
Bachelor's degree or higher: 30.0%
Graduate or professional degree: 9.6%
Unemployed: 5.3%
Mean travel time to work (commute): 25.7 minutes
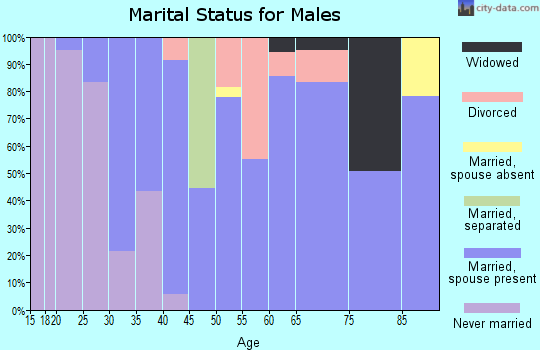
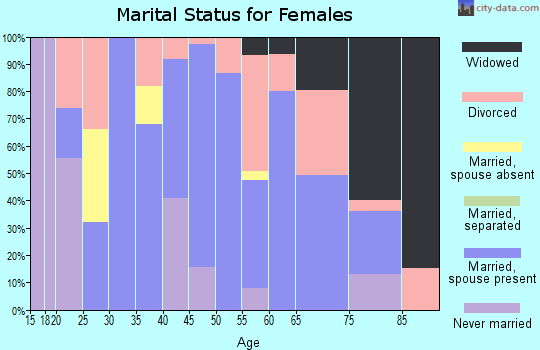
For population 15 years and over in 76437:
Never married: 24.8%
Now married: 61.2%
Separated: 0.6%
Widowed: 5.6%
Divorced: 7.8%
Zip code 76437 compared to state average:
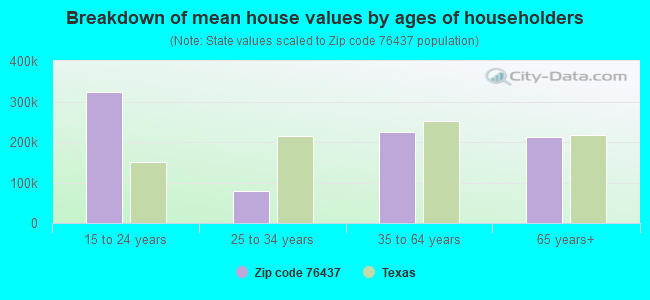
Median house value below state average.
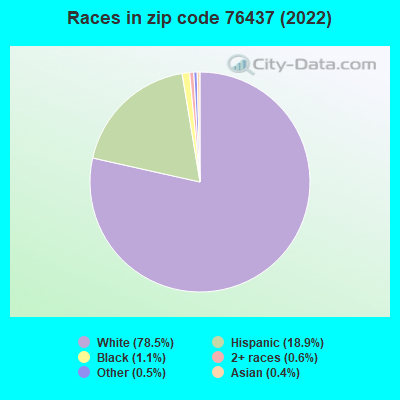
Black race population percentage significantly below state average.
Hispanic race population percentage below state average.
Median age above state average.
Foreign-born population percentage significantly below state average.
Length of stay since moving in significantly above state average.
Averages for the 2020 tax year for zip code 76437, filed in 2021:
Average Adjusted Gross Income (AGI) in 2020: $55,763 (Individual Income Tax Returns)
Here:
$55,763
State:
$77,054
Salary/wage: $44,314 (reported on 80.1% of returns)
Here:
$44,314
State:
$62,766
(% of AGI for various income ranges: 1128.6% for AGIs below $25k, 3514.3% for AGIs $25k-50k, 5867.6% for AGIs $50k-75k, 9149.2% for AGIs $75k-100k, 14053.3% for AGIs $100k-200k)
Taxable interest for individuals: $3,506 (reported on 23.9% of returns)
This zip code:
$3,506
Texas:
$2,665
(% of AGI for various income ranges: 10.5% for AGIs below $25k, 19.6% for AGIs $25k-50k, 30.0% for AGIs $50k-75k, 123.8% for AGIs $75k-100k, 154.0% for AGIs $100k-200k)
Ordinary dividends: $10,507 (reported on 13.3% of returns)
Here:
$10,507
State:
$10,044
(% of AGI for various income ranges: 13.2% for AGIs below $25k, 42.6% for AGIs $25k-50k, 33.6% for AGIs $50k-75k, 106.9% for AGIs $75k-100k, 454.0% for AGIs $100k-200k)
Net capital gain/loss in AGI: +$41,963 (reported on 13.3% of returns)
Here:
+$41,963
State:
+$39,590
(% of AGI for various income ranges: 8.8% for AGIs below $25k, 33.0% for AGIs $25k-50k, 55.2% for AGIs $50k-75k, 244.6% for AGIs $75k-100k, 753.3% for AGIs $100k-200k)
Profit/loss from business: +$12,130 (reported on 20.8% of returns)
Here:
+$12,130
State:
+$10,888
(% of AGI for various income ranges: 207.5% for AGIs below $25k, 193.5% for AGIs $25k-50k, 236.4% for AGIs $50k-75k, 278.5% for AGIs $75k-100k, 563.3% for AGIs $100k-200k)
Taxable individual retirement arrangement distribution: $17,056 (reported on 8.0% of returns)
76437:
$17,056
Texas:
$24,740
(% of AGI for various income ranges: 58.5% for AGIs below $25k, 81.5% for AGIs $25k-50k, 143.6% for AGIs $50k-75k, 359.2% for AGIs $75k-100k, 992.7% for AGIs $100k-200k)
Total itemized deductions: $44,929 (reported on 3.1% of returns)
Here:
$44,929
State:
$40,428
(% of AGI for various income ranges: 173.7% for AGIs $25k-50k, 1564.0% for AGIs $100k-200k)
Charity contributions: $22,283 (reported on 2.7% of returns)
Here:
$22,283
State:
$18,201
(% of AGI for various income ranges: 41.5% for AGIs $25k-50k, 764.0% for AGIs $100k-200k)
Taxes paid: $5,686 (reported on 3.1% of returns)
76437:
$5,686
State:
$7,821
(% of AGI for various income ranges: 21.5% for AGIs $25k-50k, 199.3% for AGIs $100k-200k)
Earned income credit: $2,444 (reported on 21.2% of returns)
Here:
$2,444
State:
$2,584
(% of AGI for various income ranges: 124.6% for AGIs below $25k, 78.9% for AGIs $25k-50k)
Percentage of individuals using paid preparers for their 2020 taxes: 92.5%
Here:
92%
State:
92%
(% for various income ranges: 90.8% for AGIs below $25k, 93.1% for AGIs $25k-50k, 90.9% for AGIs $50k-75k, 100.0% for AGIs $75k-100k, 91.3% for AGIs $100k-200k, 100.0% for AGIs over 200k)
Averages for the 2012 tax year for zip code 76437, filed in 2013:
Average Adjusted Gross Income (AGI) in 2012: $43,872 (Individual Income Tax Returns)
Here:
$43,872
State:
$65,384
Salary/wage: $38,076 (reported on 82.0% of returns)
Here:
$38,076
State:
$52,524
(% of AGI for various income ranges: 75.5% for AGIs below $25k, 78.6% for AGIs $25k-50k, 80.6% for AGIs $50k-75k, 81.0% for AGIs $75k-100k, 68.5% for AGIs $100k-200k, 34.1% for AGIs over 200k)
Taxable interest for individuals: $1,024 (reported on 27.2% of returns)
This zip code:
$1,024
Texas:
$2,372
(% of AGI for various income ranges: 1.3% for AGIs below $25k, 0.5% for AGIs $25k-50k, 0.4% for AGIs $50k-75k, 0.4% for AGIs $75k-100k, 1.0% for AGIs $100k-200k, 0.5% for AGIs over 200k)
Ordinary dividends: $4,952 (reported on 11.5% of returns)
Here:
$4,952
State:
$9,721
(% of AGI for various income ranges: 1.2% for AGIs below $25k, 0.6% for AGIs $25k-50k, 0.3% for AGIs $50k-75k, 1.3% for AGIs $75k-100k, 4.5% for AGIs $100k-200k)
Net capital gain/loss in AGI: +$23,770 (reported on 12.4% of returns)
Here:
+$23,770
State:
+$35,319
(% of AGI for various income ranges: 0.2% for AGIs below $25k, 1.4% for AGIs $25k-50k, 1.2% for AGIs $50k-75k, 3.9% for AGIs $75k-100k, 5.2% for AGIs $100k-200k, 33.3% for AGIs over 200k)
Profit/loss from business: +$9,932 (reported on 20.3% of returns)
Here:
+$9,932
State:
+$13,732
(% of AGI for various income ranges: 9.9% for AGIs below $25k, 4.4% for AGIs $25k-50k, 3.9% for AGIs $50k-75k, 2.4% for AGIs $75k-100k, 8.0% for AGIs $100k-200k)
Taxable individual retirement arrangement distribution: $10,782 (reported on 7.8% of returns)
76437:
$10,782
Texas:
$19,511
(% of AGI for various income ranges: 2.5% for AGIs below $25k, 2.8% for AGIs $25k-50k, 2.8% for AGIs $50k-75k, 3.3% for AGIs $100k-200k)
Total itemized deductions: $24,336 (25% of AGI, reported on 12.9% of returns)
Here:
$24,336
State:
$24,724
Here:
24.7% of AGI
State:
15.9% of AGI
(% of AGI for various income ranges: 4.5% for AGIs below $25k, 4.0% for AGIs $25k-50k, 5.0% for AGIs $50k-75k, 8.5% for AGIs $75k-100k, 12.2% for AGIs $100k-200k, 9.4% for AGIs over 200k)
Charity contributions: $9,713 (reported on 10.6% of returns)
Here:
$9,713
State:
$6,808
(% of AGI for various income ranges: 1.0% for AGIs below $25k, 1.1% for AGIs $25k-50k, 0.9% for AGIs $50k-75k, 2.6% for AGIs $75k-100k, 4.3% for AGIs $100k-200k, 4.9% for AGIs over 200k)
Taxes paid: $3,886 (reported on 12.9% of returns)
76437:
$3,886
State:
$6,921
(% of AGI for various income ranges: 0.5% for AGIs below $25k, 0.4% for AGIs $25k-50k, 0.8% for AGIs $50k-75k, 1.8% for AGIs $75k-100k, 2.0% for AGIs $100k-200k, 1.3% for AGIs over 200k)
Earned income credit: $2,298 (reported on 24.0% of returns)
Here:
$2,298
State:
$2,570
(% of AGI for various income ranges: 7.7% for AGIs below $25k, 1.6% for AGIs $25k-50k)
Percentage of individuals using paid preparers for their 2012 taxes: 54.4%
Here:
54%
State:
51%
(% for various income ranges: 48.5% for AGIs below $25k, 52.8% for AGIs $25k-50k, 58.6% for AGIs $50k-75k, 65.0% for AGIs $75k-100k, 75.0% for AGIs $100k-200k, 75.0% for AGIs over 200k)
Averages for the 2004 tax year for zip code 76437, filed in 2005:
Average Adjusted Gross Income (AGI) in 2004: $29,158 (Individual Income Tax Returns)
Here:
$29,158
State:
$47,881
Salary/wage: $26,339 (reported on 79.2% of returns)
Here:
$26,339
State:
$41,947
(% of AGI for various income ranges: 197.6% for AGIs below $10k, 74.3% for AGIs $10k-25k, 76.1% for AGIs $25k-50k, 79.2% for AGIs $50k-75k, 68.8% for AGIs $75k-100k, 40.0% for AGIs over 100k)
Taxable interest for individuals: $1,186 (reported on 34.5% of returns)
This zip code:
$1,186
Texas:
$2,255
(% of AGI for various income ranges: 15.9% for AGIs below $10k, 2.0% for AGIs $10k-25k, 1.3% for AGIs $25k-50k, 0.7% for AGIs $50k-75k, 0.4% for AGIs $75k-100k, 0.9% for AGIs over 100k)
Taxable dividends: $1,767 (reported on 14.6% of returns)
Here:
$1,767
State:
$4,261
(% of AGI for various income ranges: 3.4% for AGIs below $10k, 1.0% for AGIs $10k-25k, 0.7% for AGIs $25k-50k, 1.0% for AGIs $50k-75k, 1.0% for AGIs $75k-100k, 0.6% for AGIs over 100k)
Net capital gain/loss: +$7,874 (reported on 15.2% of returns)
Here:
+$7,874
State:
+$16,110
(% of AGI for various income ranges: -2.9% for AGIs below $10k, 1.0% for AGIs $10k-25k, 1.4% for AGIs $25k-50k, 0.2% for AGIs $50k-75k, 4.5% for AGIs $75k-100k, 17.0% for AGIs over 100k)
Profit/loss from business: +$10,069 (reported on 22.3% of returns)
Here:
+$10,069
State:
+$11,013
(% of AGI for various income ranges: 22.4% for AGIs below $10k, 8.6% for AGIs $10k-25k, 6.1% for AGIs $25k-50k, 5.1% for AGIs $50k-75k, 9.0% for AGIs $75k-100k, 10.0% for AGIs over 100k)
IRA payment deduction: $3,351 (reported on 1.8% of returns)
76437:
$3,351
Texas:
$3,120
Total itemized deductions: $15,493 (24% of AGI, reported on 9.7% of returns)
Here:
$15,493
State:
$19,631
Here:
24.4% of AGI
State:
18.9% of AGI
(% of AGI for various income ranges: 4.0% for AGIs $10k-25k, 4.1% for AGIs $25k-50k, 5.4% for AGIs $50k-75k, 8.3% for AGIs $75k-100k, 6.0% for AGIs over 100k)
Charity contributions deductions: $6,013 (9% of AGI, reported on 7.6% of returns)
Here:
$6,013
State:
$4,753
Here:
8.9% of AGI
State:
4.2% of AGI
(% of AGI for various income ranges: 0.8% for AGIs $10k-25k, 0.9% for AGIs $25k-50k, 1.6% for AGIs $50k-75k, 3.3% for AGIs $75k-100k, 2.2% for AGIs over 100k)
Total tax: $3,991 (reported on 66.0% of returns)
76437:
$3,991
State:
$9,058
(% of AGI for various income ranges: 7.8% for AGIs below $10k, 3.8% for AGIs $10k-25k, 5.8% for AGIs $25k-50k, 9.3% for AGIs $50k-75k, 12.0% for AGIs $75k-100k, 17.5% for AGIs over 100k)
Earned income credit: $1,841 (reported on 25.6% of returns)
Here:
$1,841
State:
$2,024
Percentage of individuals using paid preparers for their 2004 taxes: 67.1%
Here:
67%
State:
57%
(% for various income ranges: 62.1% for AGIs below $10k, 66.9% for AGIs $10k-25k, 70.6% for AGIs $25k-50k, 64.0% for AGIs $50k-75k, 74.5% for AGIs $75k-100k, 86.4% for AGIs over 100k)
Household received Food Stamps/SNAP in the past 12 months: 147 Household did not receive Food Stamps/SNAP in the past 12 months: 2,297
Women who had a birth in the past 12 months: 14 (14 now married, 0 unmarried) Women who did not have a birth in the past 12 months: 1,254 (580 now married, 673 unmarried)
Housing units in zip code 76437 with a mortgage: 624 (37 second mortgage, 40 both second mortgage and home equity loan) Median monthly owner costs for units with a mortgage: $1,829 Median monthly owner costs for units without a mortgage: $439
Residents with income below the poverty level in 2022:
This zip code:
7.1%
Whole state:
14.0%
Residents with income below 50% of the poverty level in 2022:
This zip code:
4.7%
Whole state:
7.4%
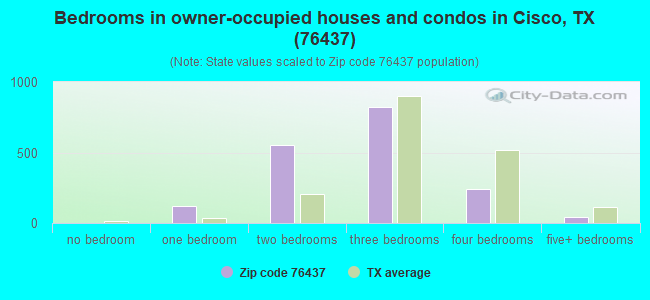
Median number of rooms in houses and condos:
Here:
5.9
State:
6.3
Median number of rooms in apartments:
Here:
4.7
State:
4.0
Notable locations in this zip code not listed on our city pages
Notable locations in zip code 76437: Cisco Historic District (A), Klelner Oil Field (B), Mobley Hotel (C), Cisco Fire Department (D), Cisco Emergency Medical Service (E). Display/hide their locations on the map
Churches in zip code 76437 include: East Cisco Baptist Church (A), Bible Baptist Church (B), Grace Fellowship Church (C), First Presbyterian Church (D), Union Church (E), Little Flock Church (F). Display/hide their locations on the map
Cemeteries: Mitchell Cemetery (1), Wayside Cemetery (2), Oakwood Cemetery (3), Dothan Cemetery (4), Pisgah Cemetery (5), Haskell Cemetery (6), Harpersville cemetery (7). Display/hide their locations on the map
Reservoirs: Twin Lake (A), Lake Cisco (B), Bernie Lake (C), Battle Creek Channel Lake (D), Dothan Water Station Lake (E), Putnam Lake (F), H Graden Dye Reservoir (G), J Dye Lake (H). Display/hide their locations on the map
Streams, rivers, and creeks: Big Branch (A), Pecan Creek (B), Middle Fork Gunsolus Creek (C), Long Run (D), West Fork Gunsolus Creek (E), Sandy Creek (F), Jacks Branch (G), Live Oak Creek (H), Iron Ore Creek (I). Display/hide their locations on the map
In group quarters: 386 (-1 institutionalized population)
Size of family households: 1,057 2-persons, 431 3-persons, 122 4-persons, 133 5-persons, 34 6-persons
Size of nonfamily households: 585 1-person, 86 2-persons, 11 3-persons
870 married couples with children.
139 single-parent households (139 women).
88.4% of residents of 76437 zip code speak English at home.
10.1% of residents speak Spanish at home (81% very well, 13% well, 6% not well).
0.2% of residents speak other Indo-European language at home (100% very well).
1.6% of residents speak Asian or Pacific Island language at home (100% very well).
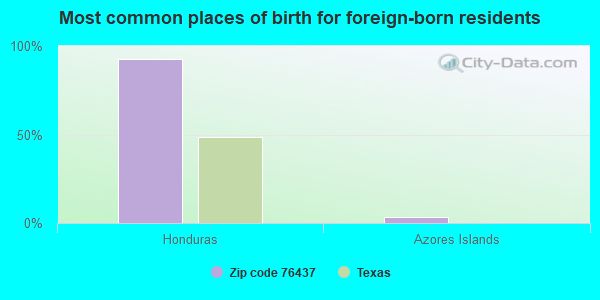
Foreign born population: 147 (2.4%) (30.0% of them are naturalized citizens)
This zip code:
2.4%
Whole state:
17.2%
93%Honduras
3%Azores Islands
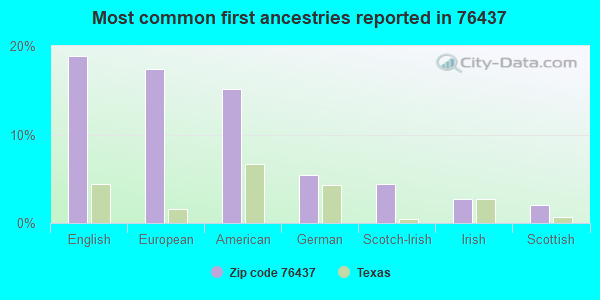
19%English
17%European
15%American
5%German
4%Scotch-Irish
3%Irish
2%Scottish
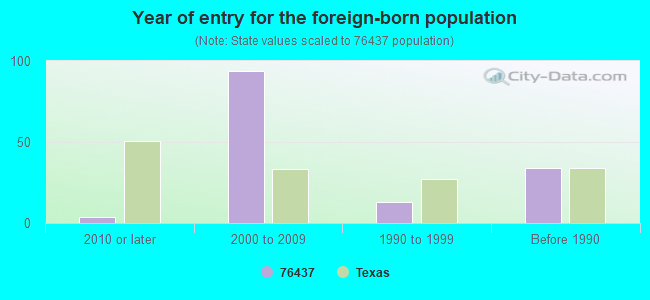
Year of entry for the foreign-born population
42010 or later
942000 to 2009
131990 to 1999
34Before 1990
Facilities with environmental interests located in this zip code:
693 EPC CISCO STATION (12 MI S OF FM 569 in CISCO, TX)
HAZARDOUS WASTE BIENNIAL REPORTER (Resource Conservation and Recovery Act (tracking hazardous waste)) Large Quantity Generators, more that 1000 kg of hazardous waste/month (Resource Conservation and Recovery Act (tracking hazardous waste)) Business NAICS classification: SUPPORT ACTIVITIES FOR OIL AND GAS OPERATIONS.
Housing units lacking complete plumbing facilities: 5.5% Housing units lacking complete kitchen facilities: 5.9%
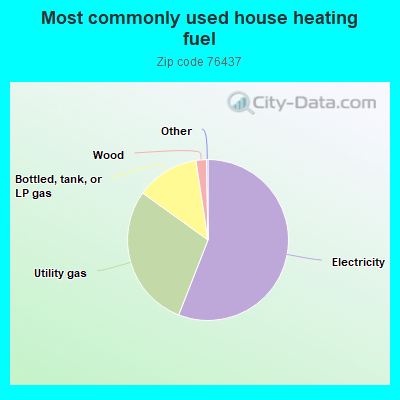
56.0%Electricity
29.0%Utility gas
12.7%Bottled, tank, or LP gas
2.1%Wood
Population in 1990: 4,906. Population change in the 1990s: +615 (+12.5%).
Place of birth for U.S.-born residents:
This state: 4,742
Northeast: 142
Midwest: 248
South: 522
West: 225
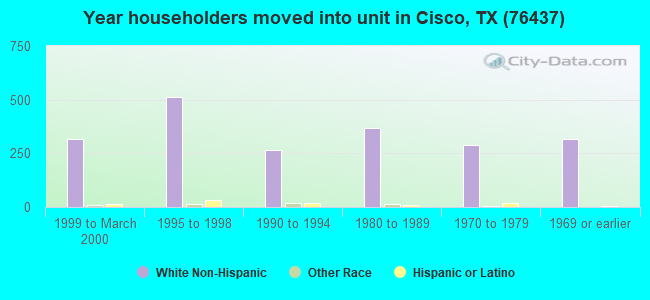
63% of the 76437 zip code residents lived in the same house 5 years ago. Out of people who lived in different houses, 40% lived in this county. Out of people who lived in different counties, 50% lived in Texas.
93% of the 76437 zip code residents lived in the same house 1 year ago. Out of people who lived in different houses, 38% moved from this county. Out of people who lived in different houses, 15% moved from different county within same state. Out of people who lived in different houses, 43% moved from different state. Out of people who lived in different houses, 11% moved from abroad.
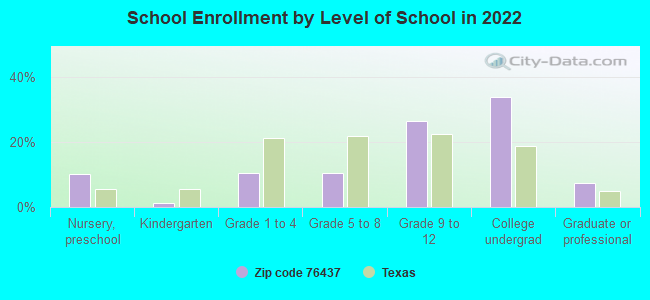
Private vs. public school enrollment:
Students in private schools in grades 1 to 8 (elementary and middle school):
Here:
0.0%
Texas:
8.8%
Students in private schools in grades 9 to 12 (high school):
Here:
0.0%
Texas:
8.0%
Students in private undergraduate colleges: 67
Here:
12.2%
Texas:
16.2%
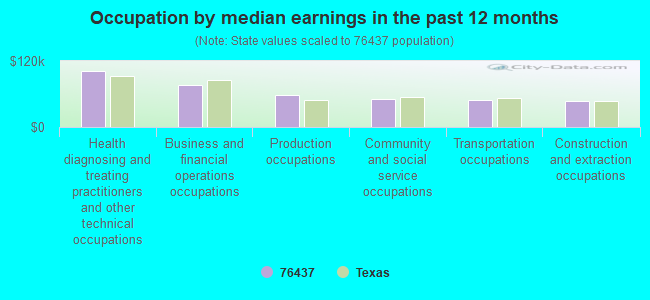
Occupation by median earnings in the past 12 months ($)
100,920Health diagnosing and treating practitioners and other technical occupations
75,905Business and financial operations occupations
58,052Production occupations
51,044Community and social service occupations
49,036Transportation occupations
48,049Construction and extraction occupations
Companies with federal contracts located in this zip code:
RESEARCH ADVANCED METHODS INDS (808 E 6TH ST in CISCO, TX; small business)
$347,877 with Army for Bushings, Rings, Shims, and Spacers. Signed on 2001-07-13. Completion date: 2002-05-09.
INGRAM, BOBBY (805 W 7TH ST in CISCO, TX; small business)
$5,700 with Army for Other Management Support Services. Signed on 2006-03-31. Completion date: 2006-04-01.
MAQUET VERTRIEB UND SERVICE DEUTSCHLAND GMBH (KEHLER STR. 31 in RASTATT, ; small business) 260 employees, $95000000 revenue: $3,902 in 4 contractsin 2006
$1,580 with Department of Veterans Affairs for Hospital Furniture, Equipment, Utensils, and Supplies. Taking place in NE. Signed on 2006-09-12. Completion date: 2006-09-22.
$786, same as above.Signed on 2006-08-15. Completion date: 2006-08-25.
$786, same as above.Signed on 2006-06-27. Completion date: 2006-07-07.
$750, same as above.Signed on 2006-05-12. Completion date: 2006-05-22.
Top industries in this zip code by the number of employees in 2005:
Health Care and Social Assistance: Other Residential Care Facilities (20-49: 1)
People in group quarters in 2010:
315 people in college/university student housing
41 people in nursing facilities/skilled-nursing facilities
24 people in correctional facilities intended for juveniles
People in group quarters in 2000:
205 people in college dormitories (includes college quarters off campus)
59 people in nursing homes
Fatal accident statistics in 2014:
Fatal accident count: 6
Vehicles involved in fatal accidents: 10
Fatal accidents caused by drunken drivers: 0
Fatalities: 6
Persons involved in fatal accidents: 12
Pedestrians involved in fatal accidents: 0
Fatal accident statistics in 2013:
Fatal accident count: 2
Vehicles involved in fatal accidents: 3
Fatal accidents caused by drunken drivers: 0
Fatalities: 2
Persons involved in fatal accidents: 4
Pedestrians involved in fatal accidents: 0
2002 - 2018 National Fire Incident Reporting System (NFIRS) incidents
According to the data from the years 2002 - 2018 the average number of fire incidents per year is 68. The highest number of reported fire incidents - 124 took place in 2008, and the least - 20 in 2006. The data has an increasing trend.
When looking into fire subcategories, the most reports belonged to: Outside Fires (61.1%), and Structure Fires (25.0%).
Fire incident types reported to NFIRS in Zip Code 76437

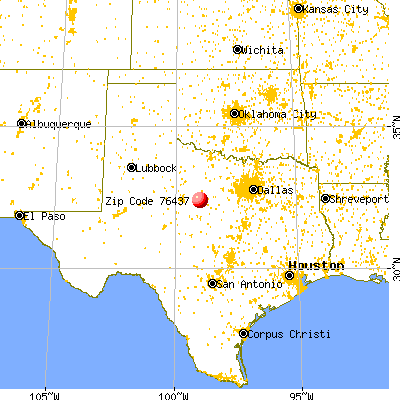


 Nearest zip codes: 76469, 76464, 76448, 76435, 76471, 76466.


 According to the data from the years 2002 - 2018 the average number of fire incidents per year is 68. The highest number of reported fire incidents - 124 took place in 2008, and the least - 20 in 2006. The data has an increasing trend.
 When looking into fire subcategories, the most reports belonged to: Outside Fires (61.1%), and Structure Fires (25.0%).