Estimated zip code population in 2022: 11,264 Zip code population in 2010: 11,039 Zip code population in 2000: 10,920
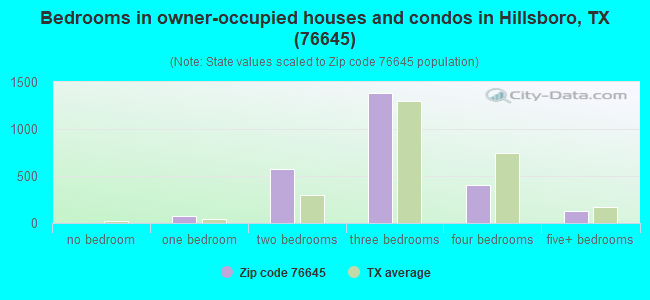
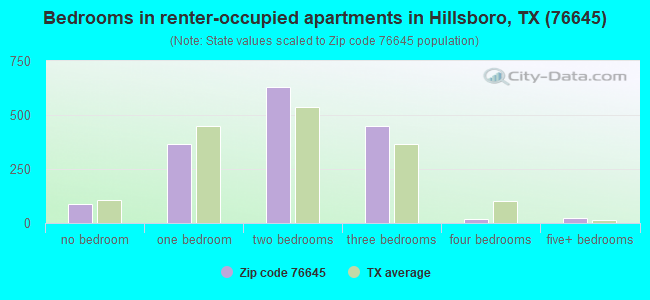
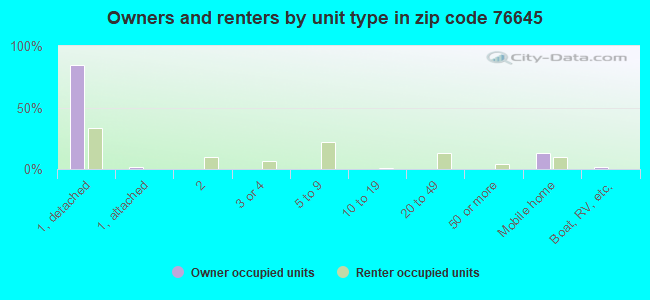
Houses and condos: 4,596 Renter-occupied apartments: 1,582
% of renters here:
38%
State:
38%
March 2022 cost of living index in zip code 76645: 78.3 (low, U.S. average is 100)
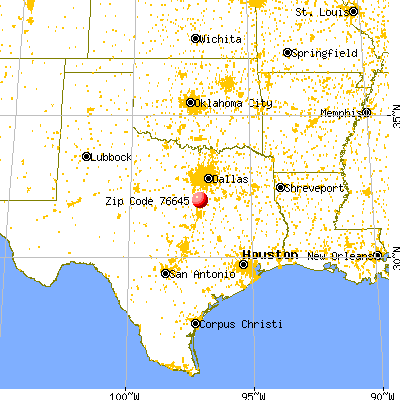
Land area: 167.5 sq. mi. Water area: 3.9 sq. mi.
Population density: 67 people per square mile
(very low).
OSM Map
General Map
Google Map
MSN Map
OSM Map
General Map
Google Map
MSN Map
OSM Map
General Map
Google Map
MSN Map
OSM Map
General Map
Google Map
MSN Map
Please wait while loading the map...
Real estate property taxes paid for housing units in 2022:
This zip code:
1.2% ($1,914)
Texas:
1.5% ($4,050)
Median real estate property taxes paid for housing units with mortgages in 2022: $2,979 (1.5%) Median real estate property taxes paid for housing units with no mortgage in 2022: $1,378 (1.2%)
Averages for the 2020 tax year for zip code 76645, filed in 2021:
Average Adjusted Gross Income (AGI) in 2020: $49,528 (Individual Income Tax Returns)
Here:
$49,528
State:
$77,054
Salary/wage: $42,568 (reported on 83.1% of returns)
Here:
$42,568
State:
$62,766
(% of AGI for various income ranges: 1305.8% for AGIs below $25k, 3801.9% for AGIs $25k-50k, 6245.3% for AGIs $50k-75k, 9132.0% for AGIs $75k-100k, 17564.8% for AGIs $100k-200k, 58136.7% for AGIs over 200k)
Taxable interest for individuals: $1,825 (reported on 20.5% of returns)
This zip code:
$1,825
Texas:
$2,665
(% of AGI for various income ranges: 12.4% for AGIs below $25k, 18.4% for AGIs $25k-50k, 34.0% for AGIs $50k-75k, 69.2% for AGIs $75k-100k, 280.0% for AGIs $100k-200k, 1750.0% for AGIs over 200k)
Ordinary dividends: $6,782 (reported on 9.6% of returns)
Here:
$6,782
State:
$10,044
(% of AGI for various income ranges: 15.5% for AGIs below $25k, 22.8% for AGIs $25k-50k, 73.7% for AGIs $50k-75k, 142.4% for AGIs $75k-100k, 345.2% for AGIs $100k-200k, 4336.7% for AGIs over 200k)
Net capital gain/loss in AGI: +$20,494 (reported on 9.8% of returns)
Here:
+$20,494
State:
+$39,590
(% of AGI for various income ranges: 2.2% for AGIs below $25k, 16.1% for AGIs $25k-50k, 71.6% for AGIs $50k-75k, 166.8% for AGIs $75k-100k, 631.0% for AGIs $100k-200k, 26220.0% for AGIs over 200k)
Profit/loss from business: +$11,062 (reported on 15.6% of returns)
Here:
+$11,062
State:
+$10,888
(% of AGI for various income ranges: 121.4% for AGIs below $25k, 124.6% for AGIs $25k-50k, 160.2% for AGIs $50k-75k, 279.6% for AGIs $75k-100k, 636.7% for AGIs $100k-200k, 7880.0% for AGIs over 200k)
Taxable individual retirement arrangement distribution: $16,000 (reported on 6.5% of returns)
76645:
$16,000
Texas:
$24,740
(% of AGI for various income ranges: 37.5% for AGIs below $25k, 59.4% for AGIs $25k-50k, 138.8% for AGIs $50k-75k, 334.8% for AGIs $75k-100k, 1113.8% for AGIs $100k-200k)
Total itemized deductions: $34,825 (reported on 3.1% of returns)
Here:
$34,825
State:
$40,428
(% of AGI for various income ranges: 165.2% for AGIs $25k-50k, 244.4% for AGIs $75k-100k, 522.9% for AGIs $100k-200k, 6156.7% for AGIs over 200k)
Charity contributions: $15,233 (reported on 2.4% of returns)
Here:
$15,233
State:
$18,201
(% of AGI for various income ranges: 12.1% for AGIs $25k-50k, 44.0% for AGIs $50k-75k, 179.0% for AGIs $100k-200k, 3510.0% for AGIs over 200k)
Taxes paid: $5,681 (reported on 3.1% of returns)
76645:
$5,681
State:
$7,821
(% of AGI for various income ranges: 17.8% for AGIs $25k-50k, 53.6% for AGIs $75k-100k, 125.2% for AGIs $100k-200k, 983.3% for AGIs over 200k)
Earned income credit: $2,709 (reported on 23.4% of returns)
Here:
$2,709
State:
$2,584
(% of AGI for various income ranges: 134.4% for AGIs below $25k, 91.3% for AGIs $25k-50k)
Percentage of individuals using paid preparers for their 2020 taxes: 91.7%
Here:
92%
State:
92%
(% for various income ranges: 91.0% for AGIs below $25k, 91.3% for AGIs $25k-50k, 91.8% for AGIs $50k-75k, 91.4% for AGIs $75k-100k, 94.9% for AGIs $100k-200k, 100.0% for AGIs over 200k)
Averages for the 2012 tax year for zip code 76645, filed in 2013:
Average Adjusted Gross Income (AGI) in 2012: $41,851 (Individual Income Tax Returns)
Here:
$41,851
State:
$65,384
Salary/wage: $33,332 (reported on 82.7% of returns)
Here:
$33,332
State:
$52,524
(% of AGI for various income ranges: 77.1% for AGIs below $25k, 84.8% for AGIs $25k-50k, 75.1% for AGIs $50k-75k, 67.4% for AGIs $75k-100k, 63.6% for AGIs $100k-200k, 21.0% for AGIs over 200k)
Taxable interest for individuals: $2,080 (reported on 23.3% of returns)
This zip code:
$2,080
Texas:
$2,372
(% of AGI for various income ranges: 1.0% for AGIs below $25k, 0.6% for AGIs $25k-50k, 1.6% for AGIs $50k-75k, 1.4% for AGIs $75k-100k, 1.1% for AGIs $100k-200k, 1.6% for AGIs over 200k)
Ordinary dividends: $9,398 (reported on 12.3% of returns)
Here:
$9,398
State:
$9,721
(% of AGI for various income ranges: 6.0% for AGIs below $25k, 0.6% for AGIs $25k-50k, 1.1% for AGIs $50k-75k, 1.3% for AGIs $75k-100k, 1.7% for AGIs $100k-200k, 6.5% for AGIs over 200k)
Net capital gain/loss in AGI: +$11,924 (reported on 9.9% of returns)
Here:
+$11,924
State:
+$35,319
(% of AGI for various income ranges: 0.7% for AGIs $25k-50k, 0.6% for AGIs $50k-75k, 1.0% for AGIs $75k-100k, 2.6% for AGIs $100k-200k, 12.3% for AGIs over 200k)
Profit/loss from business: +$11,919 (reported on 13.6% of returns)
Here:
+$11,919
State:
+$13,732
(% of AGI for various income ranges: 5.9% for AGIs below $25k, 2.0% for AGIs $25k-50k, 1.6% for AGIs $50k-75k, 3.7% for AGIs $75k-100k, 3.4% for AGIs $100k-200k, 7.4% for AGIs over 200k)
Taxable individual retirement arrangement distribution: $12,403 (reported on 8.4% of returns)
76645:
$12,403
Texas:
$19,511
(% of AGI for various income ranges: 2.3% for AGIs below $25k, 1.6% for AGIs $25k-50k, 2.5% for AGIs $50k-75k, 4.4% for AGIs $75k-100k, 5.0% for AGIs $100k-200k)
Total itemized deductions: $20,387 (19% of AGI, reported on 13.0% of returns)
Here:
$20,387
State:
$24,724
Here:
19.4% of AGI
State:
15.9% of AGI
(% of AGI for various income ranges: 4.3% for AGIs below $25k, 4.3% for AGIs $25k-50k, 6.5% for AGIs $50k-75k, 8.1% for AGIs $75k-100k, 9.2% for AGIs $100k-200k, 6.7% for AGIs over 200k)
Charity contributions: $6,922 (reported on 9.7% of returns)
Here:
$6,922
State:
$6,808
(% of AGI for various income ranges: 0.5% for AGIs below $25k, 0.7% for AGIs $25k-50k, 1.2% for AGIs $50k-75k, 1.6% for AGIs $75k-100k, 2.4% for AGIs $100k-200k, 3.4% for AGIs over 200k)
Taxes paid: $4,405 (reported on 13.0% of returns)
76645:
$4,405
State:
$6,921
(% of AGI for various income ranges: 0.7% for AGIs below $25k, 0.7% for AGIs $25k-50k, 1.4% for AGIs $50k-75k, 1.8% for AGIs $75k-100k, 2.4% for AGIs $100k-200k, 1.5% for AGIs over 200k)
Earned income credit: $2,580 (reported on 27.9% of returns)
Here:
$2,580
State:
$2,570
(% of AGI for various income ranges: 8.6% for AGIs below $25k, 1.5% for AGIs $25k-50k)
Percentage of individuals using paid preparers for their 2012 taxes: 53.1%
Here:
53%
State:
51%
(% for various income ranges: 47.4% for AGIs below $25k, 53.6% for AGIs $25k-50k, 62.0% for AGIs $50k-75k, 63.0% for AGIs $75k-100k, 65.4% for AGIs $100k-200k, 85.7% for AGIs over 200k)
Averages for the 2004 tax year for zip code 76645, filed in 2005:
Average Adjusted Gross Income (AGI) in 2004: $33,108 (Individual Income Tax Returns)
Here:
$33,108
State:
$47,881
Salary/wage: $28,249 (reported on 83.2% of returns)
Here:
$28,249
State:
$41,947
(% of AGI for various income ranges: 262.9% for AGIs below $10k, 79.9% for AGIs $10k-25k, 80.6% for AGIs $25k-50k, 73.8% for AGIs $50k-75k, 72.1% for AGIs $75k-100k, 43.0% for AGIs over 100k)
Taxable interest for individuals: $2,601 (reported on 29.1% of returns)
This zip code:
$2,601
Texas:
$2,255
(% of AGI for various income ranges: 14.2% for AGIs below $10k, 2.1% for AGIs $10k-25k, 1.7% for AGIs $25k-50k, 1.9% for AGIs $50k-75k, 1.8% for AGIs $75k-100k, 2.9% for AGIs over 100k)
Taxable dividends: $4,199 (reported on 14.6% of returns)
Here:
$4,199
State:
$4,261
(% of AGI for various income ranges: 3.7% for AGIs below $10k, 1.0% for AGIs $10k-25k, 0.9% for AGIs $25k-50k, 1.3% for AGIs $50k-75k, 0.5% for AGIs $75k-100k, 4.1% for AGIs over 100k)
Net capital gain/loss: +$7,497 (reported on 13.7% of returns)
Here:
+$7,497
State:
+$16,110
(% of AGI for various income ranges: 0.5% for AGIs below $10k, 1.0% for AGIs $10k-25k, 0.5% for AGIs $25k-50k, 1.1% for AGIs $50k-75k, 2.0% for AGIs $75k-100k, 9.2% for AGIs over 100k)
Profit/loss from business: +$11,780 (reported on 14.0% of returns)
Here:
+$11,780
State:
+$11,013
(% of AGI for various income ranges: 3.6% for AGIs below $10k, 3.7% for AGIs $10k-25k, 3.4% for AGIs $25k-50k, 4.0% for AGIs $50k-75k, 0.8% for AGIs $75k-100k, 10.0% for AGIs over 100k)
IRA payment deduction: $3,081 (reported on 1.7% of returns)
76645:
$3,081
Texas:
$3,120
Self-employed pension: $16,684 (reported on 0.4% of returns)
Here:
$16,684
Texas:
$16,401
Total itemized deductions: $17,415 (22% of AGI, reported on 13.8% of returns)
Here:
$17,415
State:
$19,631
Here:
22.4% of AGI
State:
18.9% of AGI
(% of AGI for various income ranges: 14.1% for AGIs below $10k, 4.4% for AGIs $10k-25k, 5.6% for AGIs $25k-50k, 7.4% for AGIs $50k-75k, 9.6% for AGIs $75k-100k, 9.2% for AGIs over 100k)
Charity contributions deductions: $6,436 (8% of AGI, reported on 10.9% of returns)
Here:
$6,436
State:
$4,753
Here:
7.7% of AGI
State:
4.2% of AGI
(% of AGI for various income ranges: 1.8% for AGIs below $10k, 0.8% for AGIs $10k-25k, 1.3% for AGIs $25k-50k, 1.9% for AGIs $50k-75k, 2.2% for AGIs $75k-100k, 4.0% for AGIs over 100k)
Total tax: $5,474 (reported on 63.1% of returns)
76645:
$5,474
State:
$9,058
(% of AGI for various income ranges: 7.1% for AGIs below $10k, 3.0% for AGIs $10k-25k, 6.2% for AGIs $25k-50k, 9.2% for AGIs $50k-75k, 11.6% for AGIs $75k-100k, 20.1% for AGIs over 100k)
Earned income credit: $1,997 (reported on 27.7% of returns)
Here:
$1,997
State:
$2,024
Percentage of individuals using paid preparers for their 2004 taxes: 61.3%
Here:
61%
State:
57%
(% for various income ranges: 55.1% for AGIs below $10k, 64.7% for AGIs $10k-25k, 61.3% for AGIs $25k-50k, 59.6% for AGIs $50k-75k, 60.0% for AGIs $75k-100k, 74.9% for AGIs over 100k)
Likely homosexual households (counted as self-reported same-sex unmarried-partner households)
Lesbian couples: 0.1% of all households
Gay men: 0.0% of all households
Household received Food Stamps/SNAP in the past 12 months: 694 Household did not receive Food Stamps/SNAP in the past 12 months: 3,479
Women who had a birth in the past 12 months: 99 (64 now married, 34 unmarried) Women who did not have a birth in the past 12 months: 2,356 (1,058 now married, 1,297 unmarried)
Housing units in zip code 76645 with a mortgage: 1,078 (4 second mortgage, 5 both second mortgage and home equity loan) Houses without a mortgage: 17
Median monthly owner costs for units with a mortgage: $1,431 Median monthly owner costs for units without a mortgage: $492
Residents with income below the poverty level in 2022:
This zip code:
13.7%
Whole state:
14.0%
Residents with income below 50% of the poverty level in 2022:
This zip code:
6.4%
Whole state:
7.4%
Median number of rooms in houses and condos:
Here:
5.9
State:
6.3
Median number of rooms in apartments:
Here:
4.1
State:
4.0
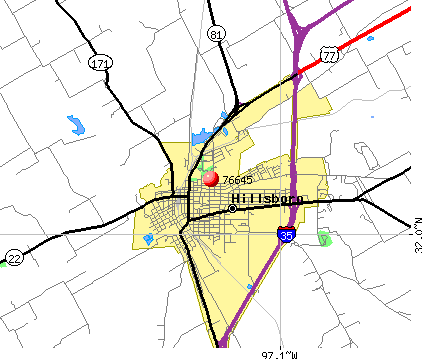
Notable locations in this zip code not listed on our city pages
Notable locations in zip code 76645: Prime Outlets at Hillsboro (A), Hillsboro Cotton Mills (B), Hillsboro Residential Historic District (C), Union Bluff (D), Farmers National Bank (E), Gebhardt Bakery (F), Grimes House (G), Hill County Jail (H), Missouri-Kansas-Texas Company Railroad Station (I), The Harold B Simpson Confederate Research Center (J), Hill County Cellblock Museum (K), Hillsboro Fire Station 2 (L), Hillsboro Fire and Rescue (M), Life Care Plus Emergency Medical Services (N), Old Rock Saloon (O), Western Union Building (P), Tarlton Building (Q), Sturgis National Bank (R). Display/hide their locations on the map
Churches in zip code 76645 include: Church of Christ (A), Mount Moriah Baptist Church (B), Macedonia Baptist Church (C), First Baptist Church Youth (D), Covenant Baptist Church (E), First Assembly of God Church (F), Hill Apostolic Church (G), First Presbyterian Church (H), Mount Zion Lutheran Church (I). Display/hide their locations on the map
Cemeteries: Vaughan Cemetery (1), Woodbury Cemetery (2), Prairiedale Cemetery (3), Park Ridge Cemetery (4), Hillcrest Garden of Memory Cemetery (5), Hickey Cemetery (6). Display/hide their locations on the map
Reservoirs: Isenberg Lake (A), Soil Conservation Service Site 56 Reservoir (B), Soil Conservation Service Site 53 Reservoir (C), Soil Conservation Service Site 60 Reservoir (D), Soil Conservation Service Site 55 Reservoir (E), Soil Conservation Service Site 61 Reservoir (F), Katy Lake (G), Soil Conservation Service Site 54 Reservoir (H). Display/hide their locations on the map
Streams, rivers, and creeks: Rocky Branch (A), Parker Creek (B), Lovelace Creek (C), Horne Branch (D), Jacks Branch (E), Little Hackberry Creek (F), Pecan Creek (G), Cottonwood Creek (H), Coleman Creek (I). Display/hide their locations on the map
1,468 married couples with children.
749 single-parent households (235 men, 514 women).
72.4% of residents of 76645 zip code speak English at home.
25.9% of residents speak Spanish at home (68% very well, 15% well, 16% not well, 2% not at all).
0.9% of residents speak other Indo-European language at home (49% very well, 51% well).
0.4% of residents speak Asian or Pacific Island language at home (37% very well, 63% well).
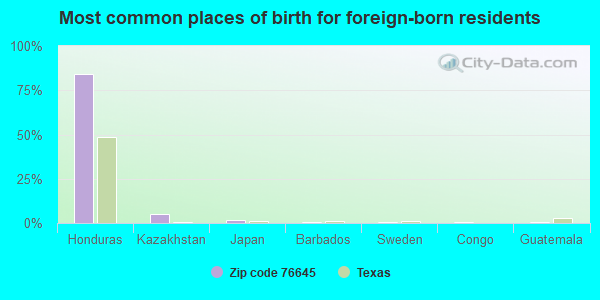
Foreign born population: 1,373 (12.2%) (39.7% of them are naturalized citizens)
This zip code:
12.2%
Whole state:
17.2%
84%Honduras
5%Kazakhstan
2%Japan
1%Barbados
1%Sweden
1%Congo
0%Guatemala
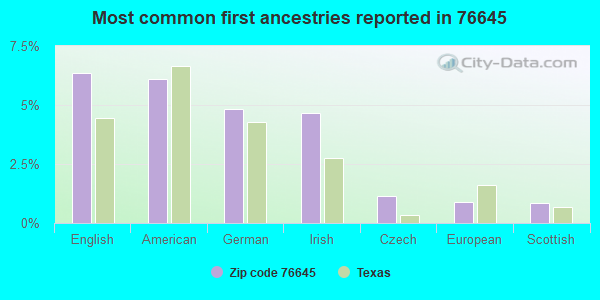
6%English
6%American
5%German
5%Irish
1%Czech
1%European
1%Scottish
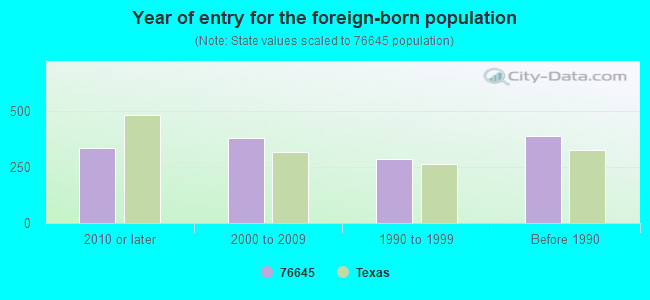
Year of entry for the foreign-born population
3362010 or later
3782000 to 2009
2871990 to 1999
387Before 1990
Facilities with environmental interests located in this zip code:
AMERICAN TELEPHONE AND TELEGRAPH COMPANY (1.6 MI NE L432350 in WOODBURY, TX)
(Resource Conservation and Recovery Act (tracking hazardous waste)) Alternative names: AMERICAN TEL & TEL CO LONG LINES
7-ELEVEN, INC. (1500 EAST CORSICANA HIGHWAY in HILLSBORO, TX)
National Pollutant Discharge Elimination System NON-MAJOR (Tracking pollutant discharge elimination systems) - permit Business SIC classification: NONCLASSIFIABLE ESTABLISHMENTS Alternative names: IT CORPORATION (7-ELEVEN)
Housing units lacking complete plumbing facilities: 2.4% Housing units lacking complete kitchen facilities: 7.0%
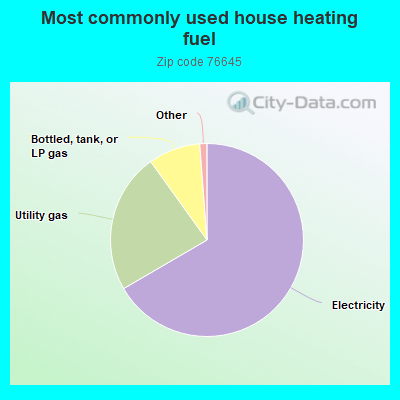
66.6%Electricity
23.5%Utility gas
8.7%Bottled, tank, or LP gas
Population in 1990: 8,966. Population change in the 1990s: +1,954 (+21.8%).
Place of birth for U.S.-born residents:
This state: 7,882
Northeast: 208
Midwest: 557
South: 594
West: 552
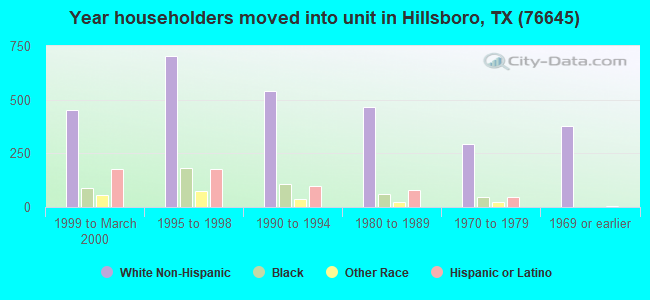
59% of the 76645 zip code residents lived in the same house 5 years ago. Out of people who lived in different houses, 57% lived in this county. Out of people who lived in different counties, 50% lived in Texas.
87% of the 76645 zip code residents lived in the same house 1 year ago. Out of people who lived in different houses, 39% moved from this county. Out of people who lived in different houses, 47% moved from different county within same state. Out of people who lived in different houses, 3% moved from different state. Out of people who lived in different houses, 11% moved from abroad.
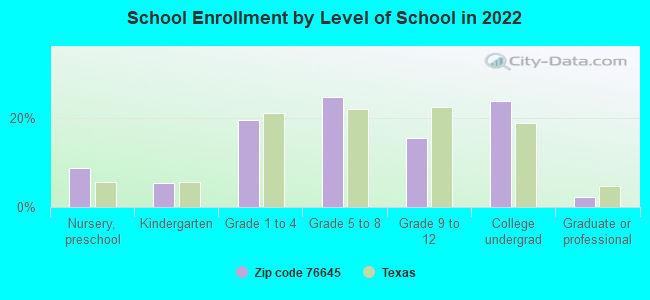
Private vs. public school enrollment:
Students in private schools in grades 1 to 8 (elementary and middle school): 9
Here:
0.9%
Texas:
8.8%
Students in private schools in grades 9 to 12 (high school): 32
Here:
8.3%
Texas:
8.0%
Students in private undergraduate colleges: 52
Here:
8.8%
Texas:
16.2%
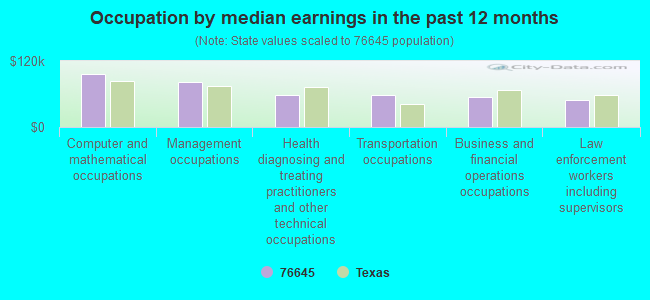
Occupation by median earnings in the past 12 months ($)
96,803Computer and mathematical occupations
81,101Management occupations
58,504Health diagnosing and treating practitioners and other technical occupations
57,863Transportation occupations
54,792Business and financial operations occupations
49,461Law enforcement workers including supervisors
Companies with federal contracts located in this zip code:
HILL, COUNTY OF (COURT HOUSE ANNEX 126 COVI in HILLSBORO, TX) : $97,862 in 3 contractsfrom 2005 to 2006
$40,052 with Army for Other Professional Services. Signed on 2006-03-29. Completion date: 2006-09-30.
$28,905, same as above.Signed on 2005-04-07. Completion date: 2005-09-30.
$28,905 with U.S. Army Corps of Engineers - civil program financing only for Other Professional Services. Signed on 2005-04-07. Completion date: 2005-09-30.
Top industries in this zip code by the number of employees in 2005:
Construction: Power and Communication Line and Related Structures Construction (250-499 employees: 1 establishment)
Other Services (except Public Administration): Religious Organizations (20-49: 1, 10-19: 3, 5-9: 2, 1-4: 6)
People in group quarters in 2010:
246 people in college/university student housing
179 people in nursing facilities/skilled-nursing facilities
139 people in local jails and other municipal confinement facilities
People in group quarters in 2000:
192 people in college dormitories (includes college quarters off campus)
160 people in nursing homes
80 people in local jails and other confinement facilities (including police lockups)
76 people in other group homes
Fatal accident statistics in 2014:
Fatal accident count: 4
Vehicles involved in fatal accidents: 5
Fatal accidents caused by drunken drivers: 1
Fatalities: 4
Persons involved in fatal accidents: 5
Pedestrians involved in fatal accidents: 1
Fatal accident statistics in 2013:
Fatal accident count: 6
Vehicles involved in fatal accidents: 12
Fatal accidents caused by drunken drivers: 2
Fatalities: 6
Persons involved in fatal accidents: 18
Pedestrians involved in fatal accidents: 0
2003 - 2018 National Fire Incident Reporting System (NFIRS) incidents
Based on the data from the years 2003 - 2018 the average number of fire incidents per year is 105. The highest number of reported fire incidents - 207 took place in 2011, and the least - 7 in 2003. The data has an increasing trend.
When looking into fire subcategories, the most incidents belonged to: Outside Fires (55.2%), and Structure Fires (20.8%).
Fire incident types reported to NFIRS in Zip Code 76645


 Nearest zip codes: 76055, 76621, 76631, 76670, 76628, 76692.


 Based on the data from the years 2003 - 2018 the average number of fire incidents per year is 105. The highest number of reported fire incidents - 207 took place in 2011, and the least - 7 in 2003. The data has an increasing trend.
 When looking into fire subcategories, the most incidents belonged to: Outside Fires (55.2%), and Structure Fires (20.8%).