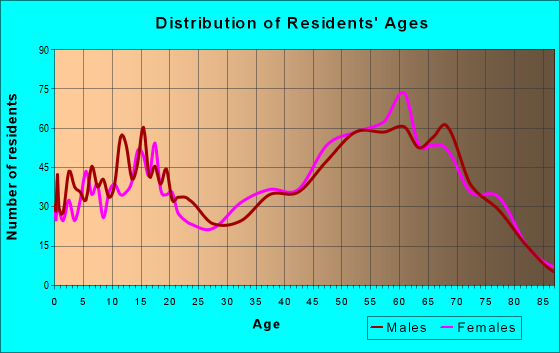
Estimated zip code population in 2022: 7,665 Zip code population in 2010: 6,824 Zip code population in 2000: 5,894
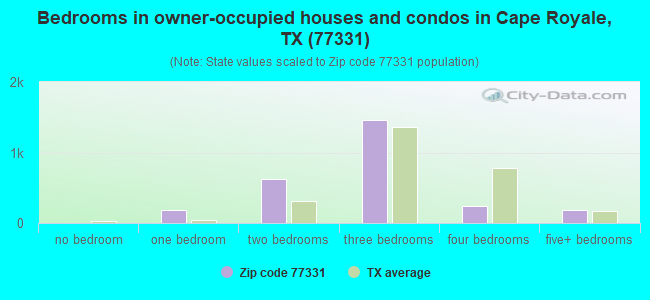
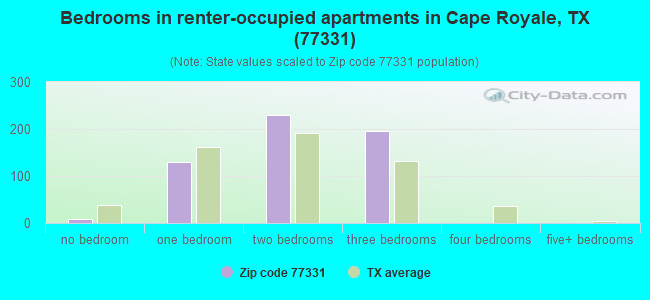
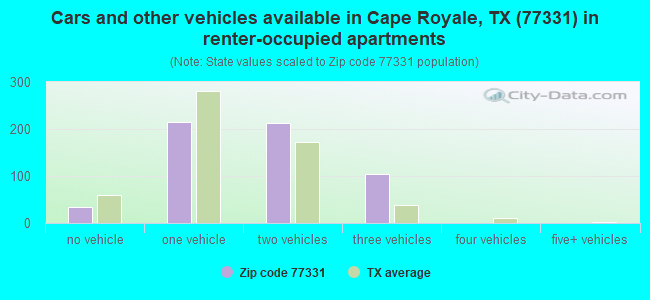
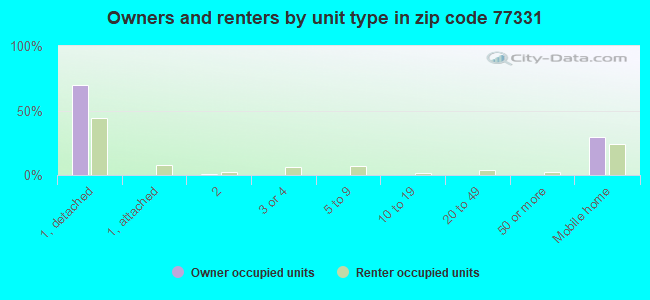
Houses and condos: 5,013 Renter-occupied apartments: 572
% of renters here:
17%
State:
38%
March 2022 cost of living index in zip code 77331: 81.0 (low, U.S. average is 100)
Land area: 153.1 sq. mi. Water area: 25.0 sq. mi.
Population density: 50 people per square mile
(very low).
OSM Map
General Map
Google Map
MSN Map
OSM Map
General Map
Google Map
MSN Map
OSM Map
General Map
Google Map
MSN Map
OSM Map
General Map
Google Map
MSN Map
Please wait while loading the map...
Real estate property taxes paid for housing units in 2022:
This zip code:
0.9% ($1,961)
Texas:
1.5% ($4,050)
Median real estate property taxes paid for housing units with mortgages in 2022: $2,366 (1.3%) Median real estate property taxes paid for housing units with no mortgage in 2022: $1,726 (0.6%)
Averages for the 2020 tax year for zip code 77331, filed in 2021:
Average Adjusted Gross Income (AGI) in 2020: $64,607 (Individual Income Tax Returns)
Here:
$64,607
State:
$77,054
Salary/wage: $55,110 (reported on 75.3% of returns)
Here:
$55,110
State:
$62,766
(% of AGI for various income ranges: 1051.7% for AGIs below $25k, 3080.0% for AGIs $25k-50k, 5722.4% for AGIs $50k-75k, 8790.0% for AGIs $75k-100k, 16135.2% for AGIs $100k-200k, 71727.5% for AGIs over 200k)
Taxable interest for individuals: $1,883 (reported on 27.2% of returns)
This zip code:
$1,883
Texas:
$2,665
(% of AGI for various income ranges: 17.8% for AGIs below $25k, 22.0% for AGIs $25k-50k, 55.0% for AGIs $50k-75k, 62.9% for AGIs $75k-100k, 224.0% for AGIs $100k-200k, 1232.5% for AGIs over 200k)
Ordinary dividends: $8,832 (reported on 15.4% of returns)
Here:
$8,832
State:
$10,044
(% of AGI for various income ranges: 18.1% for AGIs below $25k, 35.7% for AGIs $25k-50k, 97.9% for AGIs $50k-75k, 253.3% for AGIs $75k-100k, 475.6% for AGIs $100k-200k, 4980.0% for AGIs over 200k)
Net capital gain/loss in AGI: +$16,854 (reported on 14.8% of returns)
Here:
+$16,854
State:
+$39,590
(% of AGI for various income ranges: 19.7% for AGIs below $25k, 22.5% for AGIs $25k-50k, 72.9% for AGIs $50k-75k, 281.4% for AGIs $75k-100k, 662.8% for AGIs $100k-200k, 13225.0% for AGIs over 200k)
Profit/loss from business: +$7,445 (reported on 21.9% of returns)
Here:
+$7,445
State:
+$10,888
(% of AGI for various income ranges: 125.8% for AGIs below $25k, 130.8% for AGIs $25k-50k, 241.5% for AGIs $50k-75k, 120.0% for AGIs $75k-100k, 475.2% for AGIs $100k-200k, 2895.0% for AGIs over 200k)
Taxable individual retirement arrangement distribution: $27,132 (reported on 12.3% of returns)
77331:
$27,132
Texas:
$24,740
(% of AGI for various income ranges: 78.8% for AGIs below $25k, 186.5% for AGIs $25k-50k, 315.0% for AGIs $50k-75k, 820.0% for AGIs $75k-100k, 1324.4% for AGIs $100k-200k, 7380.0% for AGIs over 200k)
Total itemized deductions: $33,840 (reported on 6.2% of returns)
Here:
$33,840
State:
$40,428
(% of AGI for various income ranges: 101.9% for AGIs below $25k, 387.6% for AGIs $50k-75k, 322.4% for AGIs $75k-100k, 692.0% for AGIs $100k-200k, 5417.5% for AGIs over 200k)
Charity contributions: $12,519 (reported on 4.9% of returns)
Here:
$12,519
State:
$18,201
(% of AGI for various income ranges: 186.8% for AGIs $50k-75k, 206.0% for AGIs $100k-200k, 2132.5% for AGIs over 200k)
Taxes paid: $7,295 (reported on 5.9% of returns)
77331:
$7,295
State:
$7,821
(% of AGI for various income ranges: 12.7% for AGIs below $25k, 75.9% for AGIs $50k-75k, 67.6% for AGIs $75k-100k, 164.8% for AGIs $100k-200k, 1162.5% for AGIs over 200k)
Earned income credit: $2,411 (reported on 20.1% of returns)
Here:
$2,411
State:
$2,584
(% of AGI for various income ranges: 130.0% for AGIs below $25k, 74.8% for AGIs $25k-50k)
Percentage of individuals using paid preparers for their 2020 taxes: 90.1%
Here:
90%
State:
92%
(% for various income ranges: 90.3% for AGIs below $25k, 90.5% for AGIs $25k-50k, 89.4% for AGIs $50k-75k, 90.9% for AGIs $75k-100k, 88.4% for AGIs $100k-200k, 92.9% for AGIs over 200k)
Averages for the 2012 tax year for zip code 77331, filed in 2013:
Average Adjusted Gross Income (AGI) in 2012: $65,300 (Individual Income Tax Returns)
Here:
$65,300
State:
$65,384
Salary/wage: $49,137 (reported on 75.5% of returns)
Here:
$49,137
State:
$52,524
(% of AGI for various income ranges: 68.8% for AGIs below $25k, 70.4% for AGIs $25k-50k, 63.2% for AGIs $50k-75k, 61.6% for AGIs $75k-100k, 67.7% for AGIs $100k-200k, 38.0% for AGIs over 200k)
Taxable interest for individuals: $1,744 (reported on 31.0% of returns)
This zip code:
$1,744
Texas:
$2,372
(% of AGI for various income ranges: 1.1% for AGIs below $25k, 0.8% for AGIs $25k-50k, 1.0% for AGIs $50k-75k, 0.7% for AGIs $75k-100k, 0.6% for AGIs $100k-200k, 0.9% for AGIs over 200k)
Ordinary dividends: $7,810 (reported on 15.7% of returns)
Here:
$7,810
State:
$9,721
(% of AGI for various income ranges: 1.5% for AGIs below $25k, 1.7% for AGIs $25k-50k, 1.4% for AGIs $50k-75k, 1.2% for AGIs $75k-100k, 1.0% for AGIs $100k-200k, 3.0% for AGIs over 200k)
Net capital gain/loss in AGI: +$10,543 (reported on 13.4% of returns)
Here:
+$10,543
State:
+$35,319
(% of AGI for various income ranges: 0.2% for AGIs $25k-50k, 0.6% for AGIs $50k-75k, 0.9% for AGIs $75k-100k, 1.2% for AGIs $100k-200k, 5.1% for AGIs over 200k)
Profit/loss from business: +$12,035 (reported on 21.1% of returns)
Here:
+$12,035
State:
+$13,732
(% of AGI for various income ranges: 12.7% for AGIs below $25k, 3.5% for AGIs $25k-50k, 2.5% for AGIs $50k-75k, 3.9% for AGIs $75k-100k, 5.1% for AGIs $100k-200k, 1.9% for AGIs over 200k)
Taxable individual retirement arrangement distribution: $20,451 (reported on 14.2% of returns)
77331:
$20,451
Texas:
$19,511
(% of AGI for various income ranges: 4.1% for AGIs below $25k, 2.9% for AGIs $25k-50k, 6.0% for AGIs $50k-75k, 6.5% for AGIs $75k-100k, 5.8% for AGIs $100k-200k, 3.1% for AGIs over 200k)
Total itemized deductions: $24,519 (16% of AGI, reported on 23.8% of returns)
Here:
$24,519
State:
$24,724
Here:
16.3% of AGI
State:
15.9% of AGI
(% of AGI for various income ranges: 8.7% for AGIs below $25k, 8.1% for AGIs $25k-50k, 10.5% for AGIs $50k-75k, 10.4% for AGIs $75k-100k, 11.5% for AGIs $100k-200k, 6.7% for AGIs over 200k)
Charity contributions: $5,280 (reported on 19.2% of returns)
Here:
$5,280
State:
$6,808
(% of AGI for various income ranges: 1.0% for AGIs below $25k, 1.3% for AGIs $25k-50k, 1.7% for AGIs $50k-75k, 1.9% for AGIs $75k-100k, 2.3% for AGIs $100k-200k, 1.1% for AGIs over 200k)
Taxes paid: $6,672 (reported on 23.0% of returns)
77331:
$6,672
State:
$6,921
(% of AGI for various income ranges: 1.8% for AGIs below $25k, 1.4% for AGIs $25k-50k, 2.0% for AGIs $50k-75k, 2.2% for AGIs $75k-100k, 3.0% for AGIs $100k-200k, 2.6% for AGIs over 200k)
Earned income credit: $2,497 (reported on 22.6% of returns)
Here:
$2,497
State:
$2,570
(% of AGI for various income ranges: 9.2% for AGIs below $25k, 1.2% for AGIs $25k-50k)
Percentage of individuals using paid preparers for their 2012 taxes: 51.7%
Here:
52%
State:
51%
(% for various income ranges: 47.1% for AGIs below $25k, 49.3% for AGIs $25k-50k, 55.6% for AGIs $50k-75k, 60.9% for AGIs $75k-100k, 56.0% for AGIs $100k-200k, 75.0% for AGIs over 200k)
Averages for the 2004 tax year for zip code 77331, filed in 2005:
Average Adjusted Gross Income (AGI) in 2004: $38,663 (Individual Income Tax Returns)
Here:
$38,663
State:
$47,881
Salary/wage: $35,988 (reported on 76.4% of returns)
Here:
$35,988
State:
$41,947
(% of AGI for various income ranges: 129.6% for AGIs below $10k, 69.2% for AGIs $10k-25k, 74.1% for AGIs $25k-50k, 70.4% for AGIs $50k-75k, 70.0% for AGIs $75k-100k, 67.2% for AGIs over 100k)
Taxable interest for individuals: $1,911 (reported on 36.3% of returns)
This zip code:
$1,911
Texas:
$2,255
(% of AGI for various income ranges: 9.0% for AGIs below $10k, 2.1% for AGIs $10k-25k, 1.6% for AGIs $25k-50k, 1.5% for AGIs $50k-75k, 0.9% for AGIs $75k-100k, 2.1% for AGIs over 100k)
Taxable dividends: $2,571 (reported on 18.5% of returns)
Here:
$2,571
State:
$4,261
(% of AGI for various income ranges: 6.5% for AGIs below $10k, 1.4% for AGIs $10k-25k, 1.1% for AGIs $25k-50k, 1.0% for AGIs $50k-75k, 0.6% for AGIs $75k-100k, 1.4% for AGIs over 100k)
Net capital gain/loss: +$6,519 (reported on 17.1% of returns)
Here:
+$6,519
State:
+$16,110
(% of AGI for various income ranges: -0.7% for AGIs below $10k, -0.2% for AGIs $10k-25k, 1.1% for AGIs $25k-50k, 1.1% for AGIs $50k-75k, 1.5% for AGIs $75k-100k, 7.6% for AGIs over 100k)
Profit/loss from business: +$6,886 (reported on 19.9% of returns)
Here:
+$6,886
State:
+$11,013
(% of AGI for various income ranges: 0.7% for AGIs below $10k, 7.0% for AGIs $10k-25k, 2.8% for AGIs $25k-50k, 1.7% for AGIs $50k-75k, 5.8% for AGIs $75k-100k, 3.1% for AGIs over 100k)
IRA payment deduction: $3,500 (reported on 2.7% of returns)
77331:
$3,500
Texas:
$3,120
(% of AGI for various income ranges: 0.3% for AGIs $10k-25k, 0.3% for AGIs $25k-50k, 0.4% for AGIs $50k-75k, 0.2% for AGIs over 100k)
Total itemized deductions: $17,546 (23% of AGI, reported on 21.3% of returns)
Here:
$17,546
State:
$19,631
Here:
23.5% of AGI
State:
18.9% of AGI
(% of AGI for various income ranges: 14.6% for AGIs below $10k, 7.2% for AGIs $10k-25k, 9.3% for AGIs $25k-50k, 9.2% for AGIs $50k-75k, 11.4% for AGIs $75k-100k, 10.2% for AGIs over 100k)
Charity contributions deductions: $3,692 (5% of AGI, reported on 17.1% of returns)
Here:
$3,692
State:
$4,753
Here:
4.7% of AGI
State:
4.2% of AGI
(% of AGI for various income ranges: 0.9% for AGIs below $10k, 0.7% for AGIs $10k-25k, 1.2% for AGIs $25k-50k, 1.4% for AGIs $50k-75k, 2.4% for AGIs $75k-100k, 2.2% for AGIs over 100k)
Total tax: $6,046 (reported on 68.2% of returns)
77331:
$6,046
State:
$9,058
(% of AGI for various income ranges: 4.0% for AGIs below $10k, 3.3% for AGIs $10k-25k, 6.1% for AGIs $25k-50k, 9.0% for AGIs $50k-75k, 11.8% for AGIs $75k-100k, 18.3% for AGIs over 100k)
Earned income credit: $1,961 (reported on 24.8% of returns)
Here:
$1,961
State:
$2,024
Percentage of individuals using paid preparers for their 2004 taxes: 59.4%
Here:
59%
State:
57%
(% for various income ranges: 55.8% for AGIs below $10k, 65.8% for AGIs $10k-25k, 56.8% for AGIs $25k-50k, 55.4% for AGIs $50k-75k, 57.0% for AGIs $75k-100k, 63.9% for AGIs over 100k)
Household received Food Stamps/SNAP in the past 12 months: 626 Household did not receive Food Stamps/SNAP in the past 12 months: 2,667
Women who had a birth in the past 12 months: 174 (120 now married, 54 unmarried) Women who did not have a birth in the past 12 months: 1,173 (599 now married, 572 unmarried)
Housing units in zip code 77331 with a mortgage: 1,109 (31 second mortgage, 7 both second mortgage and home equity loan) Median monthly owner costs for units with a mortgage: $1,429 Median monthly owner costs for units without a mortgage: $613
Residents with income below the poverty level in 2022:
This zip code:
15.3%
Whole state:
14.0%
Residents with income below 50% of the poverty level in 2022:
This zip code:
8.5%
Whole state:
7.4%
Median number of rooms in houses and condos:
Here:
4.9
State:
6.3
Median number of rooms in apartments:
Here:
4.4
State:
4.0
Notable locations in this zip code not listed on our city pages
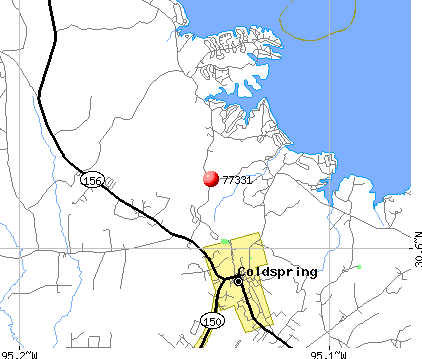
Notable locations in zip code 77331: Willow Springs Lookout (A), San Jacipto Work Center (B), Big Woods Hunter Camp (C), Double Lake Campground (D), Lone Star Trail Primitive Camp Number One (E), Liberty Hill Lookout (F), Lone Star Trail Primitive Camp Number Two (G), San Jacinto Old Jail Museum (H), Coldspring Volunteer Fire Department Substation (I), Coldspring Volunteer Fire Department (J), Camilla Volunteer Fire Department (K), San Jacinto County Jail (L). Display/hide their locations on the map
Churches in zip code 77331 include: Spring Hill Church (A), Spring Ridge Church (B), Sweet Home Church (C), Paul Horton Memorial Church (D), Laurel Hill Church (E). Display/hide their locations on the map
Cemeteries: Cochran Cemetery (1), Butler Cemetery (2), Ellis Cemetery (3), Carter Cemetery (4), Evergreen Cemetery (5), Rose Hill Cemetery (6), Harrell Cemetery (7). Display/hide their locations on the map
Lakes and reservoirs: Blue Lake (A), Stock Pen Lake (B), Henry Lake (C), Wood Lake (D), Lake Livingston (E), Evans Lake (F), Double Lake (G), Woodlands Golf Course Lake (H). Display/hide their locations on the map
Streams, rivers, and creeks: Sand Creek (A), Negro Creek (B), Indian Creek (C), Williams Creek (D), West Fork Pumpkin Creek (E), Ross Branch (F), Reese Branch (G), Oil Creek (H), Miller Creek (I). Display/hide their locations on the map
Parks in zip code 77331 include: Wolf Creek Park (1), Double Lake Recreation Area (2), Coldspring Memorial Park (3). Display/hide their locations on the map
In group quarters: 69 (-1 institutionalized population)
Size of family households: 1,314 2-persons, 247 3-persons, 172 4-persons, 228 5-persons, 66 6-persons, 71 7-or-more-persons
Size of nonfamily households: 1,027 1-person, 161 2-persons, 14 4-persons
524 married couples with children.
241 single-parent households (112 men, 129 women).
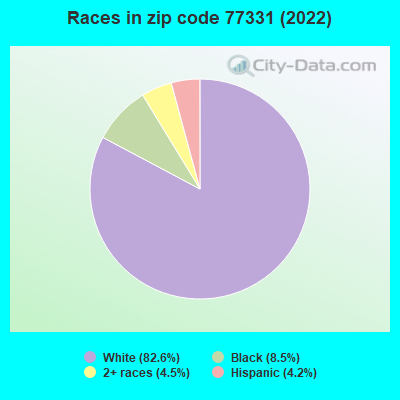
94.2% of residents of 77331 zip code speak English at home.
4.9% of residents speak Spanish at home (86% very well, 9% well, 5% not well).
0.1% of residents speak other Indo-European language at home (20% very well, 80% well).
1.4% of residents speak other language at home (100% very well).
Foreign born population: 206 (2.7%) (49.6% of them are naturalized citizens)
This zip code:
2.7%
Whole state:
17.2%
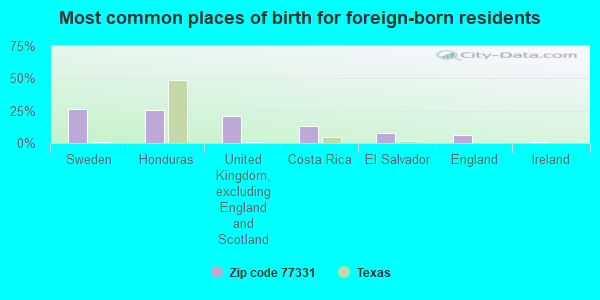
26%Sweden
26%Honduras
20%United Kingdom, excluding England and Scotland
13%Costa Rica
8%El Salvador
6%England
1%Ireland
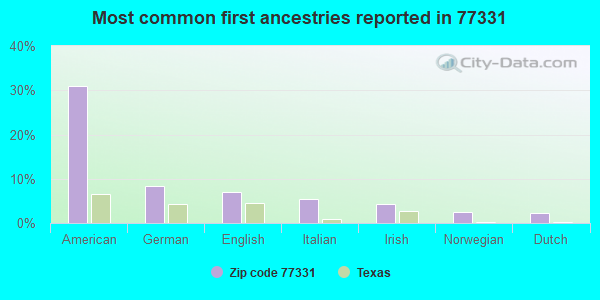
31%American
8%German
7%English
5%Italian
4%Irish
2%Norwegian
2%Dutch
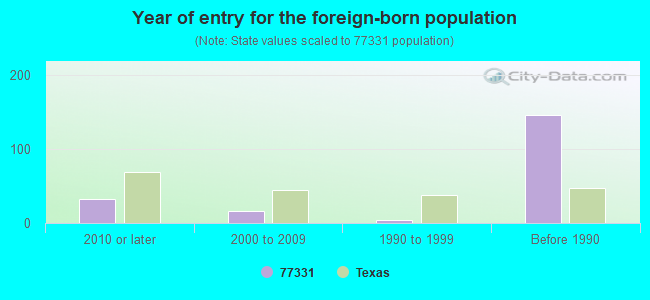
Year of entry for the foreign-born population
332010 or later
162000 to 2009
41990 to 1999
146Before 1990
Facilities with environmental interests located in this zip code:
AMERICAN TELEPHONE AND TELEGRAPH CORPORA (.8 MI NE L436390 in CAMILLA, TX)
(Resource Conservation and Recovery Act (tracking hazardous waste)) Alternative names: AMERICAN TEL & TEL CO LONG LINES
Housing units lacking complete plumbing facilities: 4.2% Housing units lacking complete kitchen facilities: 0.7%
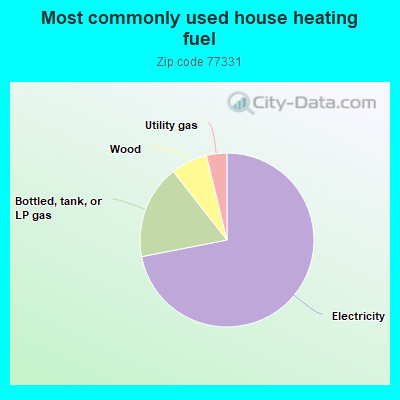
72.0%Electricity
17.5%Bottled, tank, or LP gas
6.8%Wood
3.8%Utility gas
Population in 1990: 3,182. Population change in the 1990s: +2,712 (+85.2%).
Place of birth for U.S.-born residents:
This state: 5,369
Northeast: 179
Midwest: 317
South: 1,088
West: 474
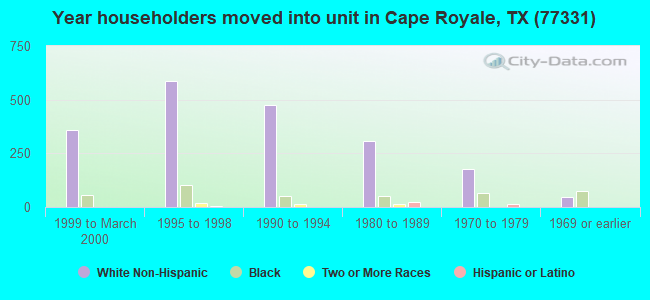
61% of the 77331 zip code residents lived in the same house 5 years ago. Out of people who lived in different houses, 34% lived in this county. Out of people who lived in different counties, 50% lived in Texas.
88% of the 77331 zip code residents lived in the same house 1 year ago. Out of people who lived in different houses, 27% moved from this county. Out of people who lived in different houses, 55% moved from different county within same state. Out of people who lived in different houses, 18% moved from different state. Out of people who lived in different houses, 2% moved from abroad.
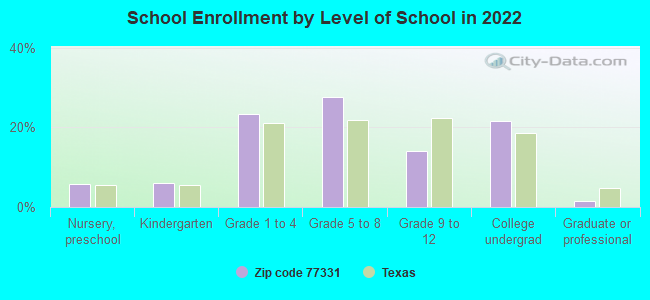
Private vs. public school enrollment:
Students in private schools in grades 1 to 8 (elementary and middle school): 2
Here:
0.3%
Texas:
8.8%
Students in private schools in grades 9 to 12 (high school): 28
Here:
14.8%
Texas:
8.0%
Students in private undergraduate colleges: 8
Here:
2.9%
Texas:
16.2%
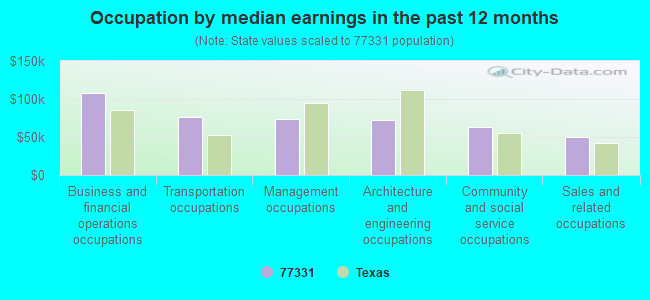
Occupation by median earnings in the past 12 months ($)
107,510Business and financial operations occupations
76,010Transportation occupations
73,453Management occupations
72,600Architecture and engineering occupations
62,718Community and social service occupations
49,838Sales and related occupations
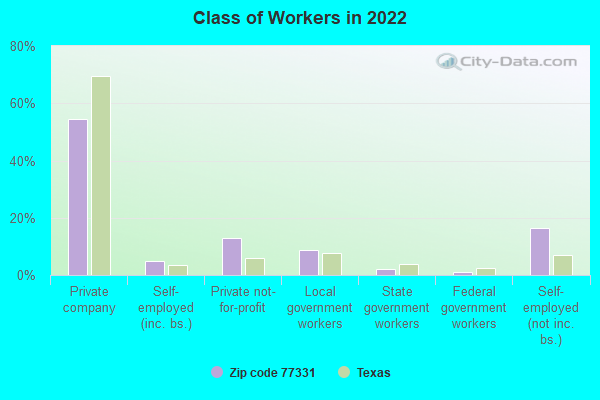
Top industries in this zip code by the number of employees in 2005:
Wholesale Trade: Industrial Machinery and Equipment Merchant Wholesalers (20-49: 1)
Other Services (except Public Administration): Religious Organizations (10-19: 2, 1-4: 1)
Construction: New Single-Family Housing Construction (except Operative Builders) (10-19: 1, 1-4: 1)
People in group quarters in 2010:
54 people in local jails and other municipal confinement facilities
People in group quarters in 2000:
48 people in local jails and other confinement facilities (including police lockups)
Fatal accident statistics in 2014:
Fatal accident count: 3
Vehicles involved in fatal accidents: 4
Fatal accidents caused by drunken drivers: 1
Fatalities: 3
Persons involved in fatal accidents: 6
Pedestrians involved in fatal accidents: 0
Fatal accident statistics in 2013:
Fatal accident count: 3
Vehicles involved in fatal accidents: 4
Fatal accidents caused by drunken drivers: 1
Fatalities: 3
Persons involved in fatal accidents: 6
Pedestrians involved in fatal accidents: 0
2003 - 2018 National Fire Incident Reporting System (NFIRS) incidents
Based on the data from the years 2003 - 2018 the average number of fire incidents per year is 49. The highest number of reported fire incidents - 95 took place in 2009, and the least - 26 in 2003. The data has a rising trend.
When looking into fire subcategories, the most reports belonged to: Outside Fires (50.2%), and Structure Fires (37.9%).
Fire incident types reported to NFIRS in Zip Code 77331


 Nearest zip codes: 77364, 77359, 77360, 77371, 77328, 77335.
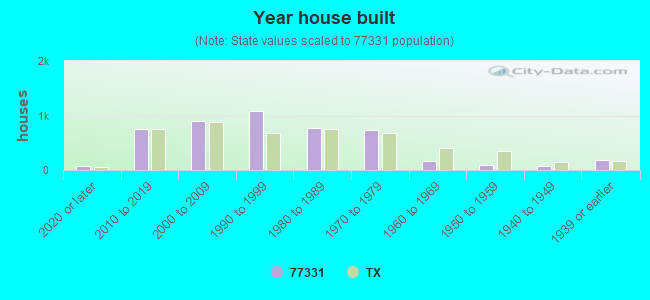


 Based on the data from the years 2003 - 2018 the average number of fire incidents per year is 49. The highest number of reported fire incidents - 95 took place in 2009, and the least - 26 in 2003. The data has a rising trend.
 When looking into fire subcategories, the most reports belonged to: Outside Fires (50.2%), and Structure Fires (37.9%).