Estimated zip code population in 2022: 35,608 Zip code population in 2010: 32,517 Zip code population in 2000: 29,515
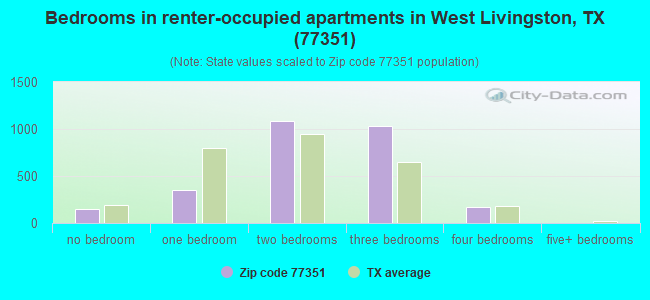
Houses and condos: 18,063 Renter-occupied apartments: 2,808
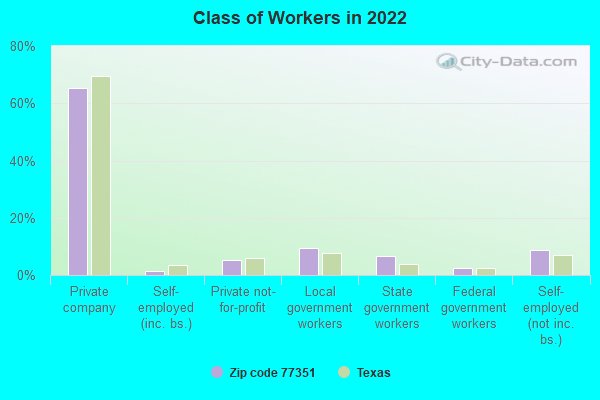
% of renters here:
21%
State:
38%
March 2022 cost of living index in zip code 77351: 79.7 (low, U.S. average is 100)
Land area: 671.4 sq. mi. Water area: 37.0 sq. mi.
Population density: 53 people per square mile
(very low).
OSM Map
General Map
Google Map
MSN Map
OSM Map
General Map
Google Map
MSN Map
OSM Map
General Map
Google Map
MSN Map
OSM Map
General Map
Google Map
MSN Map
Please wait while loading the map...
Real estate property taxes paid for housing units in 2022:
This zip code:
1.0% ($1,805)
Texas:
1.5% ($4,050)
Median real estate property taxes paid for housing units with mortgages in 2022: $2,585 (1.2%) Median real estate property taxes paid for housing units with no mortgage in 2022: $1,446 (0.8%)
Averages for the 2020 tax year for zip code 77351, filed in 2021:
Average Adjusted Gross Income (AGI) in 2020: $55,342 (Individual Income Tax Returns)
Here:
$55,342
State:
$77,054
Salary/wage: $46,722 (reported on 75.3% of returns)
Here:
$46,722
State:
$62,766
(% of AGI for various income ranges: 1073.7% for AGIs below $25k, 3301.1% for AGIs $25k-50k, 6090.5% for AGIs $50k-75k, 8393.6% for AGIs $75k-100k, 15447.0% for AGIs $100k-200k, 55170.0% for AGIs over 200k)
Taxable interest for individuals: $1,974 (reported on 24.5% of returns)
This zip code:
$1,974
Texas:
$2,665
(% of AGI for various income ranges: 10.6% for AGIs below $25k, 20.9% for AGIs $25k-50k, 43.8% for AGIs $50k-75k, 75.3% for AGIs $75k-100k, 221.5% for AGIs $100k-200k, 2067.5% for AGIs over 200k)
Ordinary dividends: $7,766 (reported on 12.1% of returns)
Here:
$7,766
State:
$10,044
(% of AGI for various income ranges: 17.4% for AGIs below $25k, 27.8% for AGIs $25k-50k, 80.0% for AGIs $50k-75k, 167.4% for AGIs $75k-100k, 402.7% for AGIs $100k-200k, 4487.5% for AGIs over 200k)
Net capital gain/loss in AGI: +$23,473 (reported on 11.5% of returns)
Here:
+$23,473
State:
+$39,590
(% of AGI for various income ranges: 12.4% for AGIs below $25k, 31.4% for AGIs $25k-50k, 103.7% for AGIs $50k-75k, 161.4% for AGIs $75k-100k, 651.9% for AGIs $100k-200k, 22103.3% for AGIs over 200k)
Profit/loss from business: +$11,806 (reported on 19.0% of returns)
Here:
+$11,806
State:
+$10,888
(% of AGI for various income ranges: 154.9% for AGIs below $25k, 138.6% for AGIs $25k-50k, 188.5% for AGIs $50k-75k, 284.9% for AGIs $75k-100k, 630.7% for AGIs $100k-200k, 8488.3% for AGIs over 200k)
Taxable individual retirement arrangement distribution: $25,197 (reported on 9.1% of returns)
77351:
$25,197
Texas:
$24,740
(% of AGI for various income ranges: 51.5% for AGIs below $25k, 109.2% for AGIs $25k-50k, 254.2% for AGIs $50k-75k, 649.1% for AGIs $75k-100k, 1368.1% for AGIs $100k-200k, 5089.2% for AGIs over 200k)
Self-employed (Keogh) retirement plans: $35,300 (reported on 0.2% of returns)
77351:
$35,300
Texas:
$29,298
(% of AGI for various income ranges: 882.5% for AGIs over 200k)
Total itemized deductions: $39,376 (reported on 4.2% of returns)
Here:
$39,376
State:
$40,428
(% of AGI for various income ranges: 17.8% for AGIs below $25k, 69.4% for AGIs $25k-50k, 215.5% for AGIs $50k-75k, 350.8% for AGIs $75k-100k, 621.4% for AGIs $100k-200k, 7207.5% for AGIs over 200k)
Charity contributions: $16,870 (reported on 3.3% of returns)
Here:
$16,870
State:
$18,201
(% of AGI for various income ranges: 1.5% for AGIs below $25k, 12.0% for AGIs $25k-50k, 48.1% for AGIs $50k-75k, 90.9% for AGIs $75k-100k, 212.0% for AGIs $100k-200k, 3352.5% for AGIs over 200k)
Taxes paid: $6,711 (reported on 4.1% of returns)
77351:
$6,711
State:
$7,821
(% of AGI for various income ranges: 3.0% for AGIs below $25k, 11.2% for AGIs $25k-50k, 37.0% for AGIs $50k-75k, 52.3% for AGIs $75k-100k, 123.2% for AGIs $100k-200k, 1114.2% for AGIs over 200k)
Earned income credit: $2,670 (reported on 23.5% of returns)
Here:
$2,670
State:
$2,584
(% of AGI for various income ranges: 148.7% for AGIs below $25k, 94.8% for AGIs $25k-50k, 2.4% for AGIs $50k-75k)
Percentage of individuals using paid preparers for their 2020 taxes: 91.9%
Here:
92%
State:
92%
(% for various income ranges: 89.7% for AGIs below $25k, 93.7% for AGIs $25k-50k, 93.3% for AGIs $50k-75k, 92.4% for AGIs $75k-100k, 93.4% for AGIs $100k-200k, 92.3% for AGIs over 200k)
Averages for the 2012 tax year for zip code 77351, filed in 2013:
Average Adjusted Gross Income (AGI) in 2012: $49,872 (Individual Income Tax Returns)
Here:
$49,872
State:
$65,384
Salary/wage: $41,366 (reported on 78.4% of returns)
Here:
$41,366
State:
$52,524
(% of AGI for various income ranges: 73.5% for AGIs below $25k, 75.7% for AGIs $25k-50k, 72.5% for AGIs $50k-75k, 70.0% for AGIs $75k-100k, 65.7% for AGIs $100k-200k, 43.7% for AGIs over 200k)
Taxable interest for individuals: $1,875 (reported on 28.0% of returns)
This zip code:
$1,875
Texas:
$2,372
(% of AGI for various income ranges: 1.1% for AGIs below $25k, 0.9% for AGIs $25k-50k, 0.8% for AGIs $50k-75k, 0.9% for AGIs $75k-100k, 1.1% for AGIs $100k-200k, 1.3% for AGIs over 200k)
Ordinary dividends: $12,152 (reported on 12.6% of returns)
Here:
$12,152
State:
$9,721
(% of AGI for various income ranges: 1.3% for AGIs below $25k, 0.7% for AGIs $25k-50k, 1.0% for AGIs $50k-75k, 1.4% for AGIs $75k-100k, 2.1% for AGIs $100k-200k, 9.2% for AGIs over 200k)
Net capital gain/loss in AGI: +$11,230 (reported on 11.4% of returns)
Here:
+$11,230
State:
+$35,319
(% of AGI for various income ranges: 0.2% for AGIs below $25k, 0.5% for AGIs $25k-50k, 0.5% for AGIs $50k-75k, 0.8% for AGIs $75k-100k, 2.1% for AGIs $100k-200k, 8.2% for AGIs over 200k)
Profit/loss from business: +$12,934 (reported on 19.1% of returns)
Here:
+$12,934
State:
+$13,732
(% of AGI for various income ranges: 10.9% for AGIs below $25k, 4.4% for AGIs $25k-50k, 3.7% for AGIs $50k-75k, 3.6% for AGIs $75k-100k, 4.2% for AGIs $100k-200k, 4.6% for AGIs over 200k)
Taxable individual retirement arrangement distribution: $17,112 (reported on 10.0% of returns)
77351:
$17,112
Texas:
$19,511
(% of AGI for various income ranges: 3.0% for AGIs below $25k, 2.5% for AGIs $25k-50k, 3.5% for AGIs $50k-75k, 4.9% for AGIs $75k-100k, 5.1% for AGIs $100k-200k, 1.9% for AGIs over 200k)
Self-employment retirement plans: $14,875 (reported on 0.4% of returns)
77351:
$14,875
Texas:
$23,938
Total itemized deductions: $23,578 (20% of AGI, reported on 17.8% of returns)
Here:
$23,578
State:
$24,724
Here:
20.0% of AGI
State:
15.9% of AGI
(% of AGI for various income ranges: 6.7% for AGIs below $25k, 6.5% for AGIs $25k-50k, 8.8% for AGIs $50k-75k, 10.3% for AGIs $75k-100k, 10.4% for AGIs $100k-200k, 7.5% for AGIs over 200k)
Charity contributions: $6,978 (reported on 12.2% of returns)
Here:
$6,978
State:
$6,808
(% of AGI for various income ranges: 0.5% for AGIs below $25k, 0.9% for AGIs $25k-50k, 1.4% for AGIs $50k-75k, 1.6% for AGIs $75k-100k, 2.4% for AGIs $100k-200k, 2.6% for AGIs over 200k)
Taxes paid: $4,675 (reported on 17.3% of returns)
77351:
$4,675
State:
$6,921
(% of AGI for various income ranges: 0.9% for AGIs below $25k, 1.1% for AGIs $25k-50k, 1.5% for AGIs $50k-75k, 2.1% for AGIs $75k-100k, 2.4% for AGIs $100k-200k, 1.5% for AGIs over 200k)
Earned income credit: $2,524 (reported on 27.2% of returns)
Here:
$2,524
State:
$2,570
(% of AGI for various income ranges: 9.8% for AGIs below $25k, 1.5% for AGIs $25k-50k)
Percentage of individuals using paid preparers for their 2012 taxes: 61.2%
Here:
61%
State:
51%
(% for various income ranges: 59.1% for AGIs below $25k, 60.0% for AGIs $25k-50k, 62.3% for AGIs $50k-75k, 63.7% for AGIs $75k-100k, 69.0% for AGIs $100k-200k, 78.3% for AGIs over 200k)
Averages for the 2004 tax year for zip code 77351, filed in 2005:
Average Adjusted Gross Income (AGI) in 2004: $32,707 (Individual Income Tax Returns)
Here:
$32,707
State:
$47,881
Salary/wage: $29,995 (reported on 77.4% of returns)
Here:
$29,995
State:
$41,947
(% of AGI for various income ranges: 196.9% for AGIs below $10k, 72.7% for AGIs $10k-25k, 75.7% for AGIs $25k-50k, 74.7% for AGIs $50k-75k, 70.0% for AGIs $75k-100k, 52.5% for AGIs over 100k)
Taxable interest for individuals: $2,319 (reported on 35.5% of returns)
This zip code:
$2,319
Texas:
$2,255
(% of AGI for various income ranges: 18.3% for AGIs below $10k, 2.5% for AGIs $10k-25k, 1.8% for AGIs $25k-50k, 2.0% for AGIs $50k-75k, 1.7% for AGIs $75k-100k, 3.2% for AGIs over 100k)
Taxable dividends: $4,374 (reported on 15.8% of returns)
Here:
$4,374
State:
$4,261
(% of AGI for various income ranges: 5.4% for AGIs below $10k, 1.1% for AGIs $10k-25k, 0.9% for AGIs $25k-50k, 1.1% for AGIs $50k-75k, 1.5% for AGIs $75k-100k, 5.2% for AGIs over 100k)
Net capital gain/loss: +$7,078 (reported on 14.4% of returns)
Here:
+$7,078
State:
+$16,110
(% of AGI for various income ranges: -1.4% for AGIs below $10k, 0.5% for AGIs $10k-25k, 0.5% for AGIs $25k-50k, 0.9% for AGIs $50k-75k, 2.1% for AGIs $75k-100k, 11.0% for AGIs over 100k)
Profit/loss from business: +$7,884 (reported on 19.1% of returns)
Here:
+$7,884
State:
+$11,013
(% of AGI for various income ranges: 4.2% for AGIs below $10k, 7.0% for AGIs $10k-25k, 3.0% for AGIs $25k-50k, 2.2% for AGIs $50k-75k, 3.1% for AGIs $75k-100k, 7.8% for AGIs over 100k)
IRA payment deduction: $3,201 (reported on 1.8% of returns)
77351:
$3,201
Texas:
$3,120
(% of AGI for various income ranges: 0.3% for AGIs below $10k, 0.2% for AGIs $10k-25k, 0.2% for AGIs $25k-50k, 0.2% for AGIs $50k-75k, 0.2% for AGIs $75k-100k, 0.2% for AGIs over 100k)
Self-employed pension: $16,774 (reported on 0.3% of returns)
Here:
$16,774
Texas:
$16,401
Total itemized deductions: $17,708 (26% of AGI, reported on 16.2% of returns)
Here:
$17,708
State:
$19,631
Here:
26.3% of AGI
State:
18.9% of AGI
(% of AGI for various income ranges: 15.0% for AGIs below $10k, 6.2% for AGIs $10k-25k, 7.7% for AGIs $25k-50k, 8.9% for AGIs $50k-75k, 10.3% for AGIs $75k-100k, 10.4% for AGIs over 100k)
Charity contributions deductions: $4,771 (7% of AGI, reported on 11.9% of returns)
Here:
$4,771
State:
$4,753
Here:
6.6% of AGI
State:
4.2% of AGI
(% of AGI for various income ranges: 0.9% for AGIs below $10k, 0.9% for AGIs $10k-25k, 1.1% for AGIs $25k-50k, 1.7% for AGIs $50k-75k, 2.0% for AGIs $75k-100k, 3.1% for AGIs over 100k)
Total tax: $4,753 (reported on 65.2% of returns)
77351:
$4,753
State:
$9,058
(% of AGI for various income ranges: 7.4% for AGIs below $10k, 3.3% for AGIs $10k-25k, 6.0% for AGIs $25k-50k, 8.8% for AGIs $50k-75k, 11.1% for AGIs $75k-100k, 17.8% for AGIs over 100k)
Earned income credit: $1,984 (reported on 27.5% of returns)
Here:
$1,984
State:
$2,024
Percentage of individuals using paid preparers for their 2004 taxes: 65.1%
Here:
65%
State:
57%
(% for various income ranges: 60.8% for AGIs below $10k, 68.2% for AGIs $10k-25k, 64.9% for AGIs $25k-50k, 63.5% for AGIs $50k-75k, 66.4% for AGIs $75k-100k, 70.2% for AGIs over 100k)
Household received Food Stamps/SNAP in the past 12 months: 2,248 Household did not receive Food Stamps/SNAP in the past 12 months: 11,001
Women who had a birth in the past 12 months: 459 (265 now married, 190 unmarried) Women who did not have a birth in the past 12 months: 5,429 (2,498 now married, 2,928 unmarried)
Housing units in zip code 77351 with a mortgage: 4,146 (54 second mortgage, 30 both second mortgage and home equity loan) Median monthly owner costs for units with a mortgage: $1,329 Median monthly owner costs for units without a mortgage: $479
Residents with income below the poverty level in 2022:
This zip code:
16.1%
Whole state:
14.0%
Residents with income below 50% of the poverty level in 2022:
This zip code:
7.0%
Whole state:
7.4%
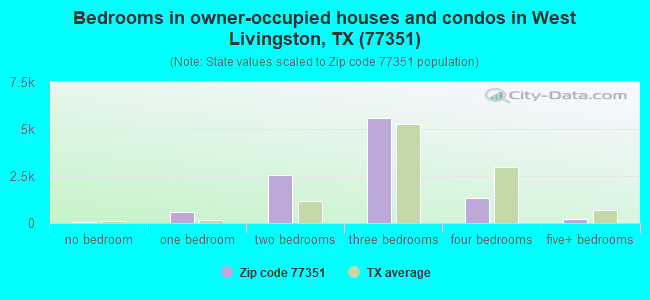
Median number of rooms in houses and condos:
Here:
5.2
State:
6.3
Median number of rooms in apartments:
Here:
4.2
State:
4.0
Notable locations in this zip code not listed on our city pages
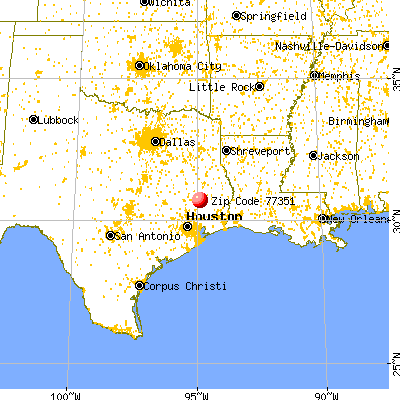
Notable locations in zip code 77351: Indian Village (A), Liberty Hill Lookout (B), Livingston Lookout (C), Livingston Pumping Station (D), Camp Seale (E), Camp Cho-Yeh (F), Camp Cho Yen (G), Camp Ruby (H), Polk County Courthouse (I), Polk County Museum (J), Alabama-Coushatta Indian Reservation Museum (K), Livingston Volunteer Fire Department Station 1 (L), Indian Springs Volunteer Fire Department (M), Alabama - Coushatta Indian Nation Fire Department (N), Livingston Volunteer Fire Department Station 2 (O), Livingston Volunteer Fire Department Station 3 (P), Scenic Loop Volunteer Fire Department (Q), South Polk County Volunteer Fire Department (R), Texas Forest Service Livingston Office (S). Display/hide their locations on the map
Churches in zip code 77351 include: Beech Creek Church (A), Bold Springs Church (B), Center Grove Church (C), Colita Church (D), Sunflower Church (E), Crossroads Church (F), East Tempe Church (G), Hortense Church (H), Garner Chapel (I). Display/hide their locations on the map
Cemeteries: Parrish Cemetery (1), Davis Cemetery (2), Robinett Cemetery (3), Rice Cemetery (4), Midway Cemetery (5), Kibble Cemetery (6), Oaks Cemetery (7). Display/hide their locations on the map
Lakes and reservoirs: Munson Lake (A), Laurent Lake (B), Brushy Lake (C), George Taylor Lake (D), Mooney Lake (E), Fish Scale Lake (F), Double A Lakes (G), Lake Tomahawk Number 2 (H). Display/hide their locations on the map
Streams, rivers, and creeks: Bridge Creek (A), Bluff Creek (B), Blue Branch (C), Beech Creek (D), Barnett Creek (E), Ace Emanuel Branch (F), Black Branch (G), Alexander Creek (H), Yellow Branch (I). Display/hide their locations on the map
3,682 married couples with children.
1,689 single-parent households (357 men, 1,332 women).
87.3% of residents of 77351 zip code speak English at home.
10.8% of residents speak Spanish at home (71% very well, 14% well, 12% not well, 3% not at all).
0.4% of residents speak other Indo-European language at home (79% very well, 21% well).
0.7% of residents speak Asian or Pacific Island language at home (54% very well, 29% well, 17% not well).
0.9% of residents speak other language at home (87% very well, 11% well, 1% not well).
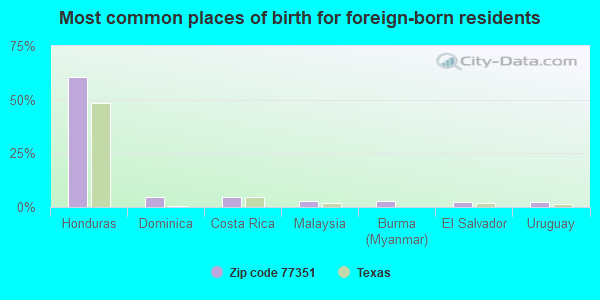
Foreign born population: 1,737 (4.9%) (57.4% of them are naturalized citizens)
This zip code:
4.9%
Whole state:
17.2%
61%Honduras
5%Dominica
5%Costa Rica
3%Malaysia
3%Burma (Myanmar)
2%El Salvador
2%Uruguay
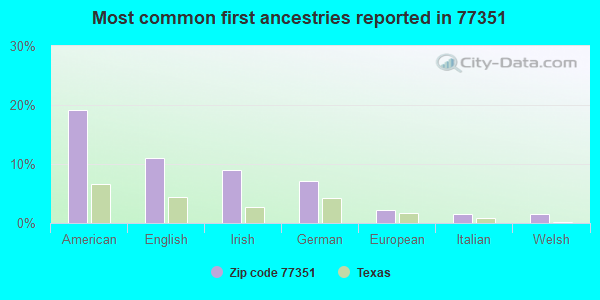
19%American
11%English
9%Irish
7%German
2%European
2%Italian
1%Welsh
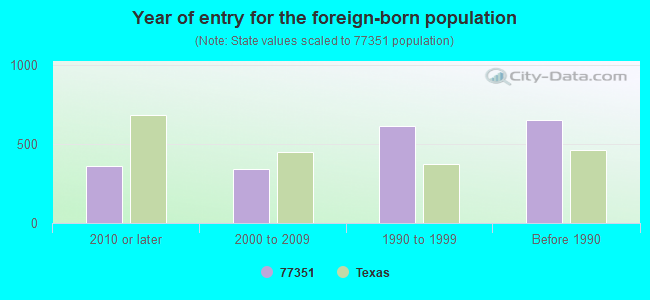
Year of entry for the foreign-born population
3582010 or later
3432000 to 2009
6131990 to 1999
654Before 1990
Facilities with environmental interests located in this zip code:
ALABAMA-COUSHATTA TRIBE OF TX (INDIAN RESERVATION LIVINGSTON in LIVINGSTON, TX)
National Pollutant Discharge Elimination System NON-MAJOR (Tracking pollutant discharge elimination systems) - permit Business SIC classification: SEWERAGE SYSTEMS Alternative names: ALABAMA-COUSHAITA INDIAN RESER, ALABAMA-COUSHATTA INDIAN RESER, INDIAN LAND-ALABAMA COUSHATTA
AC ONE STOP (US 190 & FM 2500 in LIVINGSTON, TX) . Tribal Land
ENFORCEMENT/COMPLIANCE ACTIVITY (Integrated Compliance Information System)
Housing units lacking complete plumbing facilities: 4.8% Housing units lacking complete kitchen facilities: 4.5%
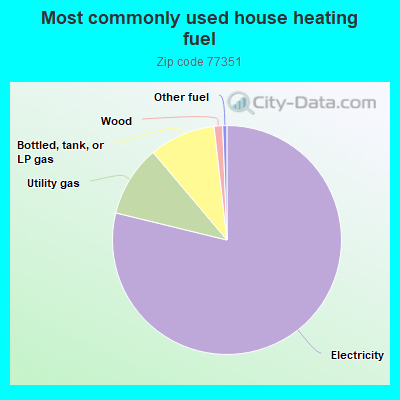
78.5%Electricity
10.0%Utility gas
9.3%Bottled, tank, or LP gas
1.2%Wood
0.6%Other fuel
Population in 1990: 24,261. Population change in the 1990s: +5,254 (+21.7%).
Place of birth for U.S.-born residents:
This state: 25,369
Northeast: 981
Midwest: 1,974
South: 3,275
West: 1,810
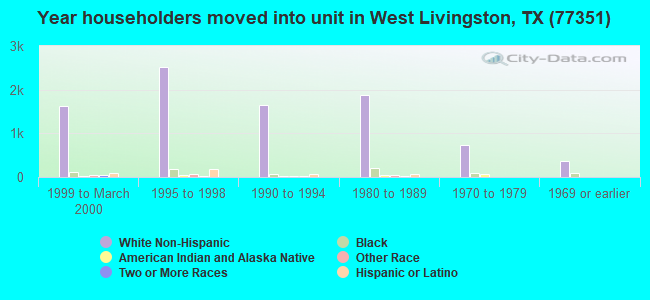
52% of the 77351 zip code residents lived in the same house 5 years ago. Out of people who lived in different houses, 37% lived in this county. Out of people who lived in different counties, 50% lived in Texas.
85% of the 77351 zip code residents lived in the same house 1 year ago. Out of people who lived in different houses, 30% moved from this county. Out of people who lived in different houses, 62% moved from different county within same state. Out of people who lived in different houses, 9% moved from different state. Out of people who lived in different houses, 0% moved from abroad.
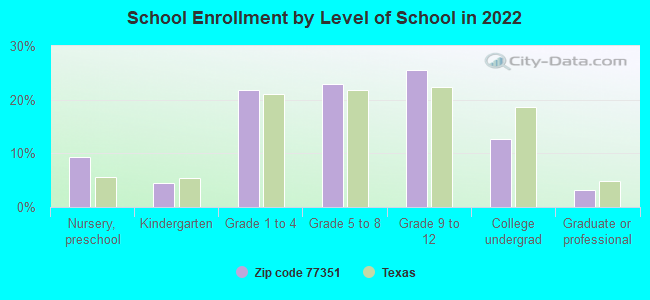
Private vs. public school enrollment:
Students in private schools in grades 1 to 8 (elementary and middle school): 524
Here:
20.2%
Texas:
8.8%
Students in private schools in grades 9 to 12 (high school): 275
Here:
18.8%
Texas:
8.0%
Students in private undergraduate colleges: 106
Here:
14.7%
Texas:
16.2%
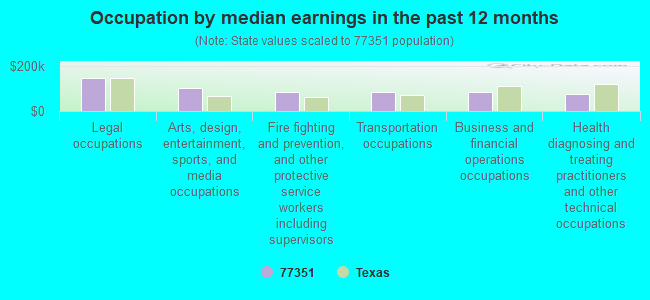
Occupation by median earnings in the past 12 months ($)
145,909Legal occupations
103,524Arts, design, entertainment, sports, and media occupations
85,005Fire fighting and prevention, and other protective service workers including supervisors
83,109Transportation occupations
82,001Business and financial operations occupations
76,787Health diagnosing and treating practitioners and other technical occupations
Companies with federal contracts located in this zip code (LIVINGSTON, TX):
TOLLS RONALD MD (MEMORIAL MEDICAL CENTER ST; small business) : $671,539 in 5 contractsfrom 2004 to 2006
Contracts for Surgery Services by Army Signed by year:2000: $0; 2001: $0; 2002: $0; 2003: $0; 2004: $144,000; 2005: $316,039; 2006: $211,500.
Biggest contracts:
$211,500 with Army for Surgery Services. Signed on 2006-01-31. Completion date: 2005-09-30.
$172,556, same as above.Signed on 2005-09-13. Completion date: 2005-09-30.
$148,725, same as above.Signed on 2005-10-06. Completion date: 2005-09-30.
$144,000, same as above.Signed on 2004-11-04. Completion date: 2005-09-30.
L & W LAFOUR & SONS CONSTRUCTI (FM 2457; small business) 6 employees, $370000 revenue.
$45,000 with Forest Service for Maintenance, Repair or Alteration of Real Property -- Dams. Signed on 2003-09-15. Completion date: 2004-01-15.
ANTHONY, PAUL B (955 TRIPPLE CREEK LOOP; small business) : $20,025 in 5 contractsfrom 2005 to 2006
Contracts for Recreation Site Maintenance Services (non-construction) by Army, U.S. Army Corps of Engineers - civil program financing only Signed by year:2000: $0; 2001: $0; 2002: $0; 2003: $0; 2004: $0; 2005: $15,150; 2006: $4,875.
Biggest contracts:
$4,875 with Army for Recreation Site Maintenance Services (non-construction). Signed on 2006-04-13. Completion date: 2006-09-01.
$4,875, same as above.Signed on 2005-04-18. Completion date: 2005-09-05.
$4,875 with U.S. Army Corps of Engineers - civil program financing only for Recreation Site Maintenance Services (non-construction). Signed on 2005-04-18. Completion date: 2005-09-05.
$2,700 with Army for Recreation Site Maintenance Services (non-construction). Signed on 2005-05-16. Completion date: 2005-09-05.
HENDRIX, TITUS LYNN (313 LYNN HENDRIX RD; small business)
$18,900 with Army for Lease or Rental of Equipment -- Tractors. Signed on 2003-08-20. Completion date: 2003-11-14.
ALABAMA-COUSHATTA TRIBE OF TEX (HWY #190 (17 MILES EAST); small business) : $4,799 in 2 contractsin 2005
$4,015 with Indian Affairs (Assistant Secretary) for Forest/Range Fire Suppression/Presuppression Services. Signed on 2005-09-06. Completion date: 2005-12-30.
$784 with Army for Chaplain Services. Signed on 2005-11-22. Completion date: 2005-11-16.
Top industries in this zip code by the number of employees in 2005:
Health Care and Social Assistance: Nursing Care Facilities (100-249: 1, 50-99: 1)
Health Care and Social Assistance: General Medical and Surgical Hospitals (100-249: 1)
Utilities: Electric Power Distribution (100-249: 1)
Finance and Insurance: Commercial Banking (50-99: 2, 10-19: 1)
People in group quarters in 2010:
2,843 people in state prisons
954 people in federal detention centers
197 people in nursing facilities/skilled-nursing facilities
110 people in local jails and other municipal confinement facilities
69 people in emergency and transitional shelters (with sleeping facilities) for people experiencing homelessness
7 people in group homes intended for adults
People in group quarters in 2000:
2,889 people in state prisons
228 people in nursing homes
107 people in local jails and other confinement facilities (including police lockups)
63 people in other noninstitutional group quarters
Fatal accident statistics in 2014:
Fatal accident count: 5
Vehicles involved in fatal accidents: 5
Fatal accidents caused by drunken drivers: 1
Fatalities: 5
Persons involved in fatal accidents: 8
Pedestrians involved in fatal accidents: 1
Fatal accident statistics in 2013:
Fatal accident count: 8
Vehicles involved in fatal accidents: 14
Fatal accidents caused by drunken drivers: 4
Fatalities: 8
Persons involved in fatal accidents: 18
Pedestrians involved in fatal accidents: 0
2003 - 2018 National Fire Incident Reporting System (NFIRS) incidents
According to the data from the years 2003 - 2018 the average number of fires per year is 124. The highest number of fire incidents - 412 took place in 2011, and the least - 0 in 2004. The data has a growing trend.
When looking into fire subcategories, the most reports belonged to: Outside Fires (59.1%), and Structure Fires (20.1%).
Fire incident types reported to NFIRS in Zip Code 77351


 Nearest zip codes: 77350, 77335, 75934, 75960, 77326, 77368.


 According to the data from the years 2003 - 2018 the average number of fires per year is 124. The highest number of fire incidents - 412 took place in 2011, and the least - 0 in 2004. The data has a growing trend.
 When looking into fire subcategories, the most reports belonged to: Outside Fires (59.1%), and Structure Fires (20.1%).