Estimated zip code population in 2022: 17,696 Zip code population in 2010: 17,491 Zip code population in 2000: 15,964
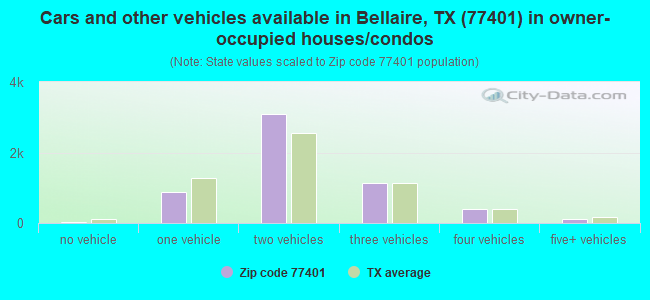
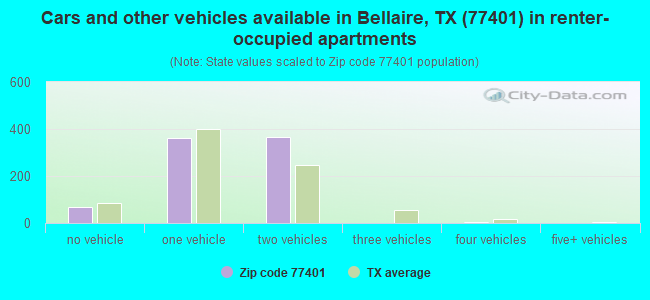
Houses and condos: 7,009 Renter-occupied apartments: 806
% of renters here:
12%
State:
38%
March 2022 cost of living index in zip code 77401: 101.9 (near average, U.S. average is 100)
Land area: 3.8 sq. mi. Water area: 0.0 sq. mi.
Population density: 4,717 people per square mile
(average).
OSM Map
General Map
Google Map
MSN Map
OSM Map
General Map
Google Map
MSN Map
OSM Map
General Map
Google Map
MSN Map
OSM Map
General Map
Google Map
MSN Map
Please wait while loading the map...
Real estate property taxes paid for housing units in 2022:
This zip code:
0.9% ($10,460)
Texas:
1.5% ($4,050)
Median real estate property taxes paid for housing units with mortgages in 2022: $10,505 (0.9%) Median real estate property taxes paid for housing units with no mortgage in 2022: $10,700 (1.0%)
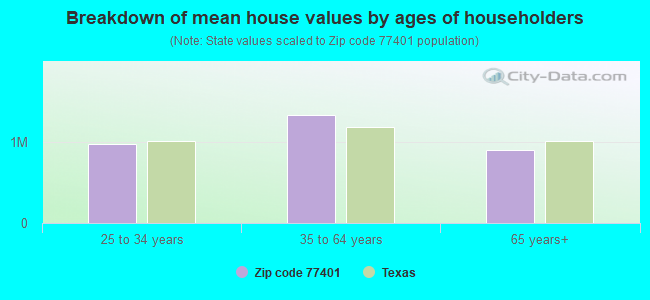
Estimated median house/condo value in 2022: $1,106,923
77401:
$1,106,923
Texas:
$275,400
According to our research of Texas and other state lists, there were 6 registered sex offenders living in 77401 zip code as of April 27, 2024. The ratio of all residents to sex offenders in zip code 77401 is 3,156 to 1. The ratio of registered sex offenders to all residents in this zip code is much lower than the state average.
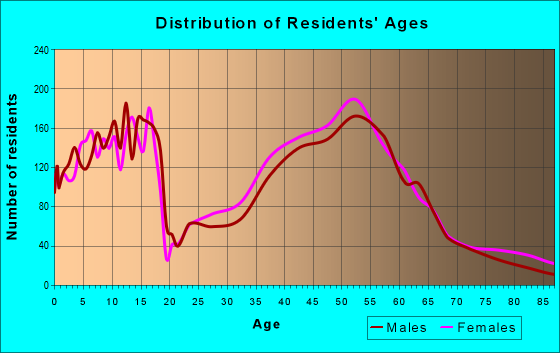
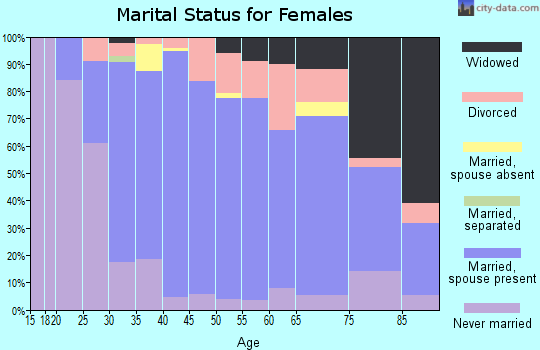
Median resident age:
This zip code:
44.8 years
Texas median age:
35.6 years
Average household size:
This zip code:
2.7 people
Texas:
2.6 people
Averages for the 2020 tax year for zip code 77401, filed in 2021:
Average Adjusted Gross Income (AGI) in 2020: $369,319 (Individual Income Tax Returns)
Here:
$369,319
State:
$77,054
Salary/wage: $254,021 (reported on 77.8% of returns)
Here:
$254,021
State:
$62,766
(% of AGI for various income ranges: 1172.4% for AGIs below $25k, 3978.2% for AGIs $25k-50k, 6844.7% for AGIs $50k-75k, 10340.0% for AGIs $75k-100k, 18811.7% for AGIs $100k-200k, 135765.6% for AGIs over 200k)
Taxable interest for individuals: $7,864 (reported on 65.1% of returns)
This zip code:
$7,864
Texas:
$2,665
(% of AGI for various income ranges: 51.6% for AGIs below $25k, 99.5% for AGIs $25k-50k, 115.6% for AGIs $50k-75k, 218.1% for AGIs $75k-100k, 597.2% for AGIs $100k-200k, 3477.9% for AGIs over 200k)
Ordinary dividends: $22,074 (reported on 64.3% of returns)
Here:
$22,074
State:
$10,044
(% of AGI for various income ranges: 160.0% for AGIs below $25k, 378.7% for AGIs $25k-50k, 506.2% for AGIs $50k-75k, 798.6% for AGIs $75k-100k, 2032.6% for AGIs $100k-200k, 9276.2% for AGIs over 200k)
Net capital gain/loss in AGI: +$89,174 (reported on 60.8% of returns)
Here:
+$89,174
State:
+$39,590
(% of AGI for various income ranges: 156.4% for AGIs below $25k, 363.6% for AGIs $25k-50k, 377.6% for AGIs $50k-75k, 776.2% for AGIs $75k-100k, 2071.3% for AGIs $100k-200k, 40337.7% for AGIs over 200k)
Profit/loss from business: +$45,954 (reported on 27.4% of returns)
Here:
+$45,954
State:
+$10,888
(% of AGI for various income ranges: 217.6% for AGIs below $25k, 317.4% for AGIs $25k-50k, 507.6% for AGIs $50k-75k, 841.0% for AGIs $75k-100k, 1860.2% for AGIs $100k-200k, 8081.5% for AGIs over 200k)
Taxable individual retirement arrangement distribution: $50,216 (reported on 13.9% of returns)
77401:
$50,216
Texas:
$24,740
(% of AGI for various income ranges: 112.3% for AGIs below $25k, 203.1% for AGIs $25k-50k, 696.5% for AGIs $50k-75k, 1140.0% for AGIs $75k-100k, 1805.7% for AGIs $100k-200k, 3785.0% for AGIs over 200k)
Self-employed (Keogh) retirement plans: $36,805 (reported on 5.4% of returns)
77401:
$36,805
Texas:
$29,298
(% of AGI for various income ranges: 235.2% for AGIs $100k-200k, 1410.2% for AGIs over 200k)
Total itemized deductions: $56,988 (reported on 34.3% of returns)
Here:
$56,988
State:
$40,428
(% of AGI for various income ranges: 220.0% for AGIs below $25k, 421.5% for AGIs $25k-50k, 690.0% for AGIs $50k-75k, 1256.7% for AGIs $75k-100k, 2610.2% for AGIs $100k-200k, 12896.5% for AGIs over 200k)
Charity contributions: $27,068 (reported on 30.0% of returns)
Here:
$27,068
State:
$18,201
(% of AGI for various income ranges: 6.4% for AGIs below $25k, 56.9% for AGIs $25k-50k, 98.8% for AGIs $50k-75k, 270.0% for AGIs $75k-100k, 644.1% for AGIs $100k-200k, 5823.1% for AGIs over 200k)
Taxes paid: $9,608 (reported on 33.8% of returns)
77401:
$9,608
State:
$7,821
(% of AGI for various income ranges: 35.4% for AGIs below $25k, 92.6% for AGIs $25k-50k, 175.6% for AGIs $50k-75k, 311.0% for AGIs $75k-100k, 593.9% for AGIs $100k-200k, 2001.3% for AGIs over 200k)
Earned income credit: $1,512 (reported on 3.2% of returns)
Here:
$1,512
State:
$2,584
(% of AGI for various income ranges: 30.4% for AGIs below $25k, 35.4% for AGIs $25k-50k)
Percentage of individuals using paid preparers for their 2020 taxes: 88.8%
Here:
89%
State:
92%
(% for various income ranges: 86.0% for AGIs below $25k, 88.9% for AGIs $25k-50k, 87.3% for AGIs $50k-75k, 85.4% for AGIs $75k-100k, 86.1% for AGIs $100k-200k, 91.7% for AGIs over 200k)
Averages for the 2012 tax year for zip code 77401, filed in 2013:
Average Adjusted Gross Income (AGI) in 2012: $289,914 (Individual Income Tax Returns)
Here:
$289,914
State:
$65,384
Salary/wage: $209,368 (reported on 79.8% of returns)
Here:
$209,368
State:
$52,524
(% of AGI for various income ranges: 62.3% for AGIs below $25k, 64.6% for AGIs $25k-50k, 64.6% for AGIs $50k-75k, 65.6% for AGIs $75k-100k, 71.2% for AGIs $100k-200k, 55.9% for AGIs over 200k)
Taxable interest for individuals: $4,803 (reported on 65.3% of returns)
This zip code:
$4,803
Texas:
$2,372
(% of AGI for various income ranges: 3.2% for AGIs below $25k, 1.7% for AGIs $25k-50k, 1.4% for AGIs $50k-75k, 1.2% for AGIs $75k-100k, 1.4% for AGIs $100k-200k, 1.0% for AGIs over 200k)
Ordinary dividends: $17,773 (reported on 58.4% of returns)
Here:
$17,773
State:
$9,721
(% of AGI for various income ranges: 10.0% for AGIs below $25k, 4.7% for AGIs $25k-50k, 4.0% for AGIs $50k-75k, 4.5% for AGIs $75k-100k, 3.4% for AGIs $100k-200k, 3.5% for AGIs over 200k)
Net capital gain/loss in AGI: +$60,410 (reported on 53.2% of returns)
Here:
+$60,410
State:
+$35,319
(% of AGI for various income ranges: 1.6% for AGIs below $25k, 1.5% for AGIs $25k-50k, 1.9% for AGIs $50k-75k, 3.2% for AGIs $75k-100k, 2.3% for AGIs $100k-200k, 12.5% for AGIs over 200k)
Profit/loss from business: +$60,305 (reported on 26.2% of returns)
Here:
+$60,305
State:
+$13,732
(% of AGI for various income ranges: 12.9% for AGIs below $25k, 9.2% for AGIs $25k-50k, 6.7% for AGIs $50k-75k, 6.7% for AGIs $75k-100k, 9.3% for AGIs $100k-200k, 4.9% for AGIs over 200k)
Taxable individual retirement arrangement distribution: $36,063 (reported on 13.3% of returns)
77401:
$36,063
Texas:
$19,511
(% of AGI for various income ranges: 4.5% for AGIs below $25k, 4.7% for AGIs $25k-50k, 5.7% for AGIs $50k-75k, 5.2% for AGIs $75k-100k, 4.1% for AGIs $100k-200k, 1.2% for AGIs over 200k)
Self-employment retirement plans: $32,717 (reported on 6.0% of returns)
77401:
$32,717
Texas:
$23,938
(% of AGI for various income ranges: 1.1% for AGIs $25k-50k, 0.9% for AGIs $100k-200k, 0.7% for AGIs over 200k)
Total itemized deductions: $43,749 (10% of AGI, reported on 57.8% of returns)
Here:
$43,749
State:
$24,724
Here:
9.5% of AGI
State:
15.9% of AGI
(% of AGI for various income ranges: 17.4% for AGIs below $25k, 14.6% for AGIs $25k-50k, 15.0% for AGIs $50k-75k, 14.9% for AGIs $75k-100k, 15.7% for AGIs $100k-200k, 7.7% for AGIs over 200k)
Charity contributions: $11,641 (reported on 51.9% of returns)
Here:
$11,641
State:
$6,808
(% of AGI for various income ranges: 0.8% for AGIs below $25k, 1.6% for AGIs $25k-50k, 1.5% for AGIs $50k-75k, 2.0% for AGIs $75k-100k, 2.4% for AGIs $100k-200k, 2.1% for AGIs over 200k)
Taxes paid: $16,279 (reported on 57.3% of returns)
77401:
$16,279
State:
$6,921
(% of AGI for various income ranges: 4.1% for AGIs below $25k, 4.5% for AGIs $25k-50k, 5.1% for AGIs $50k-75k, 5.5% for AGIs $75k-100k, 6.1% for AGIs $100k-200k, 2.8% for AGIs over 200k)
Earned income credit: $1,387 (reported on 3.8% of returns)
Here:
$1,387
State:
$2,570
(% of AGI for various income ranges: 2.1% for AGIs below $25k, 0.3% for AGIs $25k-50k)
Percentage of individuals using paid preparers for their 2012 taxes: 56.2%
Here:
56%
State:
51%
(% for various income ranges: 46.2% for AGIs below $25k, 46.9% for AGIs $25k-50k, 46.9% for AGIs $50k-75k, 51.0% for AGIs $75k-100k, 53.9% for AGIs $100k-200k, 69.1% for AGIs over 200k)
Averages for the 2004 tax year for zip code 77401, filed in 2005:
Average Adjusted Gross Income (AGI) in 2004: $150,641 (Individual Income Tax Returns)
Here:
$150,641
State:
$47,881
Salary/wage: $134,607 (reported on 76.3% of returns)
Here:
$134,607
State:
$41,947
(% of AGI for various income ranges: 944.4% for AGIs below $10k, 60.0% for AGIs $10k-25k, 70.6% for AGIs $25k-50k, 68.3% for AGIs $50k-75k, 74.8% for AGIs $75k-100k, 67.4% for AGIs over 100k)
Taxable interest for individuals: $3,661 (reported on 70.9% of returns)
This zip code:
$3,661
Texas:
$2,255
(% of AGI for various income ranges: 188.6% for AGIs below $10k, 6.7% for AGIs $10k-25k, 3.6% for AGIs $25k-50k, 3.5% for AGIs $50k-75k, 2.3% for AGIs $75k-100k, 1.4% for AGIs over 100k)
Taxable dividends: $7,255 (reported on 59.6% of returns)
Here:
$7,255
State:
$4,261
(% of AGI for various income ranges: 172.7% for AGIs below $10k, 5.5% for AGIs $10k-25k, 3.3% for AGIs $25k-50k, 3.6% for AGIs $50k-75k, 2.6% for AGIs $75k-100k, 2.7% for AGIs over 100k)
Net capital gain/loss: +$15,537 (reported on 53.8% of returns)
Here:
+$15,537
State:
+$16,110
(% of AGI for various income ranges: -26.9% for AGIs below $10k, 3.7% for AGIs $10k-25k, 0.7% for AGIs $25k-50k, 1.5% for AGIs $50k-75k, 1.4% for AGIs $75k-100k, 6.1% for AGIs over 100k)
Profit/loss from business: +$41,666 (reported on 24.8% of returns)
Here:
+$41,666
State:
+$11,013
(% of AGI for various income ranges: 16.7% for AGIs below $10k, 9.4% for AGIs $10k-25k, 6.8% for AGIs $25k-50k, 6.9% for AGIs $50k-75k, 7.7% for AGIs $75k-100k, 6.8% for AGIs over 100k)
IRA payment deduction: $3,899 (reported on 4.1% of returns)
77401:
$3,899
Texas:
$3,120
(% of AGI for various income ranges: 0.7% for AGIs $10k-25k, 0.4% for AGIs $25k-50k, 0.3% for AGIs $50k-75k, 0.3% for AGIs $75k-100k, 0.1% for AGIs over 100k)
Self-employed pension: $22,385 (reported on 5.9% of returns)
Here:
$22,385
Texas:
$16,401
(% of AGI for various income ranges: 0.4% for AGIs $25k-50k, 0.3% for AGIs $50k-75k, 0.7% for AGIs $75k-100k, 0.9% for AGIs over 100k)
Total itemized deductions: $30,792 (13% of AGI, reported on 53.3% of returns)
Here:
$30,792
State:
$19,631
Here:
13.1% of AGI
State:
18.9% of AGI
(% of AGI for various income ranges: 205.4% for AGIs below $10k, 19.5% for AGIs $10k-25k, 15.8% for AGIs $25k-50k, 17.9% for AGIs $50k-75k, 17.0% for AGIs $75k-100k, 9.9% for AGIs over 100k)
Charity contributions deductions: $6,899 (3% of AGI, reported on 48.3% of returns)
Here:
$6,899
State:
$4,753
Here:
2.8% of AGI
State:
4.2% of AGI
(% of AGI for various income ranges: 6.6% for AGIs below $10k, 1.9% for AGIs $10k-25k, 1.7% for AGIs $25k-50k, 2.2% for AGIs $50k-75k, 2.3% for AGIs $75k-100k, 2.2% for AGIs over 100k)
Total tax: $40,693 (reported on 83.2% of returns)
77401:
$40,693
State:
$9,058
(% of AGI for various income ranges: 42.8% for AGIs below $10k, 5.3% for AGIs $10k-25k, 8.8% for AGIs $25k-50k, 11.1% for AGIs $50k-75k, 12.3% for AGIs $75k-100k, 24.2% for AGIs over 100k)
Earned income credit: $1,076 (reported on 2.9% of returns)
Here:
$1,076
State:
$2,024
Percentage of individuals using paid preparers for their 2004 taxes: 55.2%
Here:
55%
State:
57%
(% for various income ranges: 53.9% for AGIs below $10k, 47.6% for AGIs $10k-25k, 47.1% for AGIs $25k-50k, 52.2% for AGIs $50k-75k, 51.5% for AGIs $75k-100k, 61.8% for AGIs over 100k)
Likely homosexual households (counted as self-reported same-sex unmarried-partner households)
Lesbian couples: 0.0% of all households
Gay men: 0.6% of all households
Household received Food Stamps/SNAP in the past 12 months: 97 Household did not receive Food Stamps/SNAP in the past 12 months: 6,324
Women who had a birth in the past 12 months: 44 (45 now married, 0 unmarried) Women who did not have a birth in the past 12 months: 3,497 (2,075 now married, 1,404 unmarried)
Housing units in zip code 77401 with a mortgage: 2,985 (389 second mortgage, 363 both second mortgage and home equity loan) Houses without a mortgage: 49
Median monthly owner costs for units with a mortgage: $3,982 Median monthly owner costs for units without a mortgage: $1,537
Residents with income below the poverty level in 2022:
This zip code:
2.2%
Whole state:
14.0%
Residents with income below 50% of the poverty level in 2022:
This zip code:
0.7%
Whole state:
7.4%
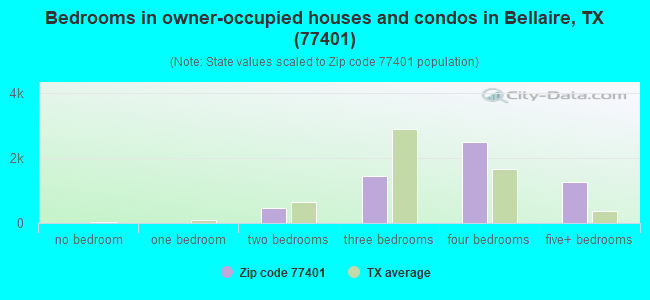
Median number of rooms in houses and condos:
Here:
8.3
State:
6.3
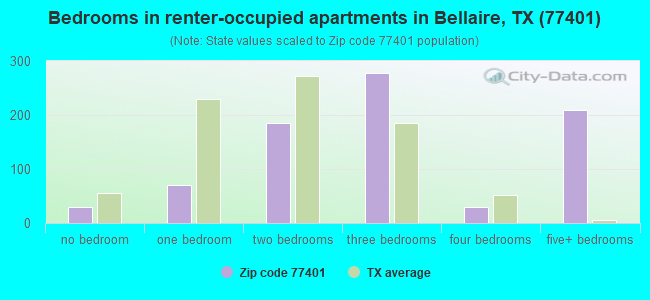
Median number of rooms in apartments:
Here:
6.1
State:
4.0
Notable locations in this zip code not listed on our city pages
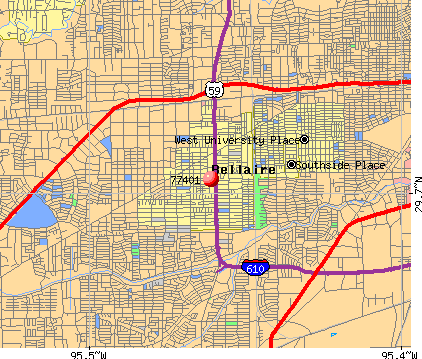
Notable locations in zip code 77401: Bellaire Fire Department (A), Bellaire City Hall (B), Bellaire Municipal Court Clerk's Office (C), Bellaire Chamber of Commerce (D). Display/hide their locations on the map
Shopping Centers: Bellaire Triangle Shopping Center (1), Cedar Bellaire Shopping Center (2), El Camino Shopping Center (3), Meyerland Court Shopping Center (4). Display/hide their locations on the map
Churches in zip code 77401 include: Bellaire First Baptist Church (A), Bellaire Presbyterian Church (B), Bellaire United Methodist Church (C), Congregation Brith Shalom (D), Faith American Lutheran Church (E), Saint Mark Coptic Orthodox Church of Houston (F), Incarnate Word Convent (G), Bellaire Church of the Nazarene (H). Display/hide their locations on the map
Parks in zip code 77401 include: Lafayette Park (1), Russ Pitman Park (2), Field Park (3), Candace U Simmons Track and Field Complex (4), Episcopal High School Softball Field (5), George R Brown Field (6), Bellaire High School Football Field (7), Crum Field House (8), Bellaire High School Baseball Field (9). Display/hide their locations on the map
4,289 married couples with children.
189 single-parent households (56 men, 133 women).
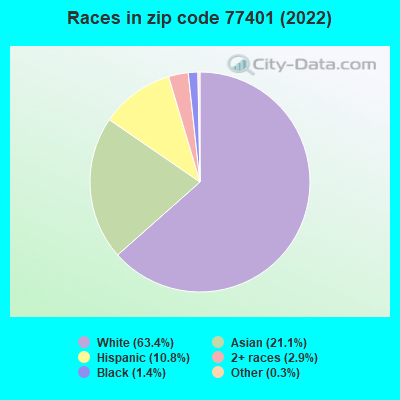
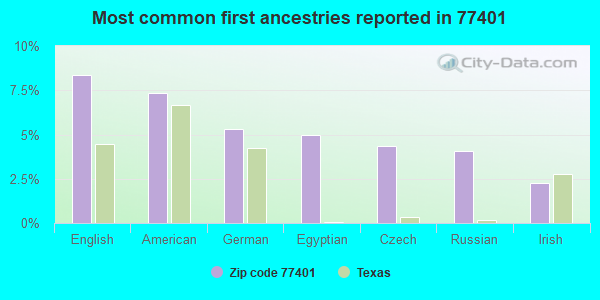
71.2% of residents of 77401 zip code speak English at home.
5.9% of residents speak Spanish at home (82% very well, 14% well, 4% not well).
6.6% of residents speak other Indo-European language at home (86% very well, 12% well, 2% not well).
12.6% of residents speak Asian or Pacific Island language at home (67% very well, 24% well, 7% not well, 1% not at all).
4.7% of residents speak other language at home (68% very well, 16% well, 1% not well, 15% not at all).
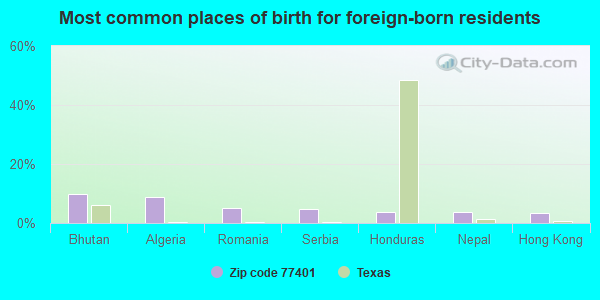
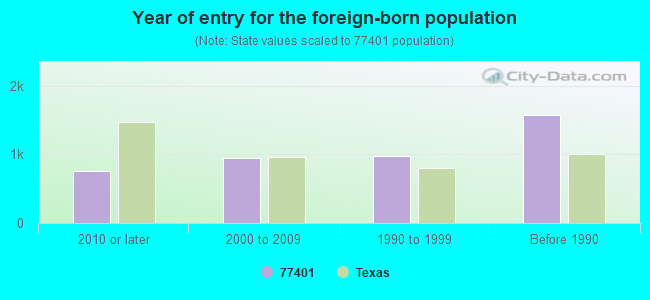
Foreign born population: 4,222 (23.9%) (78.2% of them are naturalized citizens)
Facilities with environmental interests located in this zip code:
$1.49 DRY CLEAN CITY (5118 BISSONNET in HOUSTON, TX)
AIR MINOR (AIRS/AFS) Business SIC classification: DRYCLEANING PLANTS, EXCEPT RUG CLEANING
A-1 DRY CLEANERS (4564 BISSONETT in BELLAIRE, TX)
Conditionally Exempt Small Quantity Generators, less than 100 kg/month of hazardous waste (Resource Conservation and Recovery Act (tracking hazardous waste)) - notification Organizations: DINESH D SHAH (CONTACT/OWNER)
Housing units lacking complete plumbing facilities: 0.5% Housing units lacking complete kitchen facilities: 1.2%
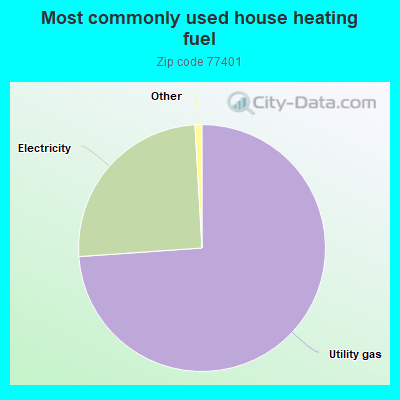
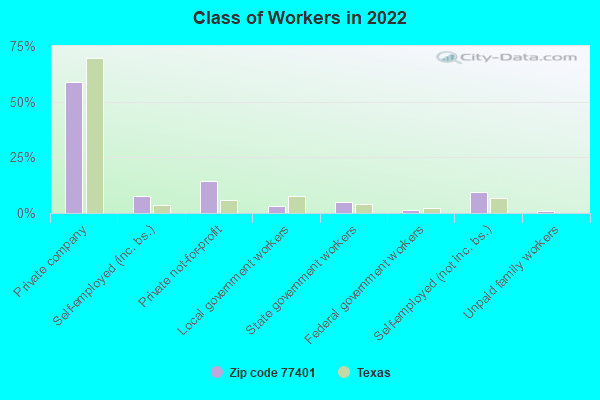
73.9%Utility gas
25.2%Electricity
Population in 1990: 13,913. Population change in the 1990s: +2,051 (+14.7%).
Place of birth for U.S.-born residents:
This state: 8,660
Northeast: 1,352
Midwest: 1,412
South: 1,136
West: 727
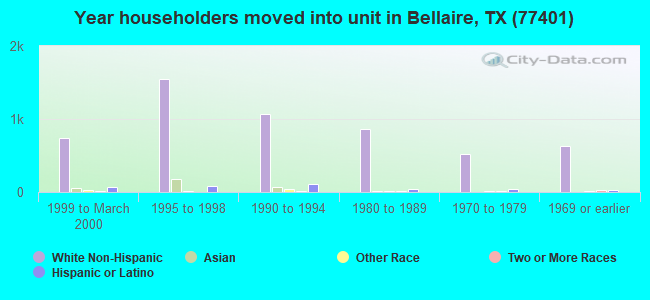
58% of the 77401 zip code residents lived in the same house 5 years ago. Out of people who lived in different houses, 71% lived in this county. Out of people who lived in different counties, 50% lived in Texas.
92% of the 77401 zip code residents lived in the same house 1 year ago. Out of people who lived in different houses, 62% moved from this county. Out of people who lived in different houses, 5% moved from different county within same state. Out of people who lived in different houses, 22% moved from different state. Out of people who lived in different houses, 13% moved from abroad.
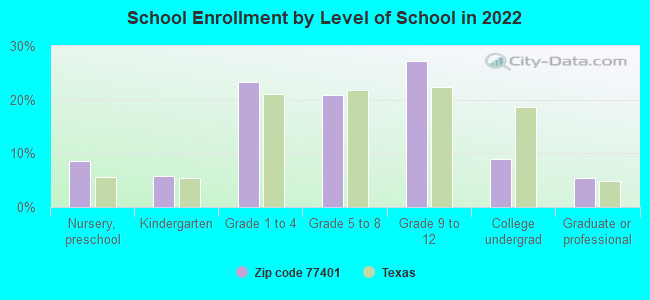
Private vs. public school enrollment:
Students in private schools in grades 1 to 8 (elementary and middle school): 840
Here:
38.1%
Texas:
8.8%
Students in private schools in grades 9 to 12 (high school): 687
Here:
50.2%
Texas:
8.0%
Students in private undergraduate colleges: 132
Here:
30.1%
Texas:
16.2%
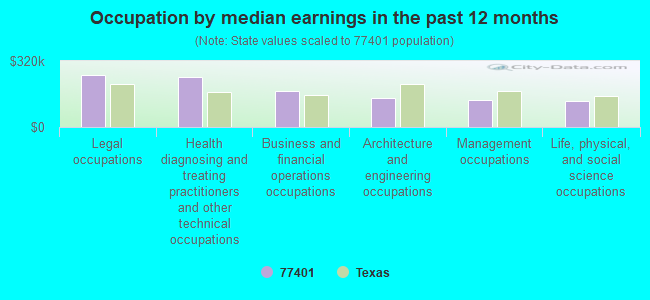
Occupation by median earnings in the past 12 months ($)
253,153Legal occupations
243,769Health diagnosing and treating practitioners and other technical occupations
175,390Business and financial operations occupations
139,151Architecture and engineering occupations
133,330Management occupations
125,757Life, physical, and social science occupations
Companies with federal contracts located in this zip code (BELLAIRE, TX):
VISIGEN BIOTECHNOLOGIES, INC (4435 JIM WEST ST; small business) : $3,322,559 in 4 contractsfrom 2001 to 2003
$1,533,923 with Navy for Other Research and Development -- Advanced Development (R&D). Signed on 2002-06-28. Completion date: 2003-09-14.
$1,306,435, same as above.Signed on 2003-06-30. Completion date: 2004-09-14.
$389,093, same as above.Signed on 2001-09-13. Completion date: 2002-09-12.
$93,108, same as above.Signed on 2001-09-28. Completion date: 2002-09-14.
E M A INSTRUMENTS, INC (4562 BISSONNET ST STE 202; small business) : $517,210 in 7 contractsfrom 1999 to 2005
Contracts for Pressure, Temperature, and Humidity Measuring and Controlling Instruments, Electrical and Electronic Properties Measuring and Testing Instruments by Air Force, Navy Signed by year:2000: $82,400; 2001: $0; 2002: $0; 2003: $0; 2004: $26,275; 2005: $81,085; 2006: $0.
Biggest contracts:
$327,450 with Air Force for Pressure, Temperature, and Humidity Measuring and Controlling Instruments. Signed on 1999-12-15. Completion date: 2000-11-30.
$82,400, same as above.Signed on 2000-08-30. Completion date: 2000-12-31.
$81,085, same as above.Signed on 2005-05-24. Completion date: 2005-08-31.
$67,800 with Navy for Electrical and Electronic Properties Measuring and Testing Instruments. Signed on 2000-05-23. Completion date: 2000-09-08.
SHAW ASSOCIATES, INC (5555 WEST LOOP SOUTH; small business)
$29,040 with Navy for Miscellaneous Electrical and Electronic Components. Signed on 2000-10-01. Completion date: 2000-05-31.
TEICHGRAEBER, SALLY (5200 WEST LOOP S STE 103A; small business) : $17,700 in 2 contractsin 2005
$13,275 with Army for Lease or Rental of Equipment -- Ground Effect Vehicles, Motor Vehicles, Trailers, and Cycles. Signed on 2005-03-30. Completion date: 2005-03-07.
$4,425, same as above.Signed on 2005-03-04. Completion date: 2005-03-07.
ENSERV (6575 W LOOP SOUTH, SUITE 1; small business) : $5,040 in 3 contractsin 2005
$5,040 with Navy for Waste Treatment and Storage. Taking place in MS. Signed on 2005-09-30. Completion date: 2006-09-30.
$4,620, same as above.Signed on 2005-12-15. Completion date: 2006-09-30.
-$4,620, same as above.Signed on 2005-10-28. Completion date: 2006-09-30.
GOMEZ, LYNNE (4521 BIRCH; small business) : $1,100 in 2 contractsin 2006
$3,350 with Bureau of Prisoners/Federal Prison System for . Signed on 2006-05-17. Completion date: 2006-06-23.
-$2,250, same as above.Signed on 2006-06-23. Completion date: 2006-06-23.
ACCESS SCIENCES CORPORATION (4710 BELLAIRE BLVD; small business)
-$650 with Army for Medical and Surgical Instruments, Equipment, and Supplies. Signed on 2005-05-07. Completion date: 2002-09-30.
Top industries in this zip code by the number of employees in 2005:
2002 - 2018 National Fire Incident Reporting System (NFIRS) incidents
According to the data from the years 2002 - 2018 the average number of fire incidents per year is 38. The highest number of reported fire incidents - 58 took place in 2011, and the least - 3 in 2002. The data has a growing trend.
When looking into fire subcategories, the most reports belonged to: Structure Fires (37.6%), and Mobile Property/Vehicle Fires (28.8%).
Fire incident types reported to NFIRS in Zip Code 77401
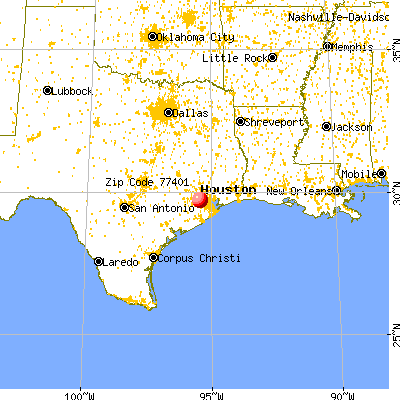


 Nearest zip codes: 77081, 77025, 77096, 77027, 77005, 77046.
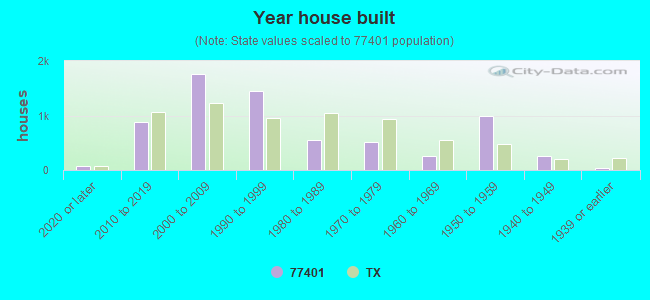


 According to the data from the years 2002 - 2018 the average number of fire incidents per year is 38. The highest number of reported fire incidents - 58 took place in 2011, and the least - 3 in 2002. The data has a growing trend.
 When looking into fire subcategories, the most reports belonged to: Structure Fires (37.6%), and Mobile Property/Vehicle Fires (28.8%).