Estimated zip code population in 2022: 67,995 Zip code population in 2010: 49,507 Zip code population in 2000: 37,976
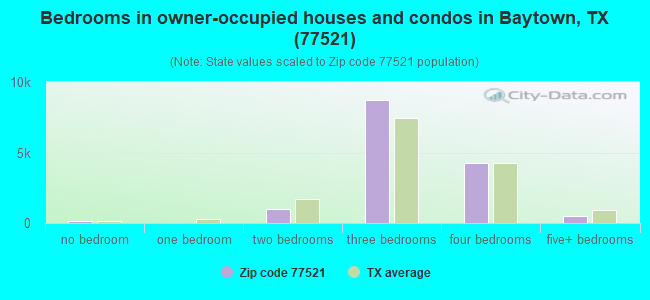
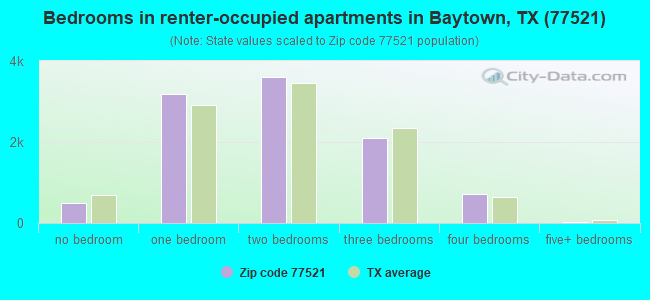
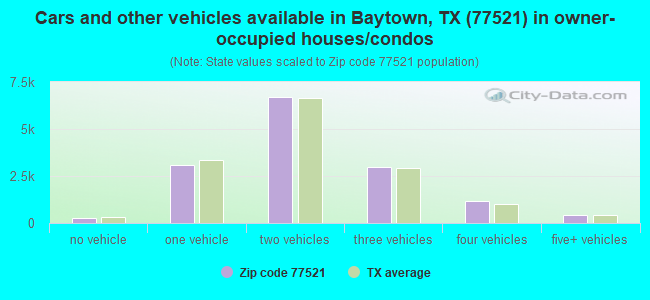
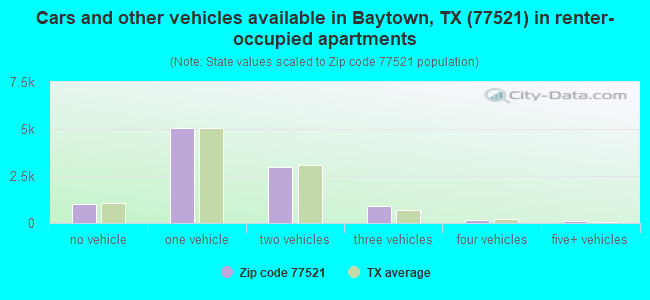
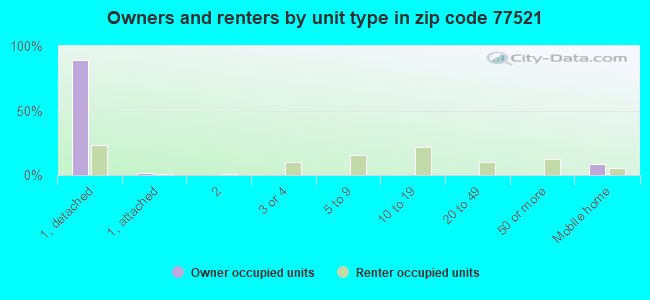
Houses and condos: 25,973 Renter-occupied apartments: 10,179
% of renters here:
41%
State:
38%
March 2022 cost of living index in zip code 77521: 95.9 (near average, U.S. average is 100)
Land area: 41.5 sq. mi. Water area: 0.4 sq. mi.
Population density: 1,638 people per square mile
(low).
OSM Map
General Map
Google Map
MSN Map
OSM Map
General Map
Google Map
MSN Map
OSM Map
General Map
Google Map
MSN Map
OSM Map
General Map
Google Map
MSN Map
Please wait while loading the map...
Real estate property taxes paid for housing units in 2022:
This zip code:
1.6% ($3,689)
Texas:
1.5% ($4,050)
Median real estate property taxes paid for housing units with mortgages in 2022: $3,981 (1.6%) Median real estate property taxes paid for housing units with no mortgage in 2022: $3,311 (1.6%)
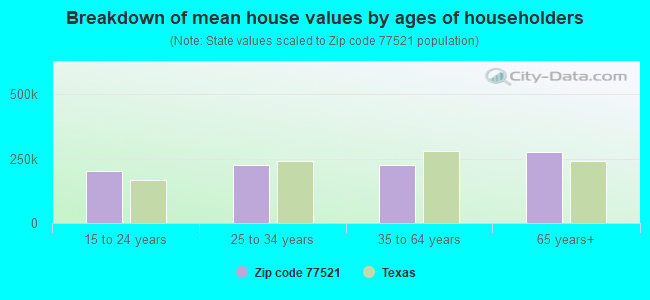
Estimated median house/condo value in 2022: $233,859
77521:
$233,859
Texas:
$275,400
According to our research of Texas and other state lists, there were 106 registered sex offenders living in 77521 zip code as of April 27, 2024. The ratio of all residents to sex offenders in zip code 77521 is 537 to 1. The ratio of registered sex offenders to all residents in this zip code is lower than the state average.
Median resident age:
This zip code:
33.4 years
Texas median age:
35.6 years
Average household size:
This zip code:
2.7 people
Texas:
2.6 people
Averages for the 2020 tax year for zip code 77521, filed in 2021:
Average Adjusted Gross Income (AGI) in 2020: $57,516 (Individual Income Tax Returns)
Here:
$57,516
State:
$77,054
Salary/wage: $52,054 (reported on 87.5% of returns)
Here:
$52,054
State:
$62,766
(% of AGI for various income ranges: 1209.3% for AGIs below $25k, 3527.0% for AGIs $25k-50k, 6424.6% for AGIs $50k-75k, 9235.8% for AGIs $75k-100k, 15893.3% for AGIs $100k-200k, 47294.4% for AGIs over 200k)
Taxable interest for individuals: $907 (reported on 18.0% of returns)
This zip code:
$907
Texas:
$2,665
(% of AGI for various income ranges: 5.1% for AGIs below $25k, 5.1% for AGIs $25k-50k, 12.5% for AGIs $50k-75k, 20.3% for AGIs $75k-100k, 58.5% for AGIs $100k-200k, 588.8% for AGIs over 200k)
Ordinary dividends: $9,043 (reported on 8.9% of returns)
Here:
$9,043
State:
$10,044
(% of AGI for various income ranges: 9.7% for AGIs below $25k, 21.7% for AGIs $25k-50k, 58.8% for AGIs $50k-75k, 103.4% for AGIs $75k-100k, 289.5% for AGIs $100k-200k, 3476.0% for AGIs over 200k)
Net capital gain/loss in AGI: +$8,825 (reported on 7.8% of returns)
Here:
+$8,825
State:
+$39,590
(% of AGI for various income ranges: 1.8% for AGIs below $25k, 10.0% for AGIs $25k-50k, 14.7% for AGIs $50k-75k, 49.8% for AGIs $75k-100k, 154.4% for AGIs $100k-200k, 5256.4% for AGIs over 200k)
Taxable individual retirement arrangement distribution: $32,867 (reported on 5.7% of returns)
77521:
$32,867
Texas:
$24,740
(% of AGI for various income ranges: 23.0% for AGIs below $25k, 59.2% for AGIs $25k-50k, 126.9% for AGIs $50k-75k, 326.7% for AGIs $75k-100k, 837.1% for AGIs $100k-200k, 5421.2% for AGIs over 200k)
Total itemized deductions: $35,703 (reported on 7.9% of returns)
Here:
$35,703
State:
$40,428
(% of AGI for various income ranges: 26.3% for AGIs below $25k, 177.0% for AGIs $25k-50k, 422.1% for AGIs $50k-75k, 669.9% for AGIs $75k-100k, 953.6% for AGIs $100k-200k, 4431.2% for AGIs over 200k)
Charity contributions: $12,599 (reported on 6.1% of returns)
Here:
$12,599
State:
$18,201
(% of AGI for various income ranges: 3.1% for AGIs below $25k, 32.9% for AGIs $25k-50k, 89.4% for AGIs $50k-75k, 147.5% for AGIs $75k-100k, 293.7% for AGIs $100k-200k, 2138.0% for AGIs over 200k)
Taxes paid: $7,595 (reported on 7.3% of returns)
77521:
$7,595
State:
$7,821
(% of AGI for various income ranges: 5.0% for AGIs below $25k, 30.7% for AGIs $25k-50k, 83.8% for AGIs $50k-75k, 144.5% for AGIs $75k-100k, 210.5% for AGIs $100k-200k, 642.0% for AGIs over 200k)
Earned income credit: $2,655 (reported on 21.9% of returns)
Here:
$2,655
State:
$2,584
(% of AGI for various income ranges: 138.4% for AGIs below $25k, 89.1% for AGIs $25k-50k, 1.9% for AGIs $50k-75k)
Percentage of individuals using paid preparers for their 2020 taxes: 92.5%
Here:
92%
State:
92%
(% for various income ranges: 92.6% for AGIs below $25k, 92.8% for AGIs $25k-50k, 92.7% for AGIs $50k-75k, 92.5% for AGIs $75k-100k, 91.8% for AGIs $100k-200k, 90.8% for AGIs over 200k)
Averages for the 2012 tax year for zip code 77521, filed in 2013:
Average Adjusted Gross Income (AGI) in 2012: $55,851 (Individual Income Tax Returns)
Here:
$55,851
State:
$65,384
Salary/wage: $50,352 (reported on 89.0% of returns)
Here:
$50,352
State:
$52,524
(% of AGI for various income ranges: 81.6% for AGIs below $25k, 87.8% for AGIs $25k-50k, 87.5% for AGIs $50k-75k, 85.6% for AGIs $75k-100k, 82.8% for AGIs $100k-200k, 50.3% for AGIs over 200k)
Taxable interest for individuals: $870 (reported on 24.1% of returns)
This zip code:
$870
Texas:
$2,372
(% of AGI for various income ranges: 0.5% for AGIs below $25k, 0.4% for AGIs $25k-50k, 0.3% for AGIs $50k-75k, 0.3% for AGIs $75k-100k, 0.3% for AGIs $100k-200k, 0.7% for AGIs over 200k)
Ordinary dividends: $7,472 (reported on 11.4% of returns)
Here:
$7,472
State:
$9,721
(% of AGI for various income ranges: 1.4% for AGIs below $25k, 0.8% for AGIs $25k-50k, 1.1% for AGIs $50k-75k, 1.3% for AGIs $75k-100k, 1.6% for AGIs $100k-200k, 2.9% for AGIs over 200k)
Net capital gain/loss in AGI: +$13,726 (reported on 7.9% of returns)
Here:
+$13,726
State:
+$35,319
(% of AGI for various income ranges: 0.4% for AGIs $25k-50k, 0.3% for AGIs $50k-75k, 0.5% for AGIs $75k-100k, 1.0% for AGIs $100k-200k, 10.4% for AGIs over 200k)
Profit/loss from business: +$7,551 (reported on 14.1% of returns)
Here:
+$7,551
State:
+$13,732
(% of AGI for various income ranges: 8.8% for AGIs below $25k, 1.1% for AGIs $25k-50k, 0.6% for AGIs $50k-75k, 1.1% for AGIs $75k-100k, 1.1% for AGIs $100k-200k, 3.0% for AGIs over 200k)
Taxable individual retirement arrangement distribution: $27,244 (reported on 7.4% of returns)
77521:
$27,244
Texas:
$19,511
(% of AGI for various income ranges: 1.8% for AGIs below $25k, 1.9% for AGIs $25k-50k, 2.3% for AGIs $50k-75k, 3.1% for AGIs $75k-100k, 4.6% for AGIs $100k-200k, 6.7% for AGIs over 200k)
Self-employment retirement plans: $24,225 (reported on 0.2% of returns)
77521:
$24,225
Texas:
$23,938
Total itemized deductions: $20,870 (21% of AGI, reported on 27.0% of returns)
Here:
$20,870
State:
$24,724
Here:
21.0% of AGI
State:
15.9% of AGI
(% of AGI for various income ranges: 4.7% for AGIs below $25k, 9.5% for AGIs $25k-50k, 12.3% for AGIs $50k-75k, 11.6% for AGIs $75k-100k, 10.1% for AGIs $100k-200k, 9.3% for AGIs over 200k)
Charity contributions: $5,166 (reported on 20.1% of returns)
Here:
$5,166
State:
$6,808
(% of AGI for various income ranges: 0.5% for AGIs below $25k, 1.2% for AGIs $25k-50k, 1.7% for AGIs $50k-75k, 1.9% for AGIs $75k-100k, 2.2% for AGIs $100k-200k, 2.8% for AGIs over 200k)
Taxes paid: $5,034 (reported on 26.2% of returns)
77521:
$5,034
State:
$6,921
(% of AGI for various income ranges: 0.9% for AGIs below $25k, 1.7% for AGIs $25k-50k, 2.5% for AGIs $50k-75k, 2.9% for AGIs $75k-100k, 2.8% for AGIs $100k-200k, 2.3% for AGIs over 200k)
Earned income credit: $2,568 (reported on 21.5% of returns)
Here:
$2,568
State:
$2,570
(% of AGI for various income ranges: 9.6% for AGIs below $25k, 1.3% for AGIs $25k-50k)
Percentage of individuals using paid preparers for their 2012 taxes: 51.0%
Here:
51%
State:
51%
(% for various income ranges: 46.9% for AGIs below $25k, 48.9% for AGIs $25k-50k, 55.5% for AGIs $50k-75k, 55.1% for AGIs $75k-100k, 54.7% for AGIs $100k-200k, 71.1% for AGIs over 200k)
Averages for the 2004 tax year for zip code 77521, filed in 2005:
Average Adjusted Gross Income (AGI) in 2004: $45,190 (Individual Income Tax Returns)
Here:
$45,190
State:
$47,881
Salary/wage: $41,475 (reported on 89.2% of returns)
Here:
$41,475
State:
$41,947
(% of AGI for various income ranges: 109.8% for AGIs below $10k, 84.5% for AGIs $10k-25k, 88.4% for AGIs $25k-50k, 85.7% for AGIs $50k-75k, 86.2% for AGIs $75k-100k, 70.0% for AGIs over 100k)
Taxable interest for individuals: $1,430 (reported on 32.7% of returns)
This zip code:
$1,430
Texas:
$2,255
(% of AGI for various income ranges: 2.6% for AGIs below $10k, 1.3% for AGIs $10k-25k, 0.9% for AGIs $25k-50k, 1.1% for AGIs $50k-75k, 0.8% for AGIs $75k-100k, 1.1% for AGIs over 100k)
Taxable dividends: $4,905 (reported on 17.2% of returns)
Here:
$4,905
State:
$4,261
(% of AGI for various income ranges: 2.5% for AGIs below $10k, 1.4% for AGIs $10k-25k, 1.1% for AGIs $25k-50k, 1.4% for AGIs $50k-75k, 1.9% for AGIs $75k-100k, 2.8% for AGIs over 100k)
Net capital gain/loss: +$5,942 (reported on 11.8% of returns)
Here:
+$5,942
State:
+$16,110
(% of AGI for various income ranges: -0.7% for AGIs below $10k, 0.1% for AGIs $10k-25k, 0.3% for AGIs $25k-50k, 0.4% for AGIs $50k-75k, 0.7% for AGIs $75k-100k, 4.1% for AGIs over 100k)
Profit/loss from business: +$6,531 (reported on 12.8% of returns)
Here:
+$6,531
State:
+$11,013
(% of AGI for various income ranges: 0.7% for AGIs below $10k, 4.3% for AGIs $10k-25k, 1.0% for AGIs $25k-50k, 0.8% for AGIs $50k-75k, 0.7% for AGIs $75k-100k, 3.1% for AGIs over 100k)
IRA payment deduction: $3,312 (reported on 1.3% of returns)
77521:
$3,312
Texas:
$3,120
(% of AGI for various income ranges: 0.1% for AGIs $10k-25k, 0.1% for AGIs $25k-50k, 0.1% for AGIs $50k-75k, 0.1% for AGIs $75k-100k, 0.1% for AGIs over 100k)
Self-employed pension: $16,000 (reported on 0.2% of returns)
Here:
$16,000
Texas:
$16,401
Total itemized deductions: $17,061 (22% of AGI, reported on 27.9% of returns)
Here:
$17,061
State:
$19,631
Here:
21.6% of AGI
State:
18.9% of AGI
(% of AGI for various income ranges: 10.9% for AGIs below $10k, 6.1% for AGIs $10k-25k, 10.9% for AGIs $25k-50k, 11.9% for AGIs $50k-75k, 11.6% for AGIs $75k-100k, 10.0% for AGIs over 100k)
Charity contributions deductions: $4,062 (5% of AGI, reported on 22.3% of returns)
Here:
$4,062
State:
$4,753
Here:
4.9% of AGI
State:
4.2% of AGI
(% of AGI for various income ranges: 0.5% for AGIs below $10k, 0.7% for AGIs $10k-25k, 1.5% for AGIs $25k-50k, 1.9% for AGIs $50k-75k, 2.3% for AGIs $75k-100k, 2.7% for AGIs over 100k)
Total tax: $6,736 (reported on 70.9% of returns)
77521:
$6,736
State:
$9,058
(% of AGI for various income ranges: 2.6% for AGIs below $10k, 3.3% for AGIs $10k-25k, 5.6% for AGIs $25k-50k, 8.7% for AGIs $50k-75k, 10.9% for AGIs $75k-100k, 17.4% for AGIs over 100k)
Earned income credit: $1,939 (reported on 20.6% of returns)
Here:
$1,939
State:
$2,024
Percentage of individuals using paid preparers for their 2004 taxes: 54.8%
Here:
55%
State:
57%
(% for various income ranges: 47.5% for AGIs below $10k, 59.3% for AGIs $10k-25k, 56.4% for AGIs $25k-50k, 55.6% for AGIs $50k-75k, 51.0% for AGIs $75k-100k, 55.6% for AGIs over 100k)
Likely homosexual households (counted as self-reported same-sex unmarried-partner households)
Lesbian couples: 0.2% of all households
Gay men: 0.0% of all households
Household received Food Stamps/SNAP in the past 12 months: 3,152 Household did not receive Food Stamps/SNAP in the past 12 months: 21,717
Women who had a birth in the past 12 months: 997 (674 now married, 322 unmarried) Women who did not have a birth in the past 12 months: 16,116 (7,295 now married, 8,814 unmarried)
Housing units in zip code 77521 with a mortgage: 8,098 (224 second mortgage, 26 home equity loan, 200 both second mortgage and home equity loan) Houses without a mortgage: 29
Median monthly owner costs for units with a mortgage: $1,771 Median monthly owner costs for units without a mortgage: $703
Residents with income below the poverty level in 2022:
This zip code:
14.0%
Whole state:
14.0%
Residents with income below 50% of the poverty level in 2022:
This zip code:
7.2%
Whole state:
7.4%
Median number of rooms in houses and condos:
Here:
6.2
State:
6.3
Median number of rooms in apartments:
Here:
4.0
State:
4.0
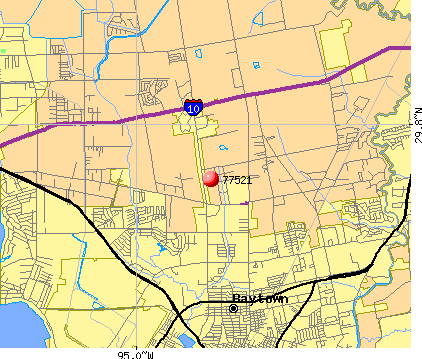
Notable locations in this zip code not listed on our city pages
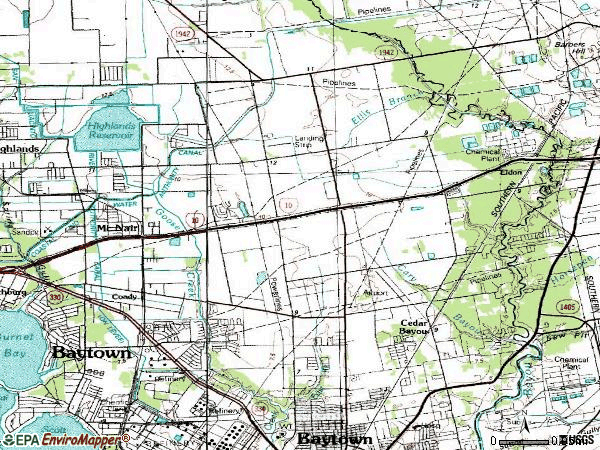
Notable locations in zip code 77521: Goose Creek Country Club (A), Baytown Fairgrounds (B), Baytown Youth Fair (C), Cedar Bayou (D), McNair Volunteer Fire Department (E), Baytown Fire and Rescue Services (F), Baytown Fire and Rescue Station 1 (G), Baytown Fire and Rescue Station 3 (H), Baytown Police Department (I), Baytown Chamber of Commerce (J), Harris County Courthouse (K). Display/hide their locations on the map
Shopping Centers: San Jacinto Shopping Center (1), Center Baytown Shopping Center (2), Goose Creek Shopping Center (3), West Town Center Shopping Center (4), Willow Creek Shopping Center (5). Display/hide their locations on the map
Churches in zip code 77521 include: Coady Baptist Church (A), First Baptist Church of Baytown (B), Shiloh Church (C), Bayou Church (D), Cedar Bayou Baptist Church (E), Memorial Assembly of God Church (F), Saint John Catholic Church (G), Templo Bethel (H), Gospel Lighthouse Church (I). Display/hide their locations on the map
Streams, rivers, and creeks: West Fork Goose Creek (A), East Fork Goose Creek (B), Ellis Branch (C), Horsepen Bayou (D), Cary Bayou (E). Display/hide their locations on the map
Parks in zip code 77521 include: League of Women Voters Park (1), McElroy Park (2), Baytown Sports Complex (3), Stallworth Stadium (4), Sterling High School Baseball Field (5). Display/hide their locations on the map
11,220 married couples with children.
6,298 single-parent households (1,929 men, 4,369 women).
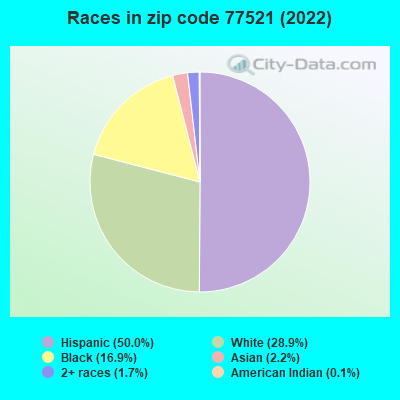
59.0% of residents of 77521 zip code speak English at home.
36.6% of residents speak Spanish at home (61% very well, 18% well, 12% not well, 9% not at all).
1.7% of residents speak other Indo-European language at home (77% very well, 21% well, 3% not at all).
1.8% of residents speak Asian or Pacific Island language at home (69% very well, 17% well, 9% not well, 4% not at all).
0.5% of residents speak other language at home (89% very well, 10% well, 1% not well).
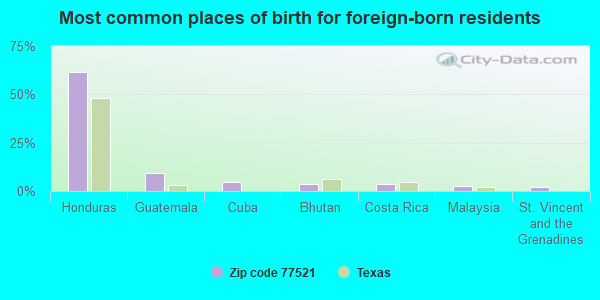
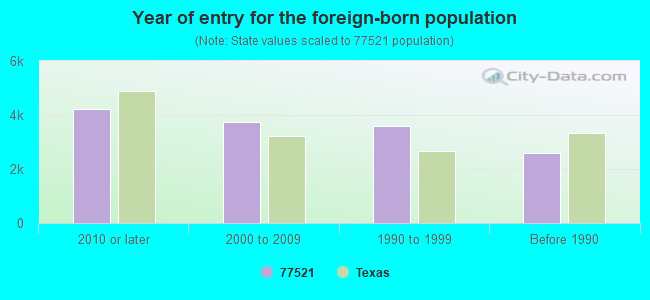
Foreign born population: 12,957 (19.1%) (40.8% of them are naturalized citizens)
Facilities with environmental interests located in this zip code:
ALAMO EL (4544 INTERSTATE 10 E in BAYTOWN, TX)
(National Center for Education Statistics) - STATE ID-101911101 Organizations: GOOSE CREEK CISD (SCHOOL DISTRICT)
ASHBEL SMITH EL (4544 INTERSTATE 10 E in BAYTOWN, TX)
(National Center for Education Statistics) - STATE ID-101911113 Organizations: GOOSE CREEK CISD (SCHOOL DISTRICT)
ARROWHEAD INC (6914 EAST FWY in BAYTOWN, TX)
Small Quantity Generators, between 100 kg and 1000 kg of hazardous waste/month (Resource Conservation and Recovery Act (tracking hazardous waste)) Organizations: ARROWHEAD MOBILE SERVICES INC (CONTACT/OPERATOR)
Alternative names: ARROWHEAD INC - BAYTOWN
Housing units lacking complete plumbing facilities: 1.4% Housing units lacking complete kitchen facilities: 2.2%
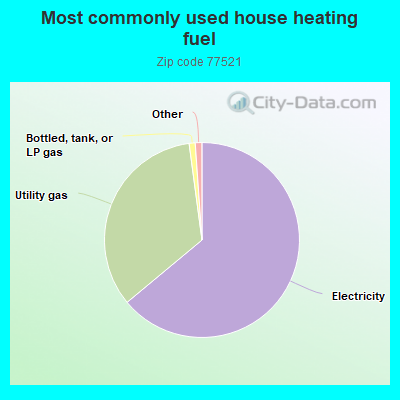
63.9%Electricity
33.9%Utility gas
1.0%Bottled, tank, or LP gas
Population in 1990: 30,277. Population change in the 1990s: +7,699 (+25.4%).
Place of birth for U.S.-born residents:
This state: 42,270
Northeast: 1,059
Midwest: 2,314
South: 4,841
West: 3,122
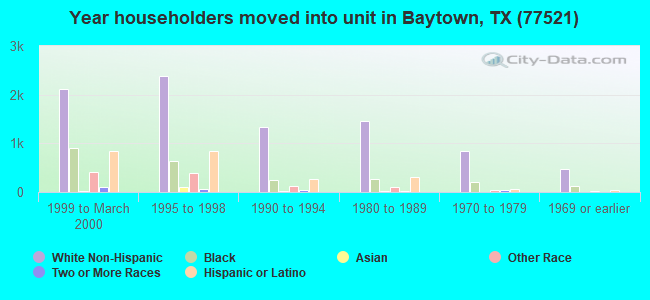
50% of the 77521 zip code residents lived in the same house 5 years ago. Out of people who lived in different houses, 71% lived in this county. Out of people who lived in different counties, 50% lived in Texas.
86% of the 77521 zip code residents lived in the same house 1 year ago. Out of people who lived in different houses, 59% moved from this county. Out of people who lived in different houses, 21% moved from different county within same state. Out of people who lived in different houses, 13% moved from different state. Out of people who lived in different houses, 5% moved from abroad.
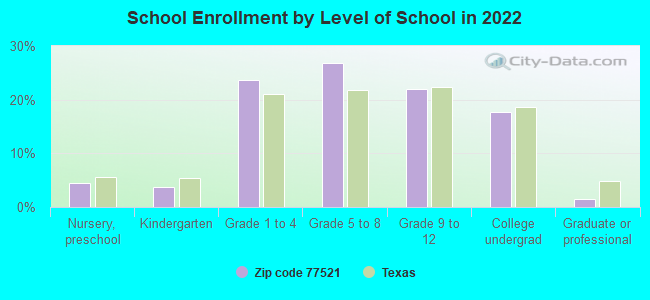
Private vs. public school enrollment:
Students in private schools in grades 1 to 8 (elementary and middle school): 697
Here:
7.7%
Texas:
8.8%
Students in private schools in grades 9 to 12 (high school): 269
Here:
6.8%
Texas:
8.0%
Students in private undergraduate colleges: 360
Here:
11.3%
Texas:
16.2%
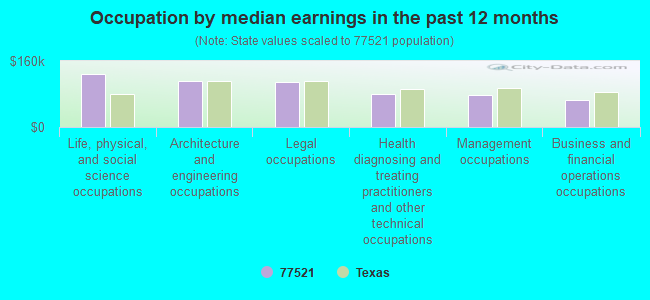
Occupation by median earnings in the past 12 months ($)
129,444Life, physical, and social science occupations
110,366Architecture and engineering occupations
109,515Legal occupations
79,807Health diagnosing and treating practitioners and other technical occupations
76,647Management occupations
66,569Business and financial operations occupations
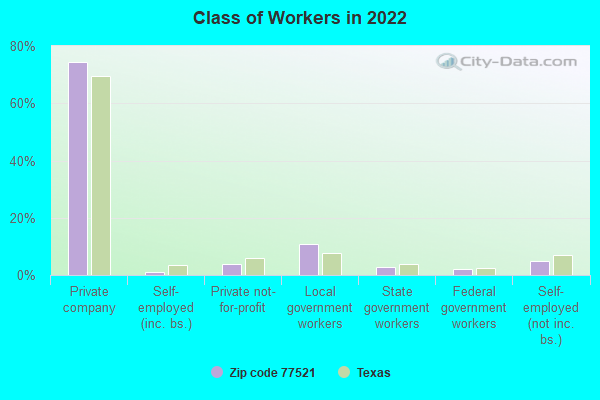
Companies with federal contracts located in this zip code:
CHEMICALS INCORPORATED (12321 HATCHERVILLE RD in BAYTOWN, TX) : $1,070,404 in 10 contractsfrom 2000 to 2006
Contracts for Liquid Propellant Fuels and Oxidizers, Chemical Base by Defense Logistics Agency, Air Force Signed by year:2000: $43,824; 2001: $215,625; 2002: $246,531; 2003: $0; 2004: $87,873; 2005: $205,426; 2006: $271,125.
Biggest contracts:
$271,125 with Defense Logistics Agency for Liquid Propellant Fuels and Oxidizers, Chemical Base. Signed on 2006-04-24. Completion date: 2009-09-30.
$215,625, same as above.Signed on 2001-12-13. Completion date: 2004-09-28.
$149,500, same as above.Signed on 2002-05-10. Completion date: 2004-09-28.
$130,042, same as above.Signed on 2005-09-02. Completion date: 2009-09-30.
LINEAGE ALLOYS INC (1901 ELLIS SCHOOL RD in BAYTOWN, TX; small business) : $184,460 in 10 contractsfrom 2004 to 2006
Contracts for Miscellaneous Welding, Soldering, and Brazing Supplies and Accessories by Air Force, Defense Logistics Agency Signed by year:2000: $0; 2001: $0; 2002: $0; 2003: $0; 2004: $58,365; 2005: $67,567; 2006: $58,528.
Biggest contracts:
$54,783 with Air Force for Miscellaneous Welding, Soldering, and Brazing Supplies and Accessories. Signed on 2004-03-11. Completion date: 2004-03-22.
$29,820, same as above.Signed on 2006-02-10. Completion date: 2006-03-03.
$29,820, same as above.Signed on 2005-11-23. Completion date: 2005-12-30.
$15,264, same as above.Signed on 2006-02-02. Completion date: 2006-03-13.
RIGGING AND WELDING SPECIALIST (5800 WADE RD in BAYTOWN, TX; small business) : $129,000 in 4 contractsfrom 2000 to 2002
$60,000 with Air Force for Maintenance, Repair and Rebuilding of Equipment -- Miscellaneous. Signed on 2002-08-22. Completion date: 2002-09-30.
$37,000 with NASA for Construction of Structures and Facilities -- Testing and Measurement Buildings. Signed on 2000-07-15. Completion date: 2000-09-15.
$32,000 with Air Force for Maintenance, Repair and Rebuilding of Equipment -- Miscellaneous. Signed on 2002-07-17. Completion date: 2002-09-30.
$0, same as above.Signed on 2002-07-17. Completion date: 2002-09-30.
Top industries in this zip code by the number of employees in 2005:
Health Care and Social Assistance: General Medical and Surgical Hospitals (over 1000 employees: 1 establishment)
2002 - 2018 National Fire Incident Reporting System (NFIRS) incidents
According to the data from the years 2002 - 2018 the average number of fires per year is 94. The highest number of reported fire incidents - 182 took place in 2017, and the least - 12 in 2009. The data has a growing trend.
When looking into fire subcategories, the most reports belonged to: Outside Fires (43.1%), and Structure Fires (33.7%).
Fire incident types reported to NFIRS in Zip Code 77521

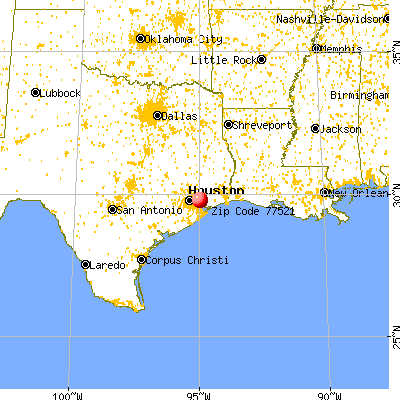


 Nearest zip codes: 77520, 77562, 77523, 77580, 77571, 77530.


 According to the data from the years 2002 - 2018 the average number of fires per year is 94. The highest number of reported fire incidents - 182 took place in 2017, and the least - 12 in 2009. The data has a growing trend.
 When looking into fire subcategories, the most reports belonged to: Outside Fires (43.1%), and Structure Fires (33.7%).