Estimated zip code population in 2022: 1,013 Zip code population in 2010: 934 Zip code population in 2000: 848
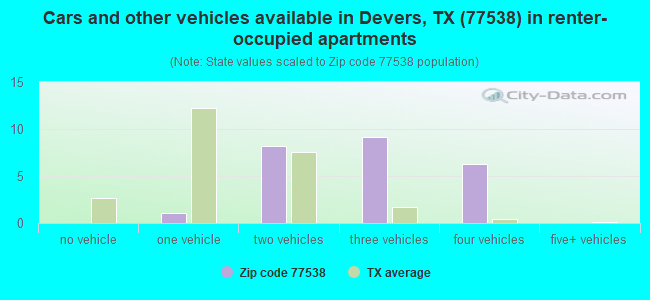
Houses and condos: 376 Renter-occupied apartments: 25
% of renters here:
8%
State:
38%
March 2022 cost of living index in zip code 77538: 83.9 (less than average, U.S. average is 100)
Land area: 145.6 sq. mi. Water area: 0.8 sq. mi.
Population density: 7 people per square mile
(very low).
OSM Map
General Map
Google Map
MSN Map
OSM Map
General Map
Google Map
MSN Map
OSM Map
General Map
Google Map
MSN Map
OSM Map
General Map
Google Map
MSN Map
Please wait while loading the map...
Real estate property taxes paid for housing units in 2022:
This zip code:
1.3% ($2,227)
Texas:
1.5% ($4,050)
Median real estate property taxes paid for housing units with mortgages in 2022: $3,807 (1.3%) Median real estate property taxes paid for housing units with no mortgage in 2022: $1,856 (1.3%)
Business Search- 14 Million verified businesses
Males: 524
(51.8%)
Females: 488
(48.2%)
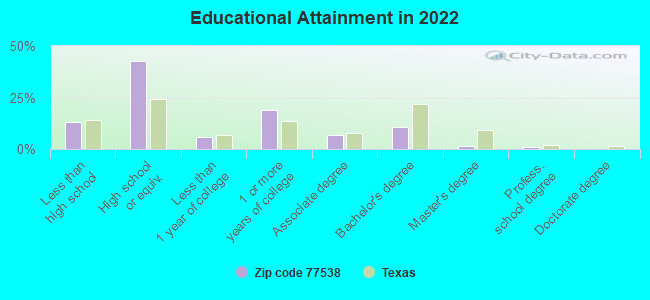
For population 25 years and over in 77538:
High school or higher: 84.8%
Bachelor's degree or higher: 12.8%
Graduate or professional degree: 2.5%
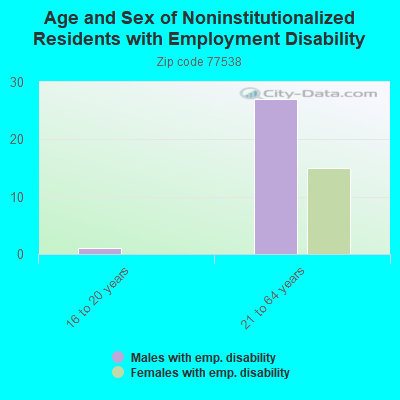
Unemployed: 8.4%
Mean travel time to work (commute): 30.4 minutes
For population 15 years and over in 77538:
Never married: 24.0%
Now married: 57.0%
Separated: 1.9%
Widowed: 6.8%
Divorced: 10.3%
Zip code 77538 compared to state average:
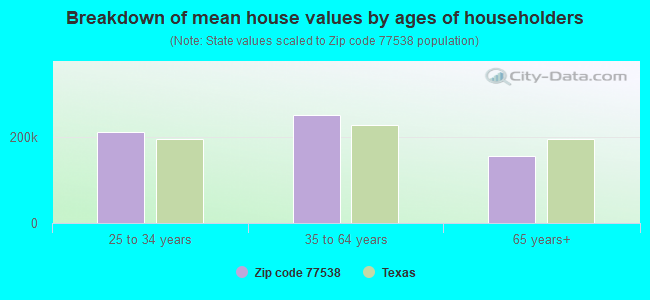
Median house value below state average.
Unemployed percentage above state average.
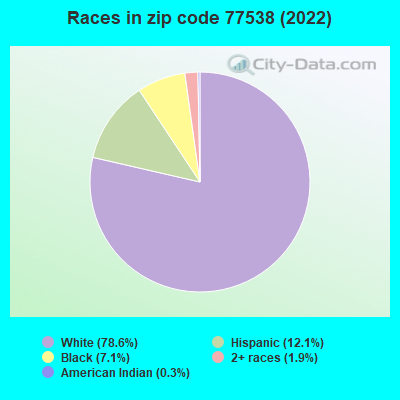
Hispanic race population percentage significantly below state average.
Median age above state average.
Foreign-born population percentage below state average.
Renting percentage significantly below state average.
Length of stay since moving in significantly above state average.
Percentage of population with a bachelor's degree or higher significantly below state average.
Estimated median house/condo value in 2022: $176,696
77538:
$176,696
Texas:
$275,400
According to our research of Texas and other state lists, there was 1 registered sex offender living in 77538 zip code as of May 11, 2024. The ratio of all residents to sex offenders in zip code 77538 is 872 to 1. The ratio of registered sex offenders to all residents in this zip code is lower than the state average.
Median resident age:
This zip code:
40.4 years
Texas median age:
35.6 years
Average household size:
This zip code:
3.1 people
Texas:
2.6 people
Averages for the 2020 tax year for zip code 77538, filed in 2021:
Average Adjusted Gross Income (AGI) in 2020: $72,530 (Individual Income Tax Returns)
Here:
$72,530
State:
$77,054
Salary/wage: $67,794 (reported on 89.2% of returns)
Here:
$67,794
State:
$62,766
(% of AGI for various income ranges: 1196.7% for AGIs below $25k, 4442.5% for AGIs $25k-50k, 6768.0% for AGIs $50k-75k, 10263.3% for AGIs $75k-100k, 19395.0% for AGIs $100k-200k)
Taxable interest for individuals: $489 (reported on 24.3% of returns)
This zip code:
$489
Texas:
$2,665
(% of AGI for various income ranges: 6.7% for AGIs below $25k, 10.0% for AGIs $50k-75k, 58.3% for AGIs $100k-200k)
Ordinary dividends: $2,600 (reported on 13.5% of returns)
Here:
$2,600
State:
$10,044
(% of AGI for various income ranges: 37.5% for AGIs $25k-50k, 166.7% for AGIs $100k-200k)
Net capital gain/loss in AGI: +$5,720 (reported on 13.5% of returns)
Here:
+$5,720
State:
+$39,590
(% of AGI for various income ranges: 27.5% for AGIs $25k-50k, 440.0% for AGIs $100k-200k)
Taxable individual retirement arrangement distribution: $19,767 (reported on 8.1% of returns)
77538:
$19,767
Texas:
$24,740
(% of AGI for various income ranges: 1186.0% for AGIs $50k-75k)
Earned income credit: $2,217 (reported on 16.2% of returns)
Here:
$2,217
State:
$2,584
(% of AGI for various income ranges: 103.3% for AGIs below $25k, 88.8% for AGIs $25k-50k)
Percentage of individuals using paid preparers for their 2020 taxes: 91.9%
Here:
92%
State:
92%
(% for various income ranges: 77.8% for AGIs below $25k, 90.0% for AGIs $25k-50k, 100.0% for AGIs $50k-75k, 100.0% for AGIs $75k-100k, 100.0% for AGIs $100k-200k)
Averages for the 2012 tax year for zip code 77538, filed in 2013:
Average Adjusted Gross Income (AGI) in 2012: $54,321 (Individual Income Tax Returns)
Here:
$54,321
State:
$65,384
Salary/wage: $52,364 (reported on 84.6% of returns)
Here:
$52,364
State:
$52,524
(% of AGI for various income ranges: 66.3% for AGIs below $25k, 93.1% for AGIs $25k-50k, 79.7% for AGIs $50k-75k, 70.4% for AGIs $75k-100k, 84.7% for AGIs $100k-200k)
Taxable interest for individuals: $464 (reported on 28.2% of returns)
This zip code:
$464
Texas:
$2,372
(% of AGI for various income ranges: 0.7% for AGIs below $25k, 0.6% for AGIs $50k-75k, 0.2% for AGIs $100k-200k)
Ordinary dividends: $1,925 (reported on 10.3% of returns)
Here:
$1,925
State:
$9,721
Net capital gain/loss in AGI: +$2,733 (reported on 7.7% of returns)
Here:
+$2,733
State:
+$35,319
Profit/loss from business: +$7,250 (reported on 15.4% of returns)
Here:
+$7,250
State:
+$13,732
Taxable individual retirement arrangement distribution: $10,500 (reported on 7.7% of returns)
77538:
$10,500
Texas:
$19,511
Total itemized deductions: $21,900 (19% of AGI, reported on 15.4% of returns)
Here:
$21,900
State:
$24,724
Here:
18.9% of AGI
State:
15.9% of AGI
Charity contributions: $4,125 (reported on 10.3% of returns)
Here:
$4,125
State:
$6,808
Taxes paid: $4,517 (reported on 15.4% of returns)
77538:
$4,517
State:
$6,921
Earned income credit: $2,286 (reported on 17.9% of returns)
Here:
$2,286
State:
$2,570
(% of AGI for various income ranges: 6.3% for AGIs below $25k, 1.6% for AGIs $25k-50k)
Percentage of individuals using paid preparers for their 2012 taxes: 61.5%
Here:
62%
State:
51%
(% for various income ranges: 53.8% for AGIs below $25k, 60.0% for AGIs $25k-50k, 66.7% for AGIs $50k-75k, 75.0% for AGIs $75k-100k, 66.7% for AGIs $100k-200k)
Averages for the 2004 tax year for zip code 77538, filed in 2005:
Average Adjusted Gross Income (AGI) in 2004: $39,086 (Individual Income Tax Returns)
Here:
$39,086
State:
$47,881
Salary/wage: $36,672 (reported on 87.4% of returns)
Here:
$36,672
State:
$41,947
(% of AGI for various income ranges: 258.8% for AGIs below $10k, 83.1% for AGIs $10k-25k, 80.7% for AGIs $25k-50k, 83.4% for AGIs $50k-75k, 91.6% for AGIs $75k-100k, 70.3% for AGIs over 100k)
Taxable interest for individuals: $1,260 (reported on 35.2% of returns)
This zip code:
$1,260
Texas:
$2,255
(% of AGI for various income ranges: 9.8% for AGIs below $10k, 0.8% for AGIs $10k-25k, 1.3% for AGIs $25k-50k, 0.5% for AGIs $50k-75k, 0.1% for AGIs $75k-100k, 2.2% for AGIs over 100k)
Taxable dividends: $1,370 (reported on 13.2% of returns)
Here:
$1,370
State:
$4,261
Net capital gain/loss: +$8,028 (reported on 10.3% of returns)
Here:
+$8,028
State:
+$16,110
Profit/loss from business: +$2,609 (reported on 13.2% of returns)
Here:
+$2,609
State:
+$11,013
Total itemized deductions: $20,510 (24% of AGI, reported on 14.6% of returns)
Here:
$20,510
State:
$19,631
Here:
23.8% of AGI
State:
18.9% of AGI
Charity contributions deductions: $5,727 (6% of AGI, reported on 12.6% of returns)
Here:
$5,727
State:
$4,753
Here:
6.3% of AGI
State:
4.2% of AGI
Total tax: $5,111 (reported on 69.9% of returns)
77538:
$5,111
State:
$9,058
(% of AGI for various income ranges: 4.9% for AGIs below $10k, 3.1% for AGIs $10k-25k, 6.0% for AGIs $25k-50k, 8.9% for AGIs $50k-75k, 11.1% for AGIs $75k-100k, 14.8% for AGIs over 100k)
Earned income credit: $1,646 (reported on 23.5% of returns)
Here:
$1,646
State:
$2,024
Percentage of individuals using paid preparers for their 2004 taxes: 57.6%
Here:
58%
State:
57%
(% for various income ranges: 54.7% for AGIs below $10k, 56.1% for AGIs $10k-25k, 60.0% for AGIs $25k-50k, 56.6% for AGIs $50k-75k, 54.5% for AGIs $75k-100k, 66.7% for AGIs over 100k)
Household received Food Stamps/SNAP in the past 12 months: 28 Household did not receive Food Stamps/SNAP in the past 12 months: 294
Women who did not have a birth in the past 12 months: 201 (104 now married, 96 unmarried)
Housing units in zip code 77538 with a mortgage: 96 (3 second mortgage) Median monthly owner costs for units with a mortgage: $2,194 Median monthly owner costs for units without a mortgage: $528
Residents with income below the poverty level in 2022:
This zip code:
2.1%
Whole state:
14.0%
Residents with income below 50% of the poverty level in 2022:
This zip code:
0.1%
Whole state:
7.4%
Median number of rooms in houses and condos:
Here:
6.3
State:
6.3
Median number of rooms in apartments:
Here:
4.2
State:
4.0
Notable locations in this zip code not listed on our city pages
Size of family households: 120 2-persons, 44 3-persons, 61 4-persons, 19 5-persons, 4 6-persons, 6 7-or-more-persons
Size of nonfamily households: 46 1-person, 20 2-persons
205 married couples with children.
9 single-parent households (5 men, 4 women).
88.3% of residents of 77538 zip code speak English at home.
11.0% of residents speak Spanish at home (74% very well, 11% well, 4% not well, 11% not at all).
0.3% of residents speak other Indo-European language at home (100% well).
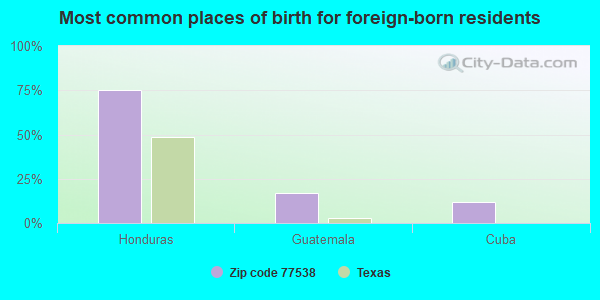
Foreign born population: 77 (7.7%) (42.6% of them are naturalized citizens)
This zip code:
7.7%
Whole state:
17.2%
75%Honduras
17%Guatemala
12%Cuba
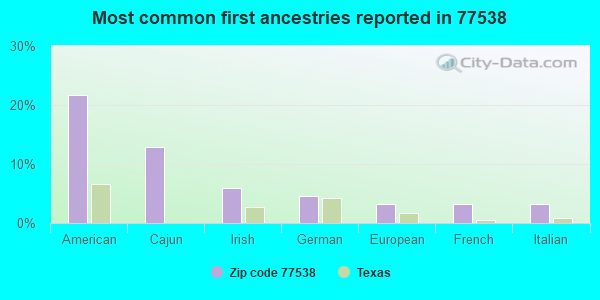
22%American
13%Cajun
6%Irish
5%German
3%European
3%French
3%Italian
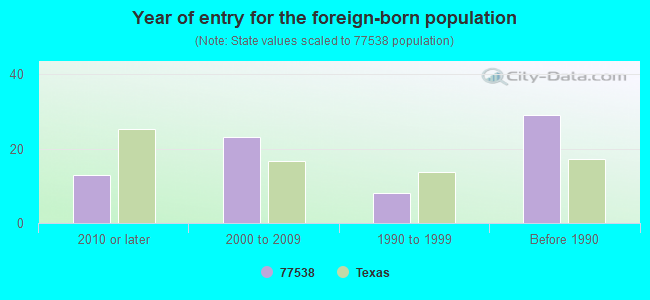
Year of entry for the foreign-born population
132010 or later
232000 to 2009
81990 to 1999
29Before 1990
Facilities with environmental interests located in this zip code:
AGRICULTURAL SPECIALISTS (HWY 90 in DEVERS, TX)
(Resource Conservation and Recovery Act (tracking hazardous waste)) Business NAICS classification: SOIL PREPARATION, PLANTING, AND CULTIVATING.
Housing units lacking complete plumbing facilities: 10.2% Housing units lacking complete kitchen facilities: 2.9%
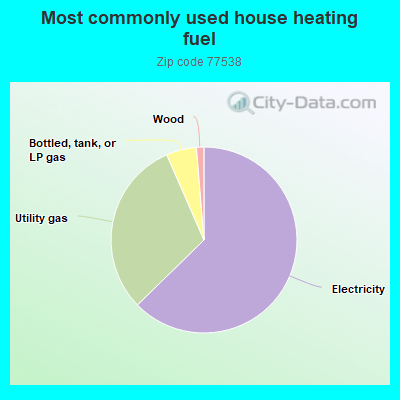
63.2%Electricity
31.0%Utility gas
5.3%Bottled, tank, or LP gas
1.3%Wood
Population in 1990: 570. Population change in the 1990s: +278 (+48.8%).
Place of birth for U.S.-born residents:
This state: 618
Northeast: 24
Midwest: 60
South: 210
West: 18
63% of the 77538 zip code residents lived in the same house 5 years ago. Out of people who lived in different houses, 45% lived in this county. Out of people who lived in different counties, 50% lived in Texas.
100% of the 77538 zip code residents lived in the same house 1 year ago.
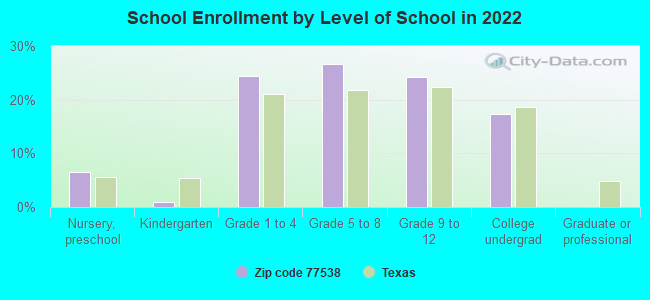
Private vs. public school enrollment:
Students in private schools in grades 1 to 8 (elementary and middle school): 28
Here:
17.1%
Texas:
8.8%
Students in private schools in grades 9 to 12 (high school):
Here:
0.0%
Texas:
8.0%
Students in private undergraduate colleges: 7
Here:
14.0%
Texas:
16.2%
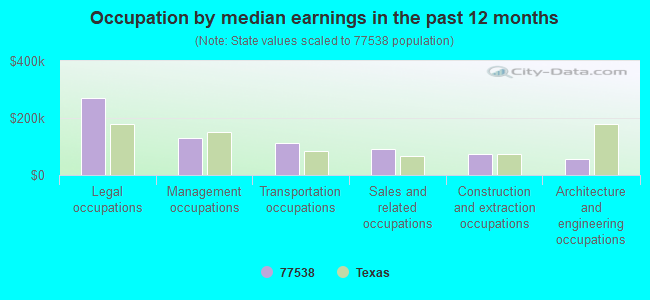
Occupation by median earnings in the past 12 months ($)
269,524Legal occupations
129,162Management occupations
113,836Transportation occupations
90,165Sales and related occupations
74,978Construction and extraction occupations
56,018Architecture and engineering occupations
Top industries in this zip code by the number of employees in 2005:
Real Estate and Rental and Leasing: Construction, Mining, and Forestry Machinery and Equipment Rental and Leasing (20-49 employees: 1 establishment, 10-19 employees: 1 establishment)
Utilities: Water Supply and Irrigation Systems (5-9: 1)
Construction: Masonry Contractors (1-4: 1)
Other Services (except Public Administration): Other Personal Care Services (1-4: 1)
Fatal accident statistics in 2013:
Fatal accident count: 1
Vehicles involved in fatal accidents: 1
Fatal accidents caused by drunken drivers: 1
Fatalities: 1
Persons involved in fatal accidents: 3
Pedestrians involved in fatal accidents: 0
Home Mortgage Disclosure Act Aggregated Statistics For Year 2009 (Based on 4 partial tracts)
A) FHA, FSA/RHS & VA Home Purchase Loans
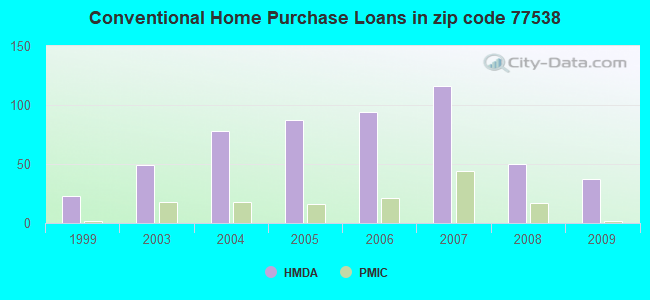
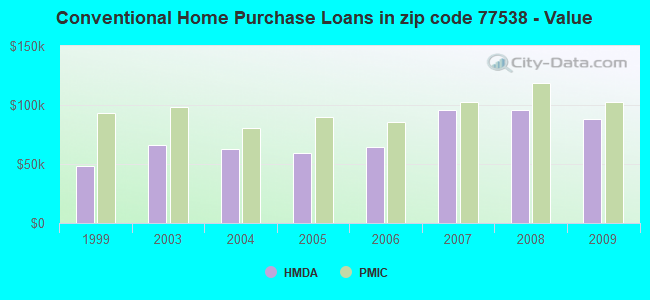
B) Conventional Home Purchase Loans
C) Refinancings
D) Home Improvement Loans
F) Non-occupant Loans on < 5 Family Dwellings (A B C & D)
G) Loans On Manufactured Home Dwelling (A B C & D)
Number
Average Value
Number
Average Value
Number
Average Value
Number
Average Value
Number
Average Value
Number
Average Value
LOANS ORIGINATED
25
$120,087
37
$87,753
36
$107,639
26
$24,216
9
$49,233
18
$44,334
APPLICATIONS APPROVED, NOT ACCEPTED
2
$73,070
8
$68,965
5
$102,598
0
$0
0
$0
6
$45,957
APPLICATIONS DENIED
5
$63,722
30
$40,508
36
$104,995
24
$39,203
5
$33,498
27
$40,940
APPLICATIONS WITHDRAWN
1
$154,130
4
$116,080
14
$99,591
2
$7,980
1
$138,020
1
$11,500
FILES CLOSED FOR INCOMPLETENESS
0
$0
0
$0
4
$69,150
0
$0
0
$0
0
$0
Aggregated Statistics For Year 2008 (Based on 4 partial tracts)
A) FHA, FSA/RHS & VA Home Purchase Loans
B) Conventional Home Purchase Loans
C) Refinancings
D) Home Improvement Loans
F) Non-occupant Loans on < 5 Family Dwellings (A B C & D)
G) Loans On Manufactured Home Dwelling (A B C & D)
Number
Average Value
Number
Average Value
Number
Average Value
Number
Average Value
Number
Average Value
Number
Average Value
LOANS ORIGINATED
17
$106,484
50
$95,845
23
$104,027
25
$21,837
14
$70,444
15
$50,009
APPLICATIONS APPROVED, NOT ACCEPTED
3
$76,680
19
$66,134
7
$69,176
3
$13,310
1
$29,910
14
$51,331
APPLICATIONS DENIED
3
$214,320
53
$59,517
29
$93,260
42
$23,770
5
$53,140
37
$48,127
APPLICATIONS WITHDRAWN
6
$129,590
9
$107,747
11
$89,989
4
$36,810
0
$0
3
$43,363
FILES CLOSED FOR INCOMPLETENESS
0
$0
4
$35,195
5
$78,904
0
$0
0
$0
3
$24,003
Aggregated Statistics For Year 2007 (Based on 4 partial tracts)
A) FHA, FSA/RHS & VA Home Purchase Loans
B) Conventional Home Purchase Loans
C) Refinancings
D) Home Improvement Loans
F) Non-occupant Loans on < 5 Family Dwellings (A B C & D)
G) Loans On Manufactured Home Dwelling (A B C & D)
Number
Average Value
Number
Average Value
Number
Average Value
Number
Average Value
Number
Average Value
Number
Average Value
LOANS ORIGINATED
7
$120,607
116
$95,668
27
$104,513
32
$26,877
19
$71,848
19
$47,991
APPLICATIONS APPROVED, NOT ACCEPTED
1
$113,870
18
$88,534
12
$92,012
3
$14,300
4
$44,342
4
$58,360
APPLICATIONS DENIED
2
$61,480
75
$83,344
57
$85,898
45
$28,045
7
$98,914
33
$39,045
APPLICATIONS WITHDRAWN
1
$156,430
27
$72,892
33
$92,947
2
$13,140
3
$122,597
6
$53,868
FILES CLOSED FOR INCOMPLETENESS
2
$123,850
2
$68,600
12
$90,783
1
$12,650
0
$0
0
$0
Aggregated Statistics For Year 2006 (Based on 4 partial tracts)
A) FHA, FSA/RHS & VA Home Purchase Loans
B) Conventional Home Purchase Loans
C) Refinancings
D) Home Improvement Loans
F) Non-occupant Loans on < 5 Family Dwellings (A B C & D)
G) Loans On Manufactured Home Dwelling (A B C & D)
Number
Average Value
Number
Average Value
Number
Average Value
Number
Average Value
Number
Average Value
Number
Average Value
LOANS ORIGINATED
12
$87,723
94
$64,645
61
$77,867
37
$37,477
13
$45,309
33
$53,047
APPLICATIONS APPROVED, NOT ACCEPTED
0
$0
26
$53,328
15
$74,102
4
$25,522
1
$86,260
16
$74,439
APPLICATIONS DENIED
4
$69,915
96
$59,367
58
$72,823
61
$29,035
11
$46,610
63
$48,020
APPLICATIONS WITHDRAWN
0
$0
26
$70,995
45
$92,057
7
$74,381
2
$17,335
4
$52,180
FILES CLOSED FOR INCOMPLETENESS
0
$0
8
$59,810
10
$86,484
0
$0
0
$0
0
$0
Aggregated Statistics For Year 2005 (Based on 4 partial tracts)
A) FHA, FSA/RHS & VA Home Purchase Loans
B) Conventional Home Purchase Loans
C) Refinancings
D) Home Improvement Loans
E) Loans on Dwellings For 5+ Families
F) Non-occupant Loans on < 5 Family Dwellings (A B C & D)
G) Loans On Manufactured Home Dwelling (A B C & D)
Number
Average Value
Number
Average Value
Number
Average Value
Number
Average Value
Number
Average Value
Number
Average Value
Number
Average Value
LOANS ORIGINATED
8
$99,036
87
$59,014
61
$91,344
42
$45,453
1
$57,510
15
$32,339
25
$46,004
APPLICATIONS APPROVED, NOT ACCEPTED
1
$139,170
29
$54,511
10
$56,015
5
$13,552
0
$0
1
$60,960
12
$52,369
APPLICATIONS DENIED
6
$72,887
107
$52,286
104
$75,005
48
$25,433
0
$0
8
$66,110
72
$43,741
APPLICATIONS WITHDRAWN
3
$91,113
26
$82,167
56
$97,491
12
$185,342
0
$0
2
$161,030
9
$80,724
FILES CLOSED FOR INCOMPLETENESS
0
$0
6
$59,048
15
$97,876
3
$71,550
0
$0
0
$0
0
$0
Aggregated Statistics For Year 2004 (Based on 4 partial tracts)
A) FHA, FSA/RHS & VA Home Purchase Loans
B) Conventional Home Purchase Loans
C) Refinancings
D) Home Improvement Loans
F) Non-occupant Loans on < 5 Family Dwellings (A B C & D)
G) Loans On Manufactured Home Dwelling (A B C & D)
Number
Average Value
Number
Average Value
Number
Average Value
Number
Average Value
Number
Average Value
Number
Average Value
LOANS ORIGINATED
9
$70,472
78
$62,749
90
$65,997
48
$26,021
12
$34,316
24
$41,644
APPLICATIONS APPROVED, NOT ACCEPTED
1
$58,660
22
$57,883
19
$70,264
5
$34,418
3
$31,183
6
$41,245
APPLICATIONS DENIED
1
$55,210
65
$63,764
111
$72,203
47
$27,324
12
$45,482
29
$46,973
APPLICATIONS WITHDRAWN
2
$152,400
17
$53,284
75
$76,036
4
$67,902
0
$0
7
$46,593
FILES CLOSED FOR INCOMPLETENESS
0
$0
7
$57,973
42
$105,826
1
$34,510
0
$0
0
$0
Aggregated Statistics For Year 2003 (Based on 4 partial tracts)
A) FHA, FSA/RHS & VA Home Purchase Loans
B) Conventional Home Purchase Loans
C) Refinancings
D) Home Improvement Loans
F) Non-occupant Loans on < 5 Family Dwellings (A B C & D)
Number
Average Value
Number
Average Value
Number
Average Value
Number
Average Value
Number
Average Value
LOANS ORIGINATED
7
$81,829
49
$65,957
134
$73,778
58
$12,206
16
$46,781
APPLICATIONS APPROVED, NOT ACCEPTED
5
$84,512
18
$70,791
26
$71,861
3
$34,693
5
$92,582
APPLICATIONS DENIED
4
$72,390
62
$49,191
129
$73,046
34
$24,731
2
$45,500
APPLICATIONS WITHDRAWN
3
$98,713
10
$65,809
66
$60,905
1
$1,150
0
$0
FILES CLOSED FOR INCOMPLETENESS
0
$0
2
$111,280
10
$60,466
0
$0
0
$0
Aggregated Statistics For Year 1999 (Based on 1 full and 2 partial tracts)
A) FHA, FSA/RHS & VA Home Purchase Loans
B) Conventional Home Purchase Loans
C) Refinancings
D) Home Improvement Loans
F) Non-occupant Loans on < 5 Family Dwellings (A B C & D)

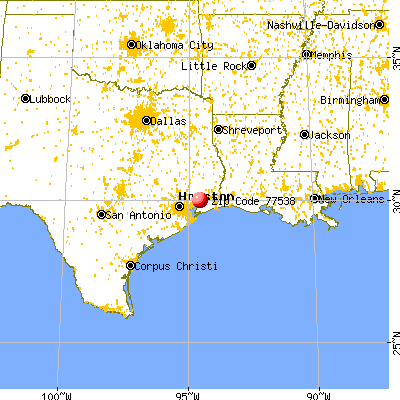


 Nearest zip codes: 77629, 77533, 77560, 77613, 77665, 77659.