Estimated zip code population in 2022: 48,510 Zip code population in 2010: 38,806 Zip code population in 2000: 26,851
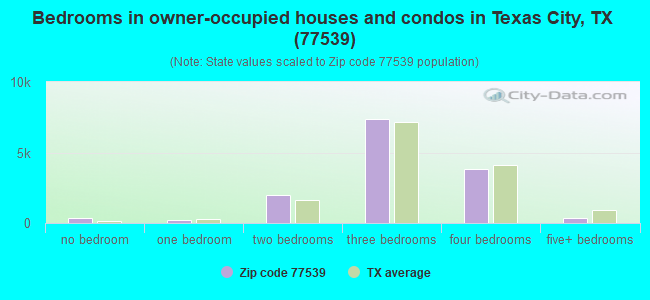
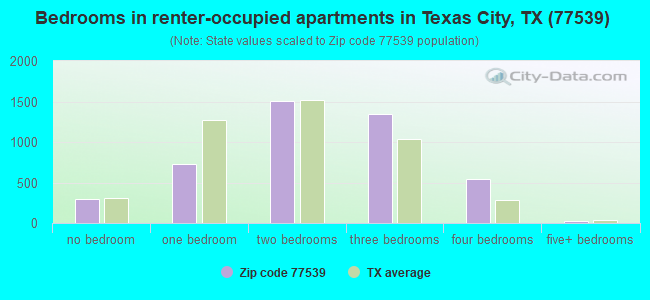
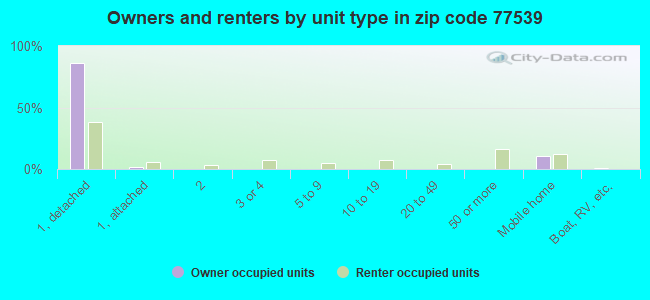
Houses and condos: 19,951 Renter-occupied apartments: 4,437
% of renters here:
24%
State:
38%
March 2022 cost of living index in zip code 77539: 96.0 (near average, U.S. average is 100)
Land area: 50.4 sq. mi. Water area: 3.1 sq. mi.
Population density: 962 people per square mile
(low).
OSM Map
General Map
Google Map
MSN Map
OSM Map
General Map
Google Map
MSN Map
OSM Map
General Map
Google Map
MSN Map
OSM Map
General Map
Google Map
MSN Map
Please wait while loading the map...
Real estate property taxes paid for housing units in 2022:
This zip code:
1.6% ($4,088)
Texas:
1.5% ($4,050)
Median real estate property taxes paid for housing units with mortgages in 2022: $4,776 (1.7%) Median real estate property taxes paid for housing units with no mortgage in 2022: $2,734 (1.2%)
Averages for the 2020 tax year for zip code 77539, filed in 2021:
Average Adjusted Gross Income (AGI) in 2020: $62,699 (Individual Income Tax Returns)
Here:
$62,699
State:
$77,054
Salary/wage: $57,549 (reported on 84.0% of returns)
Here:
$57,549
State:
$62,766
(% of AGI for various income ranges: 1192.3% for AGIs below $25k, 3612.0% for AGIs $25k-50k, 6533.6% for AGIs $50k-75k, 9561.9% for AGIs $75k-100k, 16826.2% for AGIs $100k-200k, 49271.5% for AGIs over 200k)
Taxable interest for individuals: $1,261 (reported on 20.1% of returns)
This zip code:
$1,261
Texas:
$2,665
(% of AGI for various income ranges: 10.4% for AGIs below $25k, 12.3% for AGIs $25k-50k, 19.5% for AGIs $50k-75k, 40.6% for AGIs $75k-100k, 77.5% for AGIs $100k-200k, 555.6% for AGIs over 200k)
Ordinary dividends: $4,524 (reported on 10.7% of returns)
Here:
$4,524
State:
$10,044
(% of AGI for various income ranges: 11.3% for AGIs below $25k, 19.4% for AGIs $25k-50k, 36.0% for AGIs $50k-75k, 60.6% for AGIs $75k-100k, 113.0% for AGIs $100k-200k, 1698.9% for AGIs over 200k)
Net capital gain/loss in AGI: +$18,482 (reported on 10.4% of returns)
Here:
+$18,482
State:
+$39,590
(% of AGI for various income ranges: 5.2% for AGIs below $25k, 11.5% for AGIs $25k-50k, 40.2% for AGIs $50k-75k, 93.5% for AGIs $75k-100k, 246.0% for AGIs $100k-200k, 12010.4% for AGIs over 200k)
Profit/loss from business: +$6,216 (reported on 20.8% of returns)
Here:
+$6,216
State:
+$10,888
(% of AGI for various income ranges: 146.5% for AGIs below $25k, 72.2% for AGIs $25k-50k, 16.4% for AGIs $50k-75k, 76.5% for AGIs $75k-100k, 175.3% for AGIs $100k-200k, 4108.5% for AGIs over 200k)
Taxable individual retirement arrangement distribution: $24,958 (reported on 6.4% of returns)
77539:
$24,958
Texas:
$24,740
(% of AGI for various income ranges: 33.1% for AGIs below $25k, 68.3% for AGIs $25k-50k, 143.8% for AGIs $50k-75k, 319.1% for AGIs $75k-100k, 646.9% for AGIs $100k-200k, 2549.6% for AGIs over 200k)
Self-employed (Keogh) retirement plans: $20,875 (reported on 0.2% of returns)
77539:
$20,875
Texas:
$29,298
(% of AGI for various income ranges: 10.1% for AGIs $50k-75k, 215.6% for AGIs over 200k)
Total itemized deductions: $31,453 (reported on 7.5% of returns)
Here:
$31,453
State:
$40,428
(% of AGI for various income ranges: 32.3% for AGIs below $25k, 126.5% for AGIs $25k-50k, 315.2% for AGIs $50k-75k, 553.5% for AGIs $75k-100k, 839.5% for AGIs $100k-200k, 3188.1% for AGIs over 200k)
Charity contributions: $10,259 (reported on 5.6% of returns)
Here:
$10,259
State:
$18,201
(% of AGI for various income ranges: 3.4% for AGIs below $25k, 20.6% for AGIs $25k-50k, 53.1% for AGIs $50k-75k, 117.1% for AGIs $75k-100k, 214.2% for AGIs $100k-200k, 1204.8% for AGIs over 200k)
Taxes paid: $7,583 (reported on 7.1% of returns)
77539:
$7,583
State:
$7,821
(% of AGI for various income ranges: 6.4% for AGIs below $25k, 27.4% for AGIs $25k-50k, 76.2% for AGIs $50k-75k, 128.8% for AGIs $75k-100k, 198.2% for AGIs $100k-200k, 648.9% for AGIs over 200k)
Earned income credit: $2,539 (reported on 19.8% of returns)
Here:
$2,539
State:
$2,584
(% of AGI for various income ranges: 134.4% for AGIs below $25k, 80.5% for AGIs $25k-50k, 1.4% for AGIs $50k-75k)
Percentage of individuals using paid preparers for their 2020 taxes: 92.2%
Here:
92%
State:
92%
(% for various income ranges: 91.4% for AGIs below $25k, 92.3% for AGIs $25k-50k, 93.3% for AGIs $50k-75k, 93.4% for AGIs $75k-100k, 92.3% for AGIs $100k-200k, 90.9% for AGIs over 200k)
Averages for the 2012 tax year for zip code 77539, filed in 2013:
Average Adjusted Gross Income (AGI) in 2012: $55,919 (Individual Income Tax Returns)
Here:
$55,919
State:
$65,384
Salary/wage: $51,277 (reported on 87.0% of returns)
Here:
$51,277
State:
$52,524
(% of AGI for various income ranges: 76.6% for AGIs below $25k, 85.6% for AGIs $25k-50k, 84.2% for AGIs $50k-75k, 84.5% for AGIs $75k-100k, 84.3% for AGIs $100k-200k, 54.8% for AGIs over 200k)
Taxable interest for individuals: $934 (reported on 25.9% of returns)
This zip code:
$934
Texas:
$2,372
(% of AGI for various income ranges: 0.6% for AGIs below $25k, 0.4% for AGIs $25k-50k, 0.3% for AGIs $50k-75k, 0.4% for AGIs $75k-100k, 0.3% for AGIs $100k-200k, 0.7% for AGIs over 200k)
Ordinary dividends: $5,338 (reported on 11.5% of returns)
Here:
$5,338
State:
$9,721
(% of AGI for various income ranges: 1.0% for AGIs below $25k, 0.4% for AGIs $25k-50k, 0.7% for AGIs $50k-75k, 0.5% for AGIs $75k-100k, 0.7% for AGIs $100k-200k, 4.0% for AGIs over 200k)
Net capital gain/loss in AGI: +$10,716 (reported on 9.0% of returns)
Here:
+$10,716
State:
+$35,319
(% of AGI for various income ranges: 0.2% for AGIs $50k-75k, 0.3% for AGIs $75k-100k, 0.5% for AGIs $100k-200k, 10.7% for AGIs over 200k)
Profit/loss from business: +$10,277 (reported on 17.2% of returns)
Here:
+$10,277
State:
+$13,732
(% of AGI for various income ranges: 12.1% for AGIs below $25k, 2.9% for AGIs $25k-50k, 1.5% for AGIs $50k-75k, 1.9% for AGIs $75k-100k, 1.7% for AGIs $100k-200k, 4.7% for AGIs over 200k)
Taxable individual retirement arrangement distribution: $18,698 (reported on 7.2% of returns)
77539:
$18,698
Texas:
$19,511
(% of AGI for various income ranges: 1.8% for AGIs below $25k, 1.7% for AGIs $25k-50k, 2.5% for AGIs $50k-75k, 2.6% for AGIs $75k-100k, 2.8% for AGIs $100k-200k, 2.3% for AGIs over 200k)
Self-employment retirement plans: $25,380 (reported on 0.3% of returns)
77539:
$25,380
Texas:
$23,938
Total itemized deductions: $19,909 (20% of AGI, reported on 28.3% of returns)
Here:
$19,909
State:
$24,724
Here:
20.1% of AGI
State:
15.9% of AGI
(% of AGI for various income ranges: 6.7% for AGIs below $25k, 8.8% for AGIs $25k-50k, 11.6% for AGIs $50k-75k, 11.7% for AGIs $75k-100k, 10.5% for AGIs $100k-200k, 8.9% for AGIs over 200k)
Charity contributions: $4,088 (reported on 20.6% of returns)
Here:
$4,088
State:
$6,808
(% of AGI for various income ranges: 0.6% for AGIs below $25k, 1.0% for AGIs $25k-50k, 1.3% for AGIs $50k-75k, 1.5% for AGIs $75k-100k, 1.6% for AGIs $100k-200k, 2.4% for AGIs over 200k)
Taxes paid: $5,932 (reported on 27.8% of returns)
77539:
$5,932
State:
$6,921
(% of AGI for various income ranges: 1.4% for AGIs below $25k, 2.2% for AGIs $25k-50k, 3.3% for AGIs $50k-75k, 3.5% for AGIs $75k-100k, 3.5% for AGIs $100k-200k, 2.5% for AGIs over 200k)
Earned income credit: $2,485 (reported on 21.0% of returns)
Here:
$2,485
State:
$2,570
(% of AGI for various income ranges: 8.7% for AGIs below $25k, 1.3% for AGIs $25k-50k)
Percentage of individuals using paid preparers for their 2012 taxes: 46.7%
Here:
47%
State:
51%
(% for various income ranges: 47.5% for AGIs below $25k, 45.1% for AGIs $25k-50k, 44.4% for AGIs $50k-75k, 45.3% for AGIs $75k-100k, 47.5% for AGIs $100k-200k, 65.8% for AGIs over 200k)
Averages for the 2004 tax year for zip code 77539, filed in 2005:
Average Adjusted Gross Income (AGI) in 2004: $44,624 (Individual Income Tax Returns)
Here:
$44,624
State:
$47,881
Salary/wage: $42,197 (reported on 87.3% of returns)
Here:
$42,197
State:
$41,947
(% of AGI for various income ranges: 101.7% for AGIs below $10k, 79.9% for AGIs $10k-25k, 86.2% for AGIs $25k-50k, 84.5% for AGIs $50k-75k, 87.4% for AGIs $75k-100k, 75.8% for AGIs over 100k)
Taxable interest for individuals: $1,246 (reported on 35.6% of returns)
This zip code:
$1,246
Texas:
$2,255
(% of AGI for various income ranges: 3.9% for AGIs below $10k, 1.3% for AGIs $10k-25k, 0.9% for AGIs $25k-50k, 0.9% for AGIs $50k-75k, 0.8% for AGIs $75k-100k, 1.0% for AGIs over 100k)
Taxable dividends: $2,067 (reported on 15.4% of returns)
Here:
$2,067
State:
$4,261
(% of AGI for various income ranges: 1.7% for AGIs below $10k, 0.8% for AGIs $10k-25k, 0.6% for AGIs $25k-50k, 0.6% for AGIs $50k-75k, 0.6% for AGIs $75k-100k, 0.9% for AGIs over 100k)
Net capital gain/loss: +$5,192 (reported on 12.7% of returns)
Here:
+$5,192
State:
+$16,110
(% of AGI for various income ranges: -1.1% for AGIs below $10k, 0.4% for AGIs $10k-25k, 0.3% for AGIs $25k-50k, 0.4% for AGIs $50k-75k, 0.4% for AGIs $75k-100k, 4.1% for AGIs over 100k)
Profit/loss from business: +$10,165 (reported on 16.3% of returns)
Here:
+$10,165
State:
+$11,013
(% of AGI for various income ranges: 10.3% for AGIs below $10k, 8.0% for AGIs $10k-25k, 2.1% for AGIs $25k-50k, 1.6% for AGIs $50k-75k, 1.7% for AGIs $75k-100k, 5.8% for AGIs over 100k)
IRA payment deduction: $3,019 (reported on 2.0% of returns)
77539:
$3,019
Texas:
$3,120
(% of AGI for various income ranges: 0.2% for AGIs $10k-25k, 0.2% for AGIs $25k-50k, 0.1% for AGIs $50k-75k, 0.1% for AGIs $75k-100k, 0.1% for AGIs over 100k)
Self-employed pension: $17,263 (reported on 0.4% of returns)
Here:
$17,263
Texas:
$16,401
Total itemized deductions: $19,553 (25% of AGI, reported on 28.4% of returns)
Here:
$19,553
State:
$19,631
Here:
24.9% of AGI
State:
18.9% of AGI
(% of AGI for various income ranges: 7.8% for AGIs below $10k, 4.9% for AGIs $10k-25k, 9.7% for AGIs $25k-50k, 17.2% for AGIs $50k-75k, 18.0% for AGIs $75k-100k, 10.2% for AGIs over 100k)
Charity contributions deductions: $3,128 (4% of AGI, reported on 22.6% of returns)
Here:
$3,128
State:
$4,753
Here:
3.8% of AGI
State:
4.2% of AGI
(% of AGI for various income ranges: 0.4% for AGIs below $10k, 0.6% for AGIs $10k-25k, 1.2% for AGIs $25k-50k, 1.6% for AGIs $50k-75k, 1.8% for AGIs $75k-100k, 2.0% for AGIs over 100k)
Total tax: $6,661 (reported on 73.5% of returns)
77539:
$6,661
State:
$9,058
(% of AGI for various income ranges: 3.1% for AGIs below $10k, 3.9% for AGIs $10k-25k, 6.4% for AGIs $25k-50k, 9.3% for AGIs $50k-75k, 11.1% for AGIs $75k-100k, 17.6% for AGIs over 100k)
Earned income credit: $1,891 (reported on 20.3% of returns)
Here:
$1,891
State:
$2,024
Percentage of individuals using paid preparers for their 2004 taxes: 52.1%
Here:
52%
State:
57%
(% for various income ranges: 48.1% for AGIs below $10k, 58.6% for AGIs $10k-25k, 52.6% for AGIs $25k-50k, 47.4% for AGIs $50k-75k, 48.3% for AGIs $75k-100k, 53.3% for AGIs over 100k)
Likely homosexual households (counted as self-reported same-sex unmarried-partner households)
Lesbian couples: 0.0% of all households
Gay men: 0.3% of all households
Household received Food Stamps/SNAP in the past 12 months: 2,159 Household did not receive Food Stamps/SNAP in the past 12 months: 16,481
Women who had a birth in the past 12 months: 658 (453 now married, 205 unmarried) Women who did not have a birth in the past 12 months: 11,467 (5,960 now married, 5,477 unmarried)
Housing units in zip code 77539 with a mortgage: 8,025 (341 second mortgage, 203 both second mortgage and home equity loan) Houses without a mortgage: 135
Median monthly owner costs for units with a mortgage: $1,865 Median monthly owner costs for units without a mortgage: $606
Residents with income below the poverty level in 2022:
This zip code:
11.4%
Whole state:
14.0%
Residents with income below 50% of the poverty level in 2022:
This zip code:
5.5%
Whole state:
7.4%
Median number of rooms in houses and condos:
Here:
6.1
State:
6.3
Median number of rooms in apartments:
Here:
4.6
State:
4.0
Notable locations in this zip code not listed on our city pages
Notable locations in zip code 77539: Bayou Golf Club (A), Dickinson Country Club (B), San Leon Marina (C), Eagle Point Camp Marina (D), Hulen Park (E), Humble Camp (F), San Leon Station (G), Dickinson Volunteer Fire Department Station 2 (H), Dickinson Volunteer Fire Department Station 1 (I), San Leon Volunteer Fire Department (J), Galveston County Sheriff's Office (K), Dickinson Police Department (L), Dickinson Chamber of Commerce (M), League City Volunteer Fire Department Station 5 (N). Display/hide their locations on the map
Churches in zip code 77539 include: First Baptist Church of Dickinson (A), Saint James African Methodist Episcopal Church (B), New Light Missionary Baptist Church (C), Mount Olive Missionary Baptist Church (D), Mount Carmel Baptist Church (E), First United Methodist Church Dickinson (F), Faith United Methodist Church (G), Jackson Memorial Church of God in Christ (H), Mainland Community Church (I). Display/hide their locations on the map
Lakes and reservoirs: Salt Lake (A), Galveston County Industrial Water Reservoir (B), Galveston County Water Reservoir (C). Display/hide their locations on the map
Parks in zip code 77539 include: La Salle Park (1), Galveston County Water Reservoir Park (2), Sam Vitanza Stadium (3), DeLeon Park (4), Bayshore Park (5). Display/hide their locations on the map
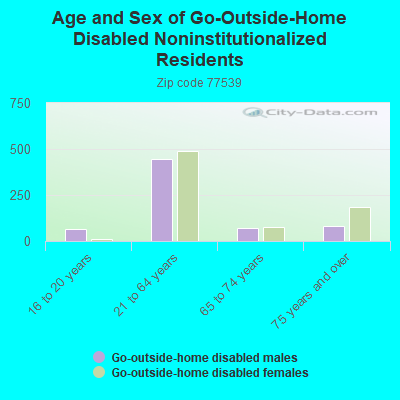
In group quarters: 731 (-1 institutionalized population)
Size of family households: 5,361 2-persons, 2,750 3-persons, 2,517 4-persons, 1,583 5-persons, 409 6-persons, 208 7-or-more-persons
Size of nonfamily households: 4,603 1-person, 1,170 2-persons, 42 3-persons
8,743 married couples with children.
1,957 single-parent households (388 men, 1,569 women).
73.3% of residents of 77539 zip code speak English at home.
23.0% of residents speak Spanish at home (66% very well, 19% well, 11% not well, 4% not at all).
1.7% of residents speak other Indo-European language at home (75% very well, 16% well, 9% not well).
1.6% of residents speak Asian or Pacific Island language at home (76% very well, 17% well, 4% not well, 2% not at all).
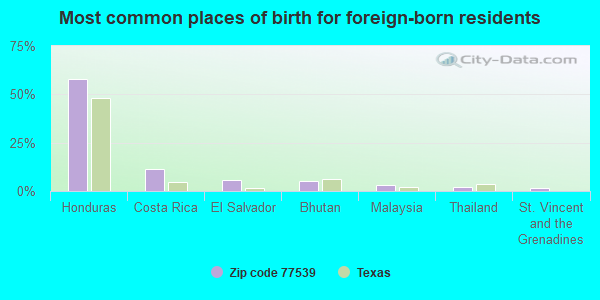
Foreign born population: 6,130 (12.6%) (54.5% of them are naturalized citizens)
This zip code:
12.6%
Whole state:
17.2%
58%Honduras
11%Costa Rica
6%El Salvador
5%Bhutan
3%Malaysia
2%Thailand
1%St. Vincent and the Grenadines
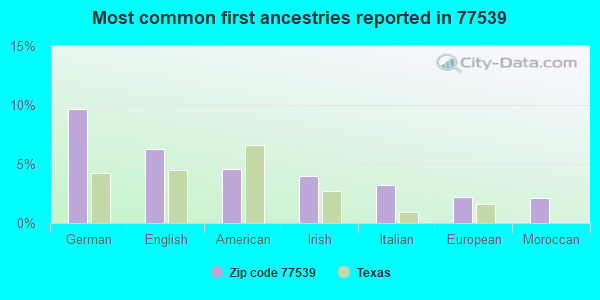
10%German
6%English
5%American
4%Irish
3%Italian
2%European
2%Moroccan
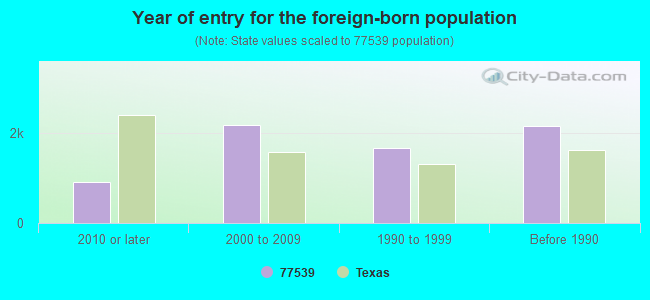
Year of entry for the foreign-born population
9152010 or later
2,1732000 to 2009
1,6631990 to 1999
2,155Before 1990
Facilities with environmental interests located in this zip code:
ABOUT FACE (3606 YUPON DR in DICKINSON, TX)
(National Center for Education Statistics) - STATE ID-084901011 Organizations: DICKINSON ISD (SCHOOL DISTRICT)
APR LABORATORY INC (3323 GULF FWY in DICKINSON, TX)
(Resource Conservation and Recovery Act (tracking hazardous waste))
Housing units lacking complete plumbing facilities: 2.4% Housing units lacking complete kitchen facilities: 3.2%
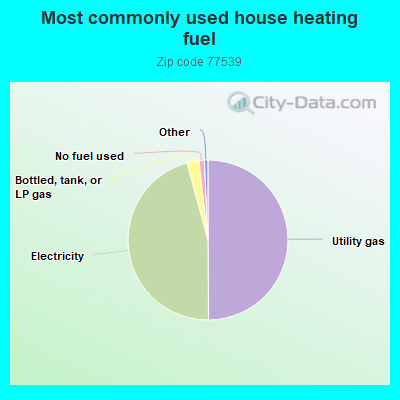
49.9%Utility gas
45.9%Electricity
2.4%Bottled, tank, or LP gas
1.1%No fuel used
Population in 1990: 21,905. Population change in the 1990s: +4,946 (+22.6%).
Place of birth for U.S.-born residents:
This state: 29,800
Northeast: 1,145
Midwest: 2,824
South: 4,561
West: 2,862
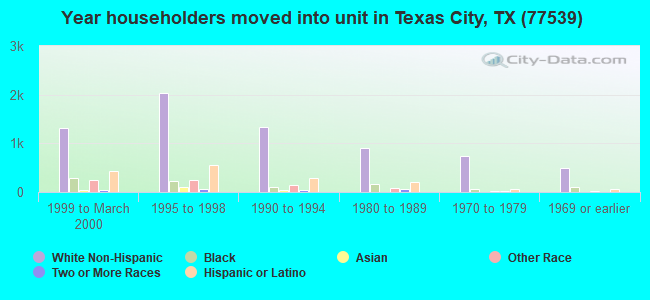
55% of the 77539 zip code residents lived in the same house 5 years ago. Out of people who lived in different houses, 57% lived in this county. Out of people who lived in different counties, 50% lived in Texas.
86% of the 77539 zip code residents lived in the same house 1 year ago. Out of people who lived in different houses, 45% moved from this county. Out of people who lived in different houses, 38% moved from different county within same state. Out of people who lived in different houses, 16% moved from different state. Out of people who lived in different houses, 1% moved from abroad.
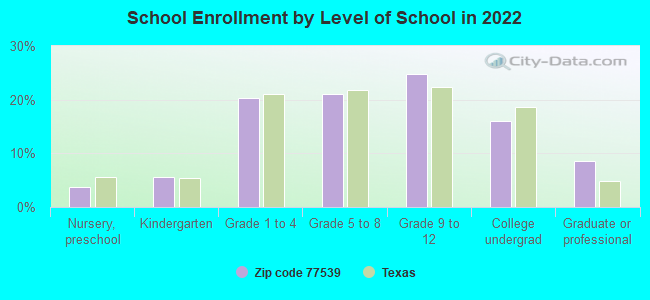
Private vs. public school enrollment:
Students in private schools in grades 1 to 8 (elementary and middle school): 222
Here:
4.2%
Texas:
8.8%
Students in private schools in grades 9 to 12 (high school): 174
Here:
5.6%
Texas:
8.0%
Students in private undergraduate colleges: 272
Here:
13.4%
Texas:
16.2%
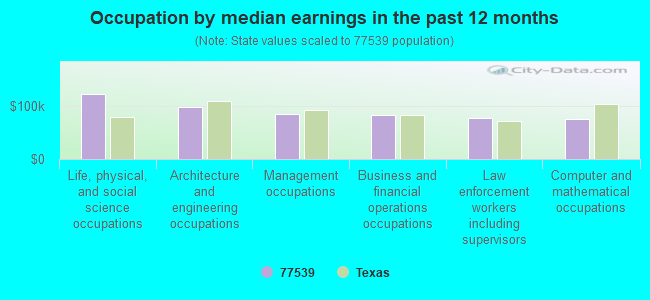
Occupation by median earnings in the past 12 months ($)
122,136Life, physical, and social science occupations
96,861Architecture and engineering occupations
84,453Management occupations
81,623Business and financial operations occupations
76,304Law enforcement workers including supervisors
75,289Computer and mathematical occupations
Companies with federal contracts located in this zip code (DICKINSON, TX):
MARINE CONNECTION SERVICES, IN (1555 W FM 517; small business) : $733,057 in 4 contractsfrom 2004 to 2005
$594,297 with Army for Generators and Generators Sets, Electrical. Taking place in OH. Signed on 2004-03-11. Completion date: 2004-12-03.
$99,760, same as above.Signed on 2005-06-30. Completion date: 2005-05-25.
$39,500, same as above.Signed on 2004-09-30. Completion date: 2004-12-03.
-$500, same as above.Signed on 2004-09-21. Completion date: 2004-12-03.
GAS-MIXTURES, INC (6206 FM 517 RD E; small business) : $182,744 in 4 contractsfrom 2004 to 2005
$137,309 with Air Force for Gas -- Applied Research and Exploratory Development (R&D). Signed on 2004-03-22. Completion date: 2004-07-01.
$19,837, same as above.Signed on 2004-04-14. Completion date: 2004-07-01.
$16,026 with Air Force for Defense Electronics and Communication Equipment -- Operational Systems Development (R&D). Signed on 2005-02-02. Completion date: 2005-02-11.
$9,572 with Air Force for Gas -- Applied Research and Exploratory Development (R&D). Signed on 2004-08-04. Completion date: 2004-09-30.
DIRT CHEAP DRIVES (3716 TIMBER DRIVE; small business)
$50,875 with Navy for ADP Central Processing Unit (CPU, Computer), Analog. Signed on 1999-12-20. Completion date: 1999-12-23.
VENTURE AUDIOMETRIC SERVICES I (8021 FM 517 W; small business)
$26,200 with Army for Medical and Surgical Instruments, Equipment, and Supplies. Signed on 2002-09-08. Completion date: 2002-09-26.
MORRIS, FRANK (4502 33RD ST; small business) : $14,560 in 2 contractsin 2004
$7,480 with Army for Recreational Services. Signed on 2004-09-15. Completion date: 2004-10-01.
$7,080 with Army for Guard Services. Signed on 2004-03-15. Completion date: 2004-04-01.
MISSIONARY OBLATES OF MARY IMM (1515 HUGHES RD; small business)
$7,259 with Army for Lodging - Hotel/Motel. Signed on 2003-07-22. Completion date: 2003-08-17.
EBS CONSULTING SERVICE (2311 BAYLINE DR; small business)
$5,864 with Defense Logistics Agency for Bearings, Plain, Unmounted. Signed on 2006-01-11. Completion date: 2006-02-10.
PROFESSIONAL CONSTRUCITON, INC (2920 SPIRIT OF 76 DRIVE)
$4,821 with U.S. Army Corps of Engineers - civil program financing only for Construction of Structures and Facilities -- Other Conservation and Development Facilities. Signed on 2002-11-19. Completion date: 2002-11-14.
UNIVERSAL INDUSTRY CONSULTING (2311 BAYLINE DR; small business)
$3,840 with Defense Logistics Agency for Nuts and Washers. Signed on 2005-06-04. Completion date: 2005-09-03.
MEGAHAUS INC (2201 PINE DRIVE; small business)
$2,039 with Army for ADP Software. Taking place in GA. Signed on 2002-05-02. Completion date: 2002-05-10.
Top industries in this zip code by the number of employees in 2005:
2002 - 2018 National Fire Incident Reporting System (NFIRS) incidents
According to the data from the years 2002 - 2018 the average number of fires per year is 125. The highest number of reported fire incidents - 220 took place in 2011, and the least - 19 in 2014. The data has a dropping trend.
When looking into fire subcategories, the most reports belonged to: Outside Fires (43.0%), and Structure Fires (35.5%).
Fire incident types reported to NFIRS in Zip Code 77539
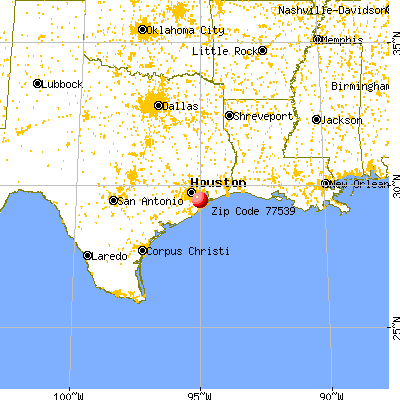


 Nearest zip codes: 77591, 77518, 77573, 77565, 77568, 77510.


 According to the data from the years 2002 - 2018 the average number of fires per year is 125. The highest number of reported fire incidents - 220 took place in 2011, and the least - 19 in 2014. The data has a dropping trend.
 When looking into fire subcategories, the most reports belonged to: Outside Fires (43.0%), and Structure Fires (35.5%).