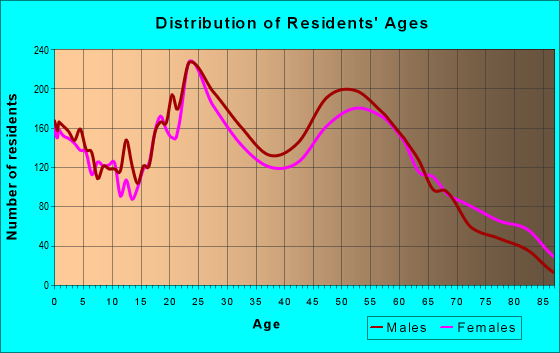
Estimated zip code population in 2022: 23,839 Zip code population in 2010: 23,043 Zip code population in 2000: 30,146
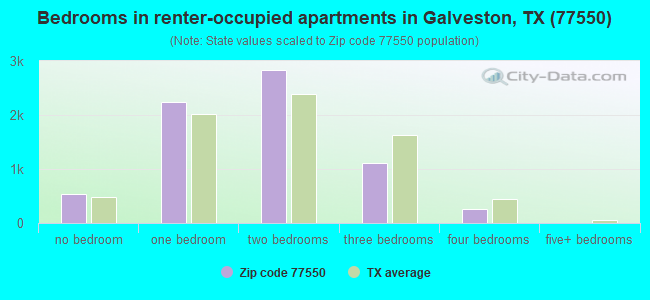
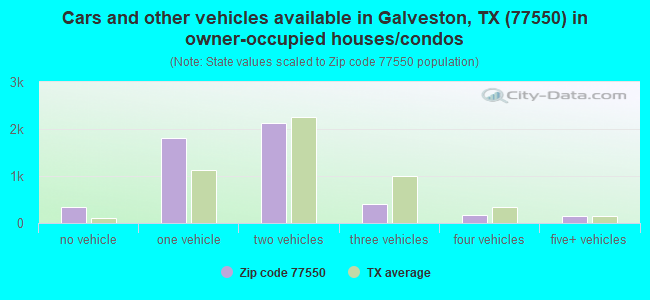
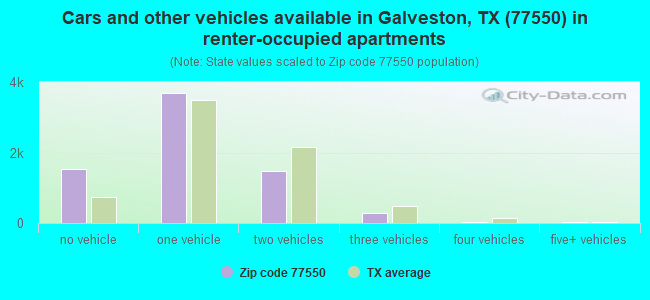
Houses and condos: 16,234 Renter-occupied apartments: 6,989
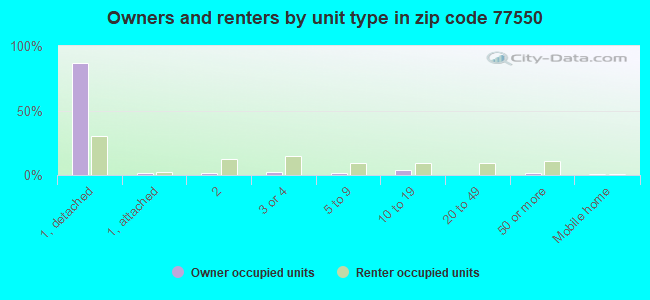
% of renters here:
59%
State:
38%
March 2022 cost of living index in zip code 77550: 98.6 (near average, U.S. average is 100)
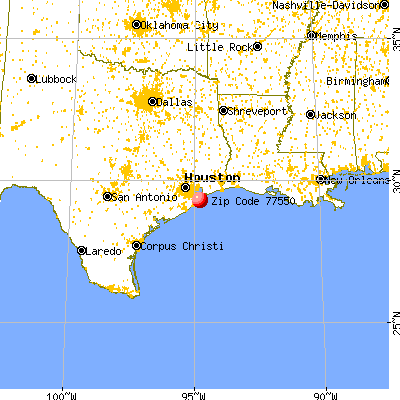
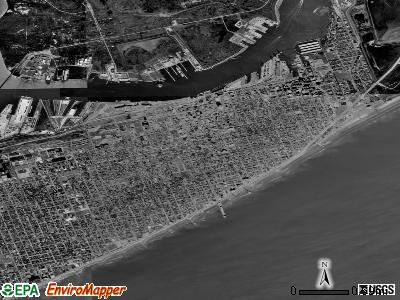
Land area: 7.5 sq. mi. Water area: 1.1 sq. mi.
Population density: 3,175 people per square mile
(average).
OSM Map
General Map
Google Map
MSN Map
OSM Map
General Map
Google Map
MSN Map
OSM Map
General Map
Google Map
MSN Map
OSM Map
General Map
Google Map
MSN Map
Please wait while loading the map...
Real estate property taxes paid for housing units in 2022:
This zip code:
1.0% ($2,737)
Texas:
1.5% ($4,050)
Median real estate property taxes paid for housing units with mortgages in 2022: $3,340 (1.0%) Median real estate property taxes paid for housing units with no mortgage in 2022: $2,240 (1.0%)
Averages for the 2020 tax year for zip code 77550, filed in 2021:
Average Adjusted Gross Income (AGI) in 2020: $59,412 (Individual Income Tax Returns)
Here:
$59,412
State:
$77,054
Salary/wage: $48,200 (reported on 80.4% of returns)
Here:
$48,200
State:
$62,766
(% of AGI for various income ranges: 1157.1% for AGIs below $25k, 3420.7% for AGIs $25k-50k, 6354.4% for AGIs $50k-75k, 9384.6% for AGIs $75k-100k, 16596.9% for AGIs $100k-200k, 85280.0% for AGIs over 200k)
Taxable interest for individuals: $2,066 (reported on 21.6% of returns)
This zip code:
$2,066
Texas:
$2,665
(% of AGI for various income ranges: 6.1% for AGIs below $25k, 15.1% for AGIs $25k-50k, 48.1% for AGIs $50k-75k, 85.1% for AGIs $75k-100k, 181.4% for AGIs $100k-200k, 1868.5% for AGIs over 200k)
Ordinary dividends: $9,314 (reported on 13.3% of returns)
Here:
$9,314
State:
$10,044
(% of AGI for various income ranges: 12.9% for AGIs below $25k, 30.5% for AGIs $25k-50k, 95.1% for AGIs $50k-75k, 183.2% for AGIs $75k-100k, 478.8% for AGIs $100k-200k, 6019.2% for AGIs over 200k)
Net capital gain/loss in AGI: +$21,911 (reported on 12.8% of returns)
Here:
+$21,911
State:
+$39,590
(% of AGI for various income ranges: 8.6% for AGIs below $25k, 23.3% for AGIs $25k-50k, 89.4% for AGIs $50k-75k, 268.6% for AGIs $75k-100k, 1008.0% for AGIs $100k-200k, 16419.2% for AGIs over 200k)
Profit/loss from business: +$8,317 (reported on 18.6% of returns)
Here:
+$8,317
State:
+$10,888
(% of AGI for various income ranges: 101.2% for AGIs below $25k, 45.0% for AGIs $25k-50k, 158.7% for AGIs $50k-75k, 133.8% for AGIs $75k-100k, 724.7% for AGIs $100k-200k, 4615.4% for AGIs over 200k)
Taxable individual retirement arrangement distribution: $28,719 (reported on 6.7% of returns)
77550:
$28,719
Texas:
$24,740
(% of AGI for various income ranges: 23.9% for AGIs below $25k, 52.9% for AGIs $25k-50k, 188.6% for AGIs $50k-75k, 557.6% for AGIs $75k-100k, 1362.0% for AGIs $100k-200k, 5636.9% for AGIs over 200k)
Self-employed (Keogh) retirement plans: $27,300 (reported on 0.2% of returns)
77550:
$27,300
Texas:
$29,298
(% of AGI for various income ranges: 420.0% for AGIs over 200k)
Total itemized deductions: $32,942 (reported on 5.1% of returns)
Here:
$32,942
State:
$40,428
(% of AGI for various income ranges: 22.5% for AGIs below $25k, 81.2% for AGIs $25k-50k, 280.6% for AGIs $50k-75k, 419.2% for AGIs $75k-100k, 787.1% for AGIs $100k-200k, 5285.4% for AGIs over 200k)
Charity contributions: $12,531 (reported on 4.1% of returns)
Here:
$12,531
State:
$18,201
(% of AGI for various income ranges: 1.5% for AGIs below $25k, 15.6% for AGIs $25k-50k, 56.2% for AGIs $50k-75k, 83.8% for AGIs $75k-100k, 227.8% for AGIs $100k-200k, 2247.7% for AGIs over 200k)
Taxes paid: $6,708 (reported on 4.7% of returns)
77550:
$6,708
State:
$7,821
(% of AGI for various income ranges: 2.5% for AGIs below $25k, 14.1% for AGIs $25k-50k, 46.6% for AGIs $50k-75k, 85.4% for AGIs $75k-100k, 177.6% for AGIs $100k-200k, 977.7% for AGIs over 200k)
Earned income credit: $2,413 (reported on 23.5% of returns)
Here:
$2,413
State:
$2,584
(% of AGI for various income ranges: 125.4% for AGIs below $25k, 68.3% for AGIs $25k-50k)
Percentage of individuals using paid preparers for their 2020 taxes: 89.0%
Here:
89%
State:
92%
(% for various income ranges: 87.8% for AGIs below $25k, 89.6% for AGIs $25k-50k, 90.8% for AGIs $50k-75k, 89.8% for AGIs $75k-100k, 89.0% for AGIs $100k-200k, 90.0% for AGIs over 200k)
Averages for the 2012 tax year for zip code 77550, filed in 2013:
Average Adjusted Gross Income (AGI) in 2012: $43,030 (Individual Income Tax Returns)
Here:
$43,030
State:
$65,384
Salary/wage: $33,721 (reported on 85.0% of returns)
Here:
$33,721
State:
$52,524
(% of AGI for various income ranges: 79.6% for AGIs below $25k, 83.0% for AGIs $25k-50k, 75.8% for AGIs $50k-75k, 72.1% for AGIs $75k-100k, 71.1% for AGIs $100k-200k, 33.6% for AGIs over 200k)
Taxable interest for individuals: $1,405 (reported on 20.4% of returns)
This zip code:
$1,405
Texas:
$2,372
(% of AGI for various income ranges: 0.6% for AGIs below $25k, 0.5% for AGIs $25k-50k, 0.7% for AGIs $50k-75k, 0.4% for AGIs $75k-100k, 0.6% for AGIs $100k-200k, 1.0% for AGIs over 200k)
Ordinary dividends: $9,593 (reported on 10.6% of returns)
Here:
$9,593
State:
$9,721
(% of AGI for various income ranges: 1.6% for AGIs below $25k, 1.3% for AGIs $25k-50k, 1.5% for AGIs $50k-75k, 1.4% for AGIs $75k-100k, 2.0% for AGIs $100k-200k, 4.9% for AGIs over 200k)
Net capital gain/loss in AGI: +$7,844 (reported on 8.4% of returns)
Here:
+$7,844
State:
+$35,319
(% of AGI for various income ranges: 0.2% for AGIs $25k-50k, 0.5% for AGIs $50k-75k, 1.3% for AGIs $75k-100k, 2.7% for AGIs $100k-200k, 3.5% for AGIs over 200k)
Profit/loss from business: +$13,376 (reported on 13.7% of returns)
Here:
+$13,376
State:
+$13,732
(% of AGI for various income ranges: 7.1% for AGIs below $25k, 1.7% for AGIs $25k-50k, 2.9% for AGIs $50k-75k, 3.8% for AGIs $75k-100k, 3.3% for AGIs $100k-200k, 6.3% for AGIs over 200k)
Taxable individual retirement arrangement distribution: $17,554 (reported on 5.7% of returns)
77550:
$17,554
Texas:
$19,511
(% of AGI for various income ranges: 1.3% for AGIs below $25k, 1.4% for AGIs $25k-50k, 2.5% for AGIs $50k-75k, 2.8% for AGIs $75k-100k, 5.4% for AGIs $100k-200k, 1.6% for AGIs over 200k)
Self-employment retirement plans: $21,333 (reported on 0.3% of returns)
77550:
$21,333
Texas:
$23,938
Total itemized deductions: $21,303 (20% of AGI, reported on 13.1% of returns)
Here:
$21,303
State:
$24,724
Here:
20.2% of AGI
State:
15.9% of AGI
(% of AGI for various income ranges: 3.5% for AGIs below $25k, 5.4% for AGIs $25k-50k, 7.8% for AGIs $50k-75k, 7.0% for AGIs $75k-100k, 8.8% for AGIs $100k-200k, 7.0% for AGIs over 200k)
Charity contributions: $5,785 (reported on 9.9% of returns)
Here:
$5,785
State:
$6,808
(% of AGI for various income ranges: 0.4% for AGIs below $25k, 0.9% for AGIs $25k-50k, 1.1% for AGIs $50k-75k, 1.3% for AGIs $75k-100k, 1.6% for AGIs $100k-200k, 2.3% for AGIs over 200k)
Taxes paid: $5,089 (reported on 12.5% of returns)
77550:
$5,089
State:
$6,921
(% of AGI for various income ranges: 0.6% for AGIs below $25k, 0.9% for AGIs $25k-50k, 1.6% for AGIs $50k-75k, 1.8% for AGIs $75k-100k, 2.4% for AGIs $100k-200k, 1.8% for AGIs over 200k)
Earned income credit: $2,422 (reported on 29.4% of returns)
Here:
$2,422
State:
$2,570
(% of AGI for various income ranges: 9.1% for AGIs below $25k, 1.1% for AGIs $25k-50k)
Percentage of individuals using paid preparers for their 2012 taxes: 44.8%
Here:
45%
State:
51%
(% for various income ranges: 42.4% for AGIs below $25k, 43.2% for AGIs $25k-50k, 48.0% for AGIs $50k-75k, 50.9% for AGIs $75k-100k, 54.9% for AGIs $100k-200k, 73.7% for AGIs over 200k)
Averages for the 2004 tax year for zip code 77550, filed in 2005:
Average Adjusted Gross Income (AGI) in 2004: $32,547 (Individual Income Tax Returns)
Here:
$32,547
State:
$47,881
Salary/wage: $28,813 (reported on 86.5% of returns)
Here:
$28,813
State:
$41,947
(% of AGI for various income ranges: 96.6% for AGIs below $10k, 84.4% for AGIs $10k-25k, 86.0% for AGIs $25k-50k, 79.0% for AGIs $50k-75k, 72.2% for AGIs $75k-100k, 59.9% for AGIs over 100k)
Taxable interest for individuals: $1,836 (reported on 27.0% of returns)
This zip code:
$1,836
Texas:
$2,255
(% of AGI for various income ranges: 2.6% for AGIs below $10k, 1.2% for AGIs $10k-25k, 1.1% for AGIs $25k-50k, 1.6% for AGIs $50k-75k, 1.4% for AGIs $75k-100k, 1.9% for AGIs over 100k)
Taxable dividends: $5,730 (reported on 11.1% of returns)
Here:
$5,730
State:
$4,261
(% of AGI for various income ranges: 1.6% for AGIs below $10k, 0.4% for AGIs $10k-25k, 0.6% for AGIs $25k-50k, 1.2% for AGIs $50k-75k, 1.1% for AGIs $75k-100k, 5.0% for AGIs over 100k)
Net capital gain/loss: +$10,104 (reported on 9.5% of returns)
Here:
+$10,104
State:
+$16,110
(% of AGI for various income ranges: -0.2% for AGIs below $10k, 0.2% for AGIs $10k-25k, 0.4% for AGIs $25k-50k, 1.6% for AGIs $50k-75k, 2.5% for AGIs $75k-100k, 8.5% for AGIs over 100k)
Profit/loss from business: +$9,568 (reported on 10.4% of returns)
Here:
+$9,568
State:
+$11,013
(% of AGI for various income ranges: 6.2% for AGIs below $10k, 3.3% for AGIs $10k-25k, 1.8% for AGIs $25k-50k, 2.2% for AGIs $50k-75k, 2.3% for AGIs $75k-100k, 4.4% for AGIs over 100k)
IRA payment deduction: $3,076 (reported on 1.1% of returns)
77550:
$3,076
Texas:
$3,120
(% of AGI for various income ranges: 0.1% for AGIs $10k-25k, 0.1% for AGIs $25k-50k, 0.2% for AGIs $50k-75k, 0.1% for AGIs over 100k)
Self-employed pension: $12,091 (reported on 0.2% of returns)
Here:
$12,091
Texas:
$16,401
Total itemized deductions: $17,519 (19% of AGI, reported on 12.3% of returns)
Here:
$17,519
State:
$19,631
Here:
18.8% of AGI
State:
18.9% of AGI
(% of AGI for various income ranges: 3.6% for AGIs below $10k, 2.9% for AGIs $10k-25k, 6.8% for AGIs $25k-50k, 7.5% for AGIs $50k-75k, 9.1% for AGIs $75k-100k, 8.0% for AGIs over 100k)
Charity contributions deductions: $4,944 (6% of AGI, reported on 9.9% of returns)
Here:
$4,944
State:
$4,753
Here:
5.9% of AGI
State:
4.2% of AGI
(% of AGI for various income ranges: 0.3% for AGIs below $10k, 0.4% for AGIs $10k-25k, 0.8% for AGIs $25k-50k, 1.5% for AGIs $50k-75k, 2.0% for AGIs $75k-100k, 2.9% for AGIs over 100k)
Total tax: $5,911 (reported on 62.2% of returns)
77550:
$5,911
State:
$9,058
(% of AGI for various income ranges: 2.3% for AGIs below $10k, 3.2% for AGIs $10k-25k, 7.0% for AGIs $25k-50k, 11.1% for AGIs $50k-75k, 12.8% for AGIs $75k-100k, 21.5% for AGIs over 100k)
Earned income credit: $1,941 (reported on 33.0% of returns)
Here:
$1,941
State:
$2,024
Percentage of individuals using paid preparers for their 2004 taxes: 54.7%
Here:
55%
State:
57%
(% for various income ranges: 53.2% for AGIs below $10k, 60.1% for AGIs $10k-25k, 49.6% for AGIs $25k-50k, 48.2% for AGIs $50k-75k, 51.4% for AGIs $75k-100k, 66.6% for AGIs over 100k)
Likely homosexual households (counted as self-reported same-sex unmarried-partner households)
Lesbian couples: 0.2% of all households
Gay men: 0.6% of all households
Household received Food Stamps/SNAP in the past 12 months: 1,935 Household did not receive Food Stamps/SNAP in the past 12 months: 10,012
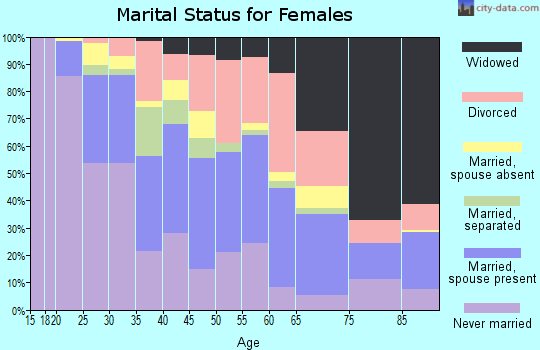
Women who had a birth in the past 12 months: 284 (166 now married, 116 unmarried) Women who did not have a birth in the past 12 months: 5,709 (1,693 now married, 4,042 unmarried)
Housing units in zip code 77550 with a mortgage: 2,312 (65 second mortgage, 10 home equity loan, 41 both second mortgage and home equity loan) Houses without a mortgage: 73
Median monthly owner costs for units with a mortgage: $1,856 Median monthly owner costs for units without a mortgage: $655
Residents with income below the poverty level in 2022:
This zip code:
23.6%
Whole state:
14.0%
Residents with income below 50% of the poverty level in 2022:
This zip code:
9.0%
Whole state:
7.4%
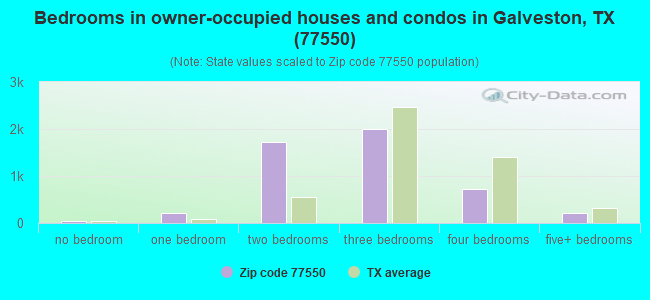
Median number of rooms in houses and condos:
Here:
5.9
State:
6.3
Median number of rooms in apartments:
Here:
4.0
State:
4.0
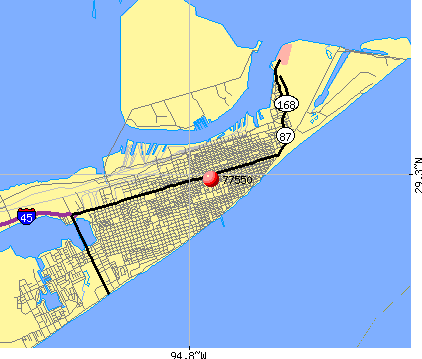
Notable locations in this zip code not listed on our city pages
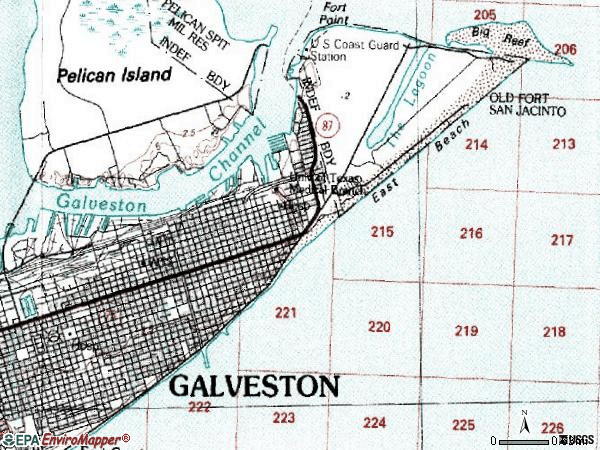
Notable locations in zip code 77550: Childrens Home (A), Elevator B (B), Old Fort San Jacinto (C), Pier Ten (D), Pier Eleven (E), Pier Twelve (F), Pier Fourteen (G), Pier Fifteen (H), Pier Eighteen (I), Pier Twentyone (J), Pier Twentytwo (K), Pier Twentythree (L), Pier Twentysix (M), Pier Twentyseven (N), Moody Civic Center (O), Union Station (P), Galveston Yacht Basin Marina (Q), Texas Cruise Ship Terminal on Galveston Island (R), The Strand Historic District (S), Silk Stocking Residential Historic District (T). Display/hide their locations on the map
Churches in zip code 77550 include: Gethsemane Missionary Baptist Church (A), University Baptist Church (B), Saint Johns Baptist Church (C), Progressive Missionary Baptist Church (D), Mount Olive Baptist Church (E), First Lutheran Church (F), Queen of Peace Church (G), Carter Temple Church (H), Our Lady of Guadalupe Church (I). Display/hide their locations on the map
Parks in zip code 77550 include: Wright Cuney Park (1), Texas Heroes Monument (2), Adoue Park (3), Lasker Park (4), Kempner Park (5), Menard Park (6), San Jacinto Park (7), Sheppard Park (8), Big Reef Nature Park (9). Display/hide their locations on the map
Tourist attractions (not listed on the city page) : Beach Break (Recreation Areas; 2402 Avenue Q 1/2) (1), Bungee Fun (Amusement & Theme Parks; 9110 Seawall Boulevard) (2). Display/hide their approximate locations on the map
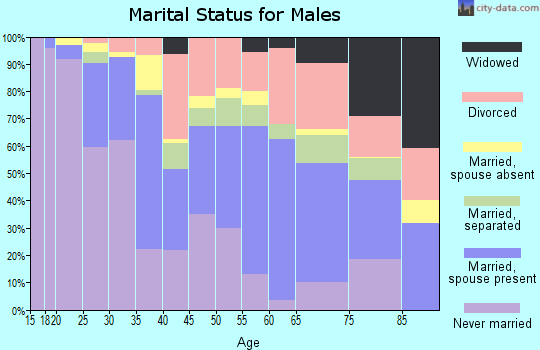
1,411 married couples with children.
1,402 single-parent households (257 men, 1,145 women).
74.9% of residents of 77550 zip code speak English at home.
18.6% of residents speak Spanish at home (67% very well, 8% well, 18% not well, 7% not at all).
2.9% of residents speak other Indo-European language at home (91% very well, 9% well).
3.0% of residents speak Asian or Pacific Island language at home (70% very well, 24% well, 6% not well).
1.0% of residents speak other language at home (82% very well, 18% well).
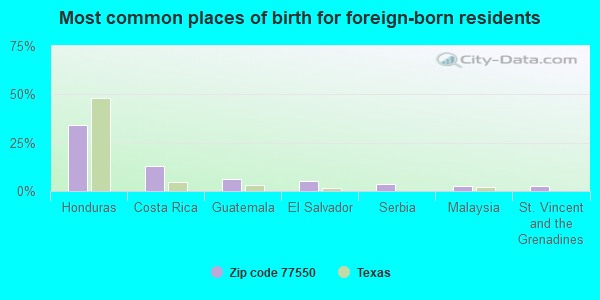
Foreign born population: 3,063 (12.9%) (44.4% of them are naturalized citizens)
Facilities with environmental interests located in this zip code:
ALAMO EL (5200 AVE N in GALVESTON, TX)
(National Center for Education Statistics) - STATE ID-084902101 Organizations: GALVESTON ISD (SCHOOL DISTRICT)
AUSTIN MIDDLE (1514 AVE N in GALVESTON, TX)
(National Center for Education Statistics) - STATE ID-084902041 Organizations: GALVESTON ISD (SCHOOL DISTRICT)
BALL H S (4115 AVE O in GALVESTON, TX)
(National Center for Education Statistics) - STATE ID-084902001 Organizations: GALVESTON ISD (SCHOOL DISTRICT)
AMERICAN PRINTING COMPANY (4401 AVE P in GALVESTON, TX)
(Resource Conservation and Recovery Act (tracking hazardous waste))
Housing units lacking complete plumbing facilities: 3.0% Housing units lacking complete kitchen facilities: 4.2%
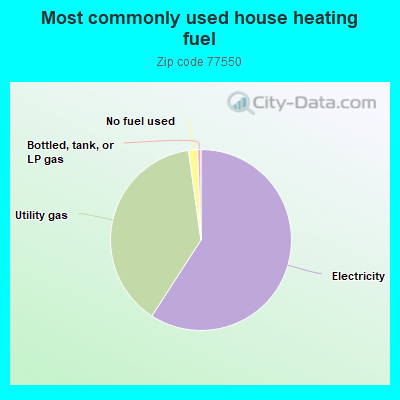
58.9%Electricity
38.5%Utility gas
1.6%No fuel used
0.6%Bottled, tank, or LP gas
Population in 1990: 31,879.
Place of birth for U.S.-born residents:
This state: 14,705
Northeast: 1,156
Midwest: 1,394
South: 1,962
West: 933
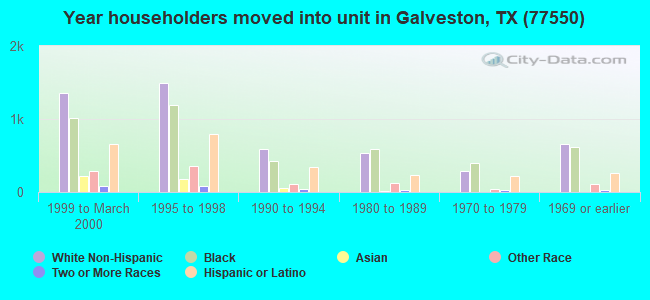
51% of the 77550 zip code residents lived in the same house 5 years ago. Out of people who lived in different houses, 65% lived in this county. Out of people who lived in different counties, 50% lived in Texas.
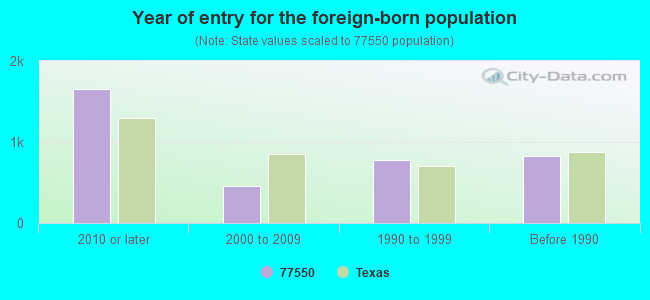
80% of the 77550 zip code residents lived in the same house 1 year ago. Out of people who lived in different houses, 42% moved from this county. Out of people who lived in different houses, 44% moved from different county within same state. Out of people who lived in different houses, 10% moved from different state. Out of people who lived in different houses, 3% moved from abroad.
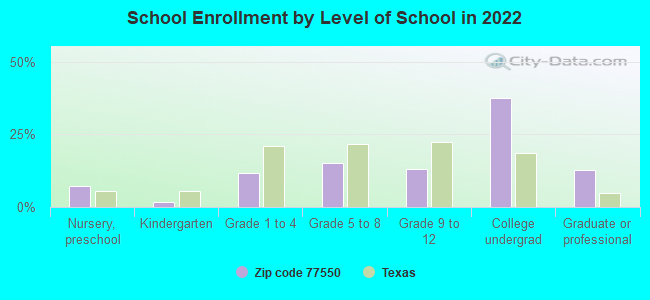
Private vs. public school enrollment:
Students in private schools in grades 1 to 8 (elementary and middle school): 143
Here:
10.2%
Texas:
8.8%
Students in private schools in grades 9 to 12 (high school): 52
Here:
7.6%
Texas:
8.0%
Students in private undergraduate colleges: 115
Here:
5.9%
Texas:
16.2%
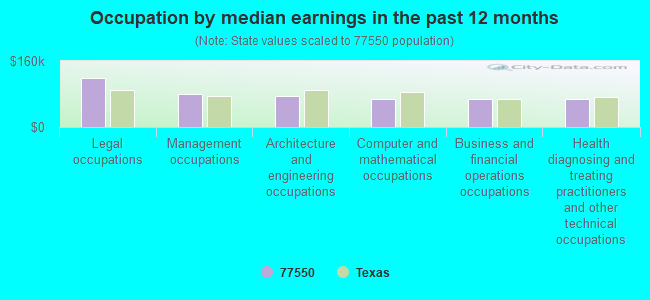
Occupation by median earnings in the past 12 months ($)
118,464Legal occupations
81,006Management occupations
76,022Architecture and engineering occupations
69,007Computer and mathematical occupations
68,272Business and financial operations occupations
67,848Health diagnosing and treating practitioners and other technical occupations
Companies with federal contracts located in this zip code (GALVESTON, TX):
UNIVERSITY OF TEXAS MEDICAL BR (ADMINSTRATION BLDG) : $1,031,000 in 12 contractsfrom 1999 to 2002
Contracts for Space Science and Applications -- Applied Research and Exploratory Development (R&D) by NASA Signed by year:2000: $159,000; 2001: $401,000; 2002: $436,000; 2003: $0; 2004: $0; 2005: $0; 2006: $0.
Biggest contracts:
$177,000 with NASA for Space Science and Applications -- Applied Research and Exploratory Development (R&D). Signed on 2002-08-15. Completion date: 2004-12-15.
$126,000, same as above.Signed on 2001-05-15. Completion date: 2004-12-15.
$100,000, same as above.Signed on 2001-10-15. Completion date: 2004-12-15.
$100,000, same as above.Signed on 2002-06-15. Completion date: 2004-12-15.
ACTION PERSONNEL INC (1721 23RD STREET; small business) : $190,885 in 21 contractsfrom 2003 to 2005
Contracts for Small Craft, Other Administrative Support Services, Other Management Support Services, Miscellaneous Items, and moreby U.S. Army Corps of Engineers - civil program financing only, Army Signed by year:2000: $0; 2001: $0; 2002: $0; 2003: $64,986; 2004: $94,165; 2005: $31,734; 2006: $0.
Biggest contracts:
$32,986 with U.S. Army Corps of Engineers - civil program financing only for Small Craft. Signed on 2003-08-15. Completion date: 2004-01-15.
$22,848 with U.S. Army Corps of Engineers - civil program financing only for Other Administrative Support Services. Signed on 2004-03-11. Completion date: 2004-02-04.
$22,848 with Army for Other Administrative Support Services. Signed on 2004-03-11. Completion date: 2004-02-04.
$21,000 with U.S. Army Corps of Engineers - civil program financing only for Other Management Support Services. Signed on 2003-02-21. Completion date: 2003-09-25.
EIGHTEEN SEVENTY STRAND CORP (2024 SEAWALL BLVD) : $30,233 in 8 contractsfrom 2005 to 2006
Contracts for Lodging - Hotel/Motel, , Training/Curriculum Development by Army, U.S. Army Corps of Engineers - civil program financing only, NASA Signed by year:2000: $0; 2001: $0; 2002: $0; 2003: $0; 2004: $0; 2005: $22,679; 2006: $7,554.
Biggest contracts:
$19,179 with Army for Lodging - Hotel/Motel. Signed on 2005-11-09. Completion date: 2005-11-20.
$3,500, same as above.Signed on 2006-03-23. Completion date: 2006-04-28.
$3,500 with U.S. Army Corps of Engineers - civil program financing only for Lodging - Hotel/Motel. Signed on 2005-09-09. Completion date: 2005-09-30.
$3,500 with Army for Lodging - Hotel/Motel. Signed on 2005-09-09. Completion date: 2005-09-30.
EIGHTEEN SEVENTY STRAND GROUP (2300 SHIPS MECHANIC ROW)
$8,113 with Army for Lodging - Hotel/Motel. Signed on 2002-02-07. Completion date: 2002-02-17.
ELECTRICAL TROUBLESHOOTERS INC (112 19TH STREET; small business) : $5,458 in 2 contractsin 2002
$5,458 with U.S. Army Corps of Engineers - civil program financing only for Electric Services. Signed on 2002-10-24. Completion date: 2003-05-30.
$0, same as above.Signed on 2002-10-24. Completion date: 2003-05-30.
FAMILY SERVICE CENTER OF GALVE (2128 AVE P; small business) : $4,150 in 4 contractsin 2003
$2,250 with Army for Other Professional Services. Signed on 2003-11-26. Completion date: 2003-09-26.
$1,000 with U.S. Army Corps of Engineers - civil program financing only for Other Professional Services. Signed on 2003-03-18. Completion date: 2003-09-25.
$900, same as above.Signed on 2003-07-30. Completion date: 2003-09-25.
$0 with Army for Other Professional Services. Signed on 2003-11-26. Completion date: 2003-09-26.
BOARD OF TRUSTEES GALVESTON WH (123 ROSENBERG ST 8TH FL)
$4,140 with Navy for Non-nuclear Ship Repair (East) Ship repair (including overhauls and conversions) performed on non-nuclear propelled and nonpropelled ships east of the 108th meridian. Signed on 2002-09-23. Completion date: 2002-09-10.
Top industries in this zip code by the number of employees in 2005:
Finance and Insurance: Direct Life Insurance Carriers (over 1000 employees: 1 establishment)
Health Care and Social Assistance: General Medical and Surgical Hospitals (over 1000: 1)
2002 - 2018 National Fire Incident Reporting System (NFIRS) incidents
According to the data from the years 2002 - 2018 the average number of fire incidents per year is 264. The highest number of fires - 472 took place in 2008, and the least - 109 in 2014. The data has a decreasing trend.
When looking into fire subcategories, the most reports belonged to: Outside Fires (41.9%), and Structure Fires (39.3%).
Fire incident types reported to NFIRS in Zip Code 77550


 Nearest zip codes: 77551, 77650, 77554, 77590, 77568, 77591.
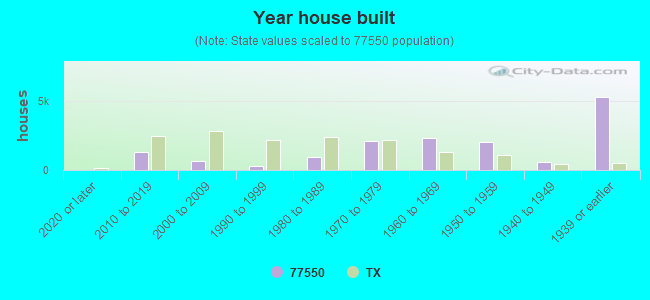


 According to the data from the years 2002 - 2018 the average number of fire incidents per year is 264. The highest number of fires - 472 took place in 2008, and the least - 109 in 2014. The data has a decreasing trend.
 When looking into fire subcategories, the most reports belonged to: Outside Fires (41.9%), and Structure Fires (39.3%).