Estimated zip code population in 2022: 2,691 Zip code population in 2010: 2,681 Zip code population in 2000: 2,627
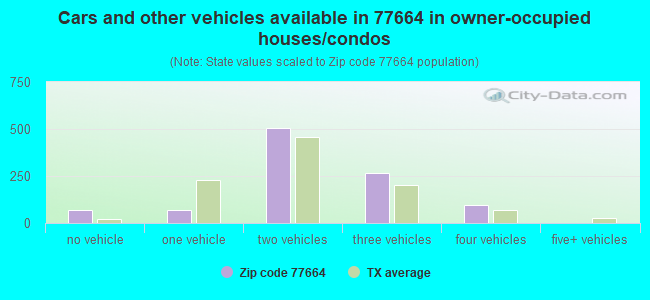
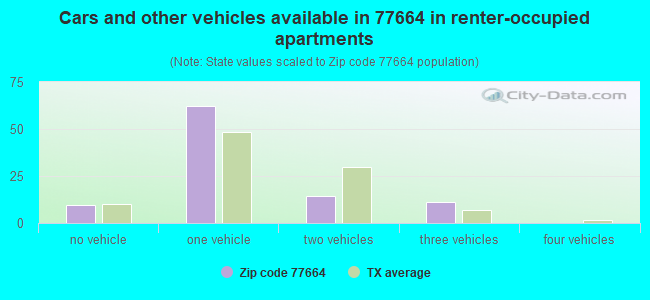
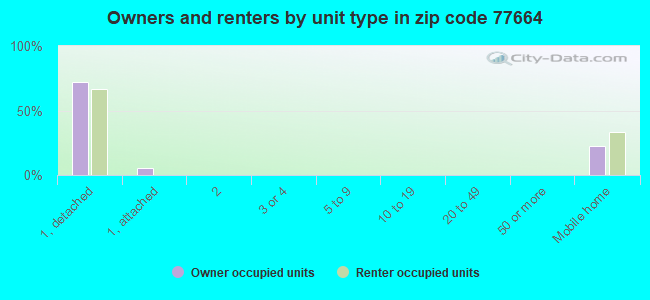
Houses and condos: 1,394 Renter-occupied apartments: 97
% of renters here:
9%
State:
38%
March 2022 cost of living index in zip code 77664: 79.4 (low, U.S. average is 100)
Land area: 162.2 sq. mi. Water area: 0.2 sq. mi.
Population density: 17 people per square mile
(very low).
OSM Map
General Map
Google Map
MSN Map
OSM Map
General Map
Google Map
MSN Map
OSM Map
General Map
Google Map
MSN Map
OSM Map
General Map
Google Map
MSN Map
Please wait while loading the map...
Real estate property taxes paid for housing units in 2022:
This zip code:
0.8% ($1,181)
Texas:
1.5% ($4,050)
Median real estate property taxes paid for housing units with mortgages in 2022: $1,563 (0.9%) Median real estate property taxes paid for housing units with no mortgage in 2022: $824 (0.6%)
Business Search- 14 Million verified businesses
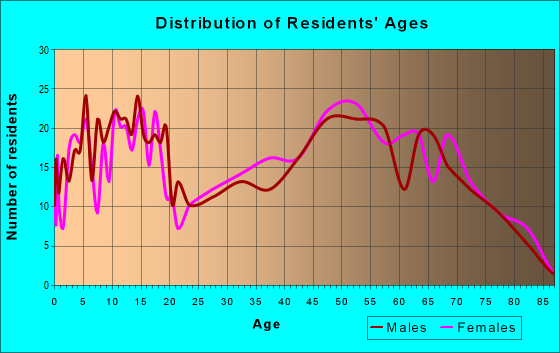
Males: 1,567
(58.2%)
Females: 1,124
(41.8%)
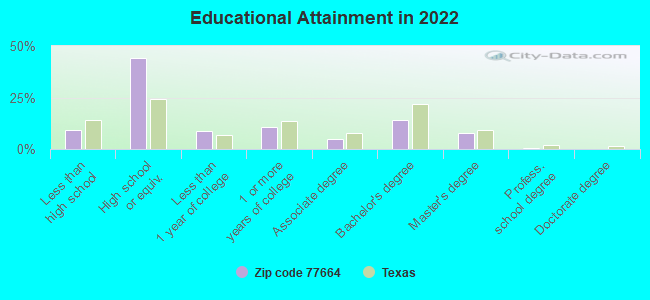
For population 25 years and over in 77664:
High school or higher: 90.7%
Bachelor's degree or higher: 22.2%
Graduate or professional degree: 8.1%
Unemployed: 11.7%
Mean travel time to work (commute): 36.7 minutes
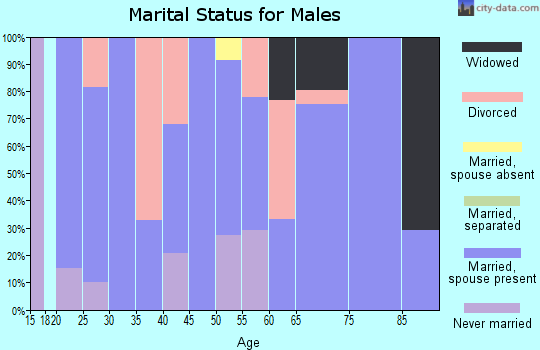
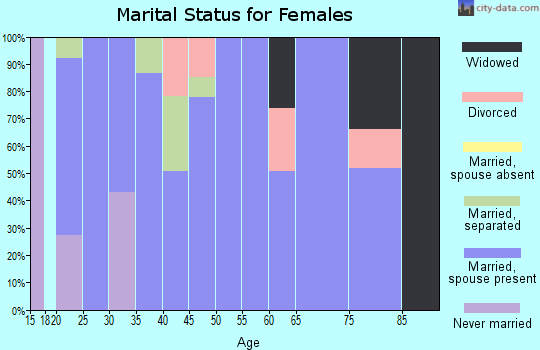
For population 15 years and over in 77664:
Never married: 25.1%
Now married: 62.9%
Separated: 0.9%
Widowed: 4.7%
Divorced: 6.4%
Zip code 77664 compared to state average:
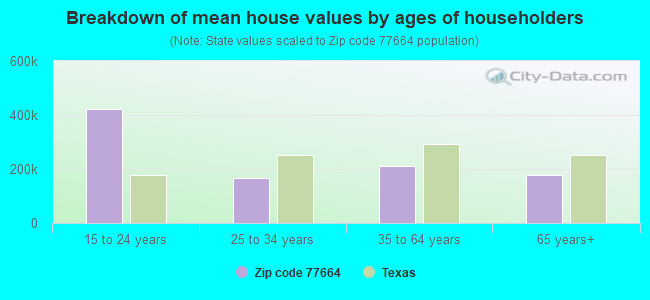
Median house value below state average.
Unemployed percentage above state average.
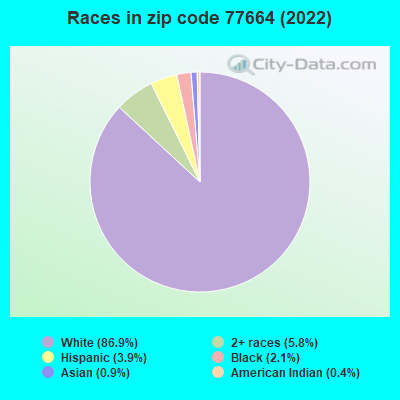
Black race population percentage significantly below state average.
Hispanic race population percentage significantly below state average.
Median age significantly above state average.
Foreign-born population percentage significantly below state average.
Renting percentage significantly below state average.
Length of stay since moving in significantly above state average.
Averages for the 2020 tax year for zip code 77664, filed in 2021:
Average Adjusted Gross Income (AGI) in 2020: $56,813 (Individual Income Tax Returns)
Here:
$56,813
State:
$77,054
Salary/wage: $54,705 (reported on 80.0% of returns)
Here:
$54,705
State:
$62,766
(% of AGI for various income ranges: 985.5% for AGIs below $25k, 3346.5% for AGIs $25k-50k, 5712.1% for AGIs $50k-75k, 8590.8% for AGIs $75k-100k, 13206.7% for AGIs $100k-200k)
Taxable interest for individuals: $515 (reported on 25.4% of returns)
This zip code:
$515
Texas:
$2,665
(% of AGI for various income ranges: 7.0% for AGIs below $25k, 6.1% for AGIs $25k-50k, 15.3% for AGIs $50k-75k, 23.3% for AGIs $75k-100k, 50.7% for AGIs $100k-200k)
Ordinary dividends: $2,200 (reported on 9.2% of returns)
Here:
$2,200
State:
$10,044
(% of AGI for various income ranges: 19.7% for AGIs below $25k, 31.6% for AGIs $50k-75k, 34.2% for AGIs $75k-100k, 65.3% for AGIs $100k-200k)
Net capital gain/loss in AGI: +$4,583 (reported on 9.2% of returns)
Here:
+$4,583
State:
+$39,590
(% of AGI for various income ranges: 10.3% for AGIs below $25k, 18.3% for AGIs $25k-50k, 37.5% for AGIs $75k-100k, 286.0% for AGIs $100k-200k)
Profit/loss from business: +$5,152 (reported on 16.2% of returns)
Here:
+$5,152
State:
+$10,888
(% of AGI for various income ranges: 121.8% for AGIs below $25k, 81.7% for AGIs $25k-50k, 72.6% for AGIs $50k-75k, 269.3% for AGIs $100k-200k)
Taxable individual retirement arrangement distribution: $21,410 (reported on 7.7% of returns)
77664:
$21,410
Texas:
$24,740
(% of AGI for various income ranges: 55.8% for AGIs below $25k, 136.5% for AGIs $25k-50k, 248.9% for AGIs $50k-75k, 975.0% for AGIs $75k-100k)
Total itemized deductions: $30,875 (reported on 3.1% of returns)
Here:
$30,875
State:
$40,428
(% of AGI for various income ranges: 650.0% for AGIs $50k-75k)
Charity contributions: $10,850 (reported on 1.5% of returns)
Here:
$10,850
State:
$18,201
(% of AGI for various income ranges: 94.3% for AGIs $25k-50k)
Taxes paid: $4,800 (reported on 2.3% of returns)
77664:
$4,800
State:
$7,821
(% of AGI for various income ranges: 75.8% for AGIs $50k-75k)
Earned income credit: $2,417 (reported on 18.5% of returns)
Here:
$2,417
State:
$2,584
(% of AGI for various income ranges: 118.2% for AGIs below $25k, 82.6% for AGIs $25k-50k)
Percentage of individuals using paid preparers for their 2020 taxes: 93.8%
Here:
94%
State:
92%
(% for various income ranges: 90.7% for AGIs below $25k, 96.4% for AGIs $25k-50k, 95.7% for AGIs $50k-75k, 93.3% for AGIs $75k-100k, 94.4% for AGIs $100k-200k, 100.0% for AGIs over 200k)
Averages for the 2012 tax year for zip code 77664, filed in 2013:
Average Adjusted Gross Income (AGI) in 2012: $49,651 (Individual Income Tax Returns)
Here:
$49,651
State:
$65,384
Salary/wage: $47,813 (reported on 82.6% of returns)
Here:
$47,813
State:
$52,524
(% of AGI for various income ranges: 60.6% for AGIs below $25k, 76.9% for AGIs $25k-50k, 84.4% for AGIs $50k-75k, 87.5% for AGIs $75k-100k, 78.6% for AGIs $100k-200k)
Taxable interest for individuals: $514 (reported on 26.6% of returns)
This zip code:
$514
Texas:
$2,372
(% of AGI for various income ranges: 0.8% for AGIs below $25k, 0.4% for AGIs $25k-50k, 0.2% for AGIs $50k-75k, 0.2% for AGIs $100k-200k)
Ordinary dividends: $1,464 (reported on 10.1% of returns)
Here:
$1,464
State:
$9,721
(% of AGI for various income ranges: 1.1% for AGIs below $25k, 0.4% for AGIs $25k-50k, 0.4% for AGIs $50k-75k, 0.1% for AGIs $100k-200k)
Net capital gain/loss in AGI: +$1,062 (reported on 7.3% of returns)
Here:
+$1,062
State:
+$35,319
(% of AGI for various income ranges: 0.2% for AGIs $25k-50k, 0.4% for AGIs $100k-200k)
Profit/loss from business: +$6,861 (reported on 16.5% of returns)
Here:
+$6,861
State:
+$13,732
(% of AGI for various income ranges: 8.0% for AGIs below $25k, 1.4% for AGIs $25k-50k, 1.0% for AGIs $50k-75k, 2.5% for AGIs $75k-100k, 1.8% for AGIs $100k-200k)
Taxable individual retirement arrangement distribution: $15,350 (reported on 9.2% of returns)
77664:
$15,350
Texas:
$19,511
(% of AGI for various income ranges: 3.9% for AGIs below $25k, 6.9% for AGIs $25k-50k, 5.9% for AGIs $75k-100k)
Total itemized deductions: $22,294 (26% of AGI, reported on 16.5% of returns)
Here:
$22,294
State:
$24,724
Here:
26.1% of AGI
State:
15.9% of AGI
(% of AGI for various income ranges: 9.3% for AGIs $25k-50k, 7.1% for AGIs $50k-75k, 8.1% for AGIs $75k-100k, 7.9% for AGIs $100k-200k)
Charity contributions: $6,958 (reported on 11.0% of returns)
Here:
$6,958
State:
$6,808
(% of AGI for various income ranges: 1.8% for AGIs $25k-50k, 1.3% for AGIs $50k-75k, 1.5% for AGIs $75k-100k, 2.0% for AGIs $100k-200k)
Taxes paid: $3,194 (reported on 16.5% of returns)
77664:
$3,194
State:
$6,921
(% of AGI for various income ranges: 0.9% for AGIs $25k-50k, 1.0% for AGIs $50k-75k, 1.2% for AGIs $75k-100k, 1.4% for AGIs $100k-200k)
Earned income credit: $2,491 (reported on 20.2% of returns)
Here:
$2,491
State:
$2,570
(% of AGI for various income ranges: 9.1% for AGIs below $25k, 1.1% for AGIs $25k-50k)
Percentage of individuals using paid preparers for their 2012 taxes: 59.6%
Here:
60%
State:
51%
(% for various income ranges: 51.3% for AGIs below $25k, 55.2% for AGIs $25k-50k, 68.8% for AGIs $50k-75k, 66.7% for AGIs $75k-100k, 76.9% for AGIs $100k-200k)
Averages for the 2004 tax year for zip code 77664, filed in 2005:
Average Adjusted Gross Income (AGI) in 2004: $34,219 (Individual Income Tax Returns)
Here:
$34,219
State:
$47,881
Salary/wage: $34,286 (reported on 81.1% of returns)
Here:
$34,286
State:
$41,947
(% of AGI for various income ranges: 131.8% for AGIs below $10k, 78.1% for AGIs $10k-25k, 83.8% for AGIs $25k-50k, 84.6% for AGIs $50k-75k, 74.2% for AGIs $75k-100k, 72.6% for AGIs over 100k)
Taxable interest for individuals: $1,185 (reported on 35.5% of returns)
This zip code:
$1,185
Texas:
$2,255
(% of AGI for various income ranges: 8.3% for AGIs below $10k, 2.7% for AGIs $10k-25k, 0.7% for AGIs $25k-50k, 0.7% for AGIs $50k-75k, 1.2% for AGIs $75k-100k, 0.7% for AGIs over 100k)
Taxable dividends: $1,121 (reported on 12.6% of returns)
Here:
$1,121
State:
$4,261
(% of AGI for various income ranges: 3.2% for AGIs below $10k, 0.6% for AGIs $10k-25k, 0.0% for AGIs $25k-50k, 0.7% for AGIs $50k-75k, 0.3% for AGIs $75k-100k, 0.2% for AGIs over 100k)
Net capital gain/loss: +$3,949 (reported on 10.0% of returns)
Here:
+$3,949
State:
+$16,110
(% of AGI for various income ranges: -5.1% for AGIs below $10k, -0.3% for AGIs $10k-25k, 0.1% for AGIs $25k-50k, -0.1% for AGIs $50k-75k, 0.2% for AGIs $75k-100k, 10.8% for AGIs over 100k)
Profit/loss from business: +$2,177 (reported on 16.6% of returns)
Here:
+$2,177
State:
+$11,013
(% of AGI for various income ranges: 13.2% for AGIs below $10k, 0.3% for AGIs $10k-25k, 3.2% for AGIs $25k-50k, -1.0% for AGIs $50k-75k, 0.2% for AGIs $75k-100k)
Total itemized deductions: $16,363 (27% of AGI, reported on 15.9% of returns)
Here:
$16,363
State:
$19,631
Here:
27.3% of AGI
State:
18.9% of AGI
(% of AGI for various income ranges: 6.3% for AGIs $10k-25k, 7.5% for AGIs $25k-50k, 8.5% for AGIs $50k-75k, 8.3% for AGIs $75k-100k, 7.6% for AGIs over 100k)
Charity contributions deductions: $4,426 (7% of AGI, reported on 13.1% of returns)
Here:
$4,426
State:
$4,753
Here:
7.1% of AGI
State:
4.2% of AGI
(% of AGI for various income ranges: 1.3% for AGIs $10k-25k, 1.3% for AGIs $25k-50k, 1.5% for AGIs $50k-75k, 2.6% for AGIs $75k-100k, 2.3% for AGIs over 100k)
Total tax: $3,881 (reported on 68.7% of returns)
77664:
$3,881
State:
$9,058
(% of AGI for various income ranges: 3.4% for AGIs below $10k, 2.9% for AGIs $10k-25k, 5.3% for AGIs $25k-50k, 8.1% for AGIs $50k-75k, 10.7% for AGIs $75k-100k, 14.9% for AGIs over 100k)
Earned income credit: $1,847 (reported on 21.2% of returns)
Here:
$1,847
State:
$2,024
Percentage of individuals using paid preparers for their 2004 taxes: 60.1%
Here:
60%
State:
57%
(% for various income ranges: 53.1% for AGIs below $10k, 59.8% for AGIs $10k-25k, 62.4% for AGIs $25k-50k, 60.6% for AGIs $50k-75k, 64.8% for AGIs $75k-100k, 76.7% for AGIs over 100k)
Household received Food Stamps/SNAP in the past 12 months: 72 Household did not receive Food Stamps/SNAP in the past 12 months: 1,034
Women who had a birth in the past 12 months: 99 (47 now married, 50 unmarried) Women who did not have a birth in the past 12 months: 340 (156 now married, 183 unmarried)
Housing units in zip code 77664 with a mortgage: 433 (8 second mortgage, 9 both second mortgage and home equity loan) Houses without a mortgage: 30
Median monthly owner costs for units with a mortgage: $1,190 Median monthly owner costs for units without a mortgage: $521
Residents with income below the poverty level in 2022:
This zip code:
10.4%
Whole state:
14.0%
Residents with income below 50% of the poverty level in 2022:
This zip code:
5.5%
Whole state:
7.4%
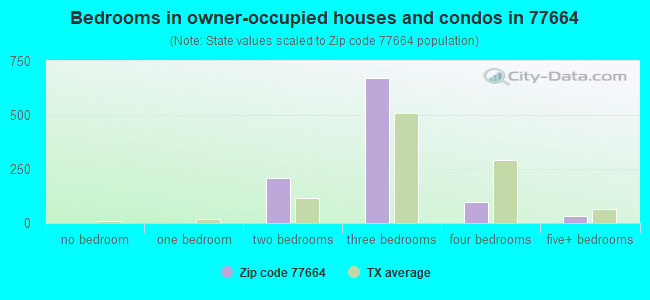
Median number of rooms in houses and condos:
Here:
5.6
State:
6.3
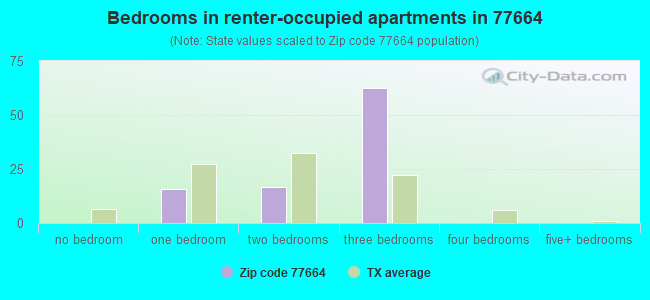
Median number of rooms in apartments:
Here:
5.6
State:
4.0
Notable locations in this zip code not listed on our city pages
Churches in zip code 77664 include: Pineville Church (A), Fellowship Church (B), Hebron Church (C), Hicksbaugh Church (D), Midway Church (E), Mill Creek Church (F), New Hope Church (G). Display/hide their locations on the map
Cemeteries: Richardson Cemetery (1), Allison Cemetery (2), Justis Cemetery (3), Warren Cemetery (4), Hester Cemetery (5), Fellowship Cemetery (6), Williams Cemetery (7). Display/hide their locations on the map
Streams, rivers, and creeks: Black Creek (A), Big Cypress Creek (B), Jacks Creek (C), Thouching Creek (D), Magnus Branch (E), Horsepen Creek (F). Display/hide their locations on the map
Size of family households: 474 2-persons, 135 3-persons, 103 4-persons, 49 5-persons, 61 6-persons
Size of nonfamily households: 227 1-person, 49 2-persons, 9 3-persons
293 married couples with children.
85 single-parent households (46 men, 39 women).
96.9% of residents of 77664 zip code speak English at home.
1.2% of residents speak Spanish at home (93% very well, 7% not well).
1.3% of residents speak other Indo-European language at home (100% very well).
1.1% of residents speak Asian or Pacific Island language at home (100% very well).
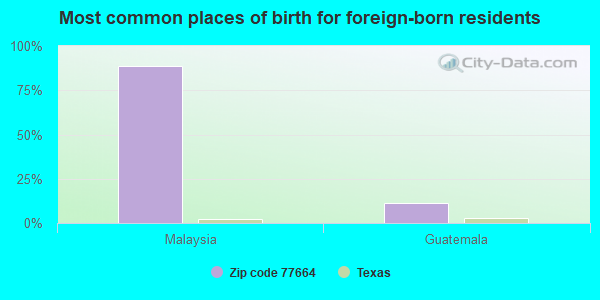
Foreign born population: 29 (1.1%) (89.9% of them are naturalized citizens)
This zip code:
1.1%
Whole state:
17.2%
89%Malaysia
11%Guatemala
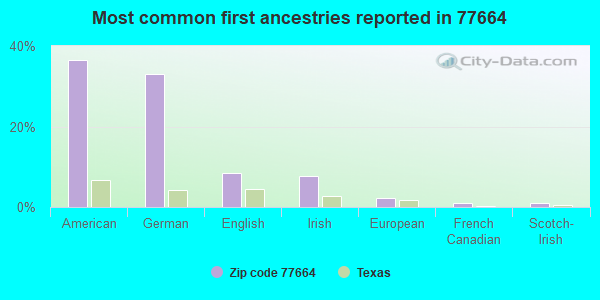
36%American
33%German
9%English
8%Irish
2%European
1%French Canadian
1%Scotch-Irish
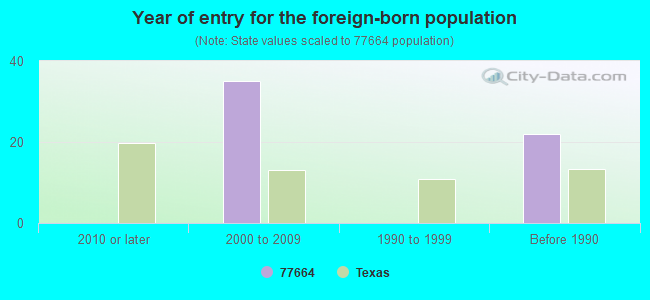
Year of entry for the foreign-born population
02010 or later
352000 to 2009
01990 to 1999
22Before 1990
Facilities with environmental interests located in this zip code:
ANNAS TIRE SHOP (RT 2 BOX 1080 in WARREN, TX)
Conditionally Exempt Small Quantity Generators, less than 100 kg/month of hazardous waste (Resource Conservation and Recovery Act (tracking hazardous waste)) - notification Organizations: DEWEY COKE (CONTACT/OWNER)
Housing units lacking complete plumbing facilities: 4.7% Housing units lacking complete kitchen facilities: 5.9%
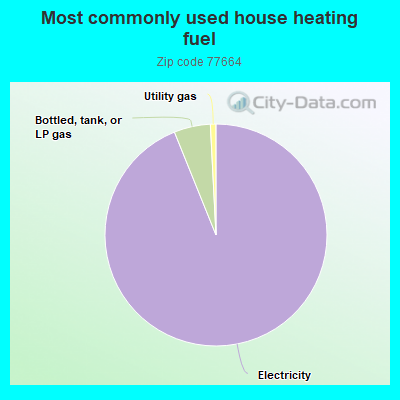
94.0%Electricity
5.3%Bottled, tank, or LP gas
0.8%Utility gas
Population in 1990: 2,465. Population change in the 1990s: +162 (+6.6%).
Place of birth for U.S.-born residents:
This state: 2,243
Midwest: 55
South: 291
West: 10
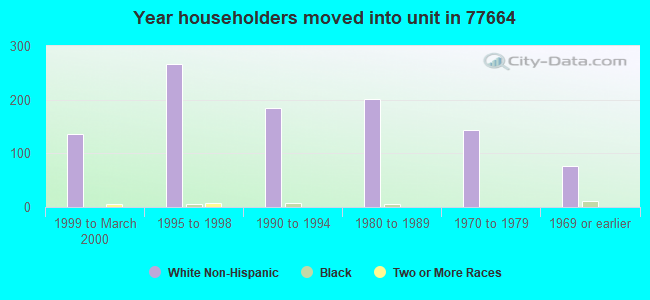
68% of the 77664 zip code residents lived in the same house 5 years ago. Out of people who lived in different houses, 42% lived in this county. Out of people who lived in different counties, 50% lived in Texas.
86% of the 77664 zip code residents lived in the same house 1 year ago. Out of people who lived in different houses, 13% moved from this county. Out of people who lived in different houses, 89% moved from different county within same state.
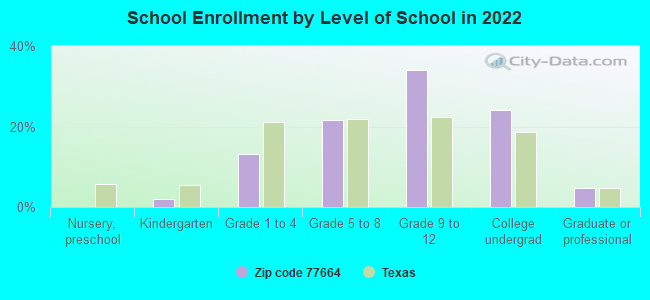
Private vs. public school enrollment:
Students in private schools in grades 1 to 8 (elementary and middle school):
Here:
0.0%
Texas:
8.8%
Students in private schools in grades 9 to 12 (high school):
Here:
0.0%
Texas:
8.0%
Students in private undergraduate colleges:
Here:
0.0%
Texas:
16.2%
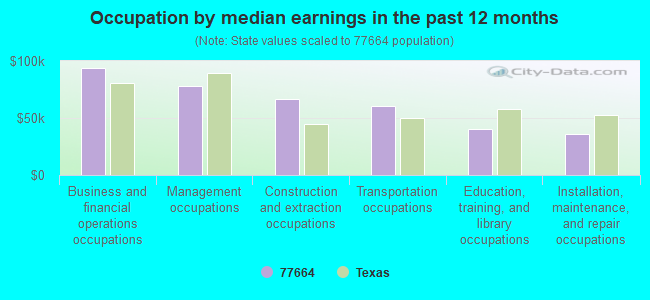
Occupation by median earnings in the past 12 months ($)
94,116Business and financial operations occupations
77,868Management occupations
66,529Construction and extraction occupations
60,676Transportation occupations
40,006Education, training, and library occupations
36,039Installation, maintenance, and repair occupations
Top industries in this zip code by the number of employees in 2005:
Other Services (except Public Administration): Religious Organizations (5-9 employees: 1 establishment, 1-4 employees: 1 establishment)
Accommodation and Food Services: Limited-Service Restaurants (5-9: 1)
Utilities: Water Supply and Irrigation Systems (5-9: 1)
Construction: Painting and Wall Covering Contractors (1-4: 1)
Other Services (except Public Administration): Home and Garden Equipment Repair and Maintenance (1-4: 1)
Administrative and Support and Waste Management and Remediation Services: Landscaping Services (1-4: 1)
Fatal accident statistics in 2014:
Fatal accident count: 1
Vehicles involved in fatal accidents: 1
Fatal accidents caused by drunken drivers: 0
Fatalities: 1
Persons involved in fatal accidents: 1
Pedestrians involved in fatal accidents: 0
Fatal accident statistics in 2013:
Fatal accident count: 1
Vehicles involved in fatal accidents: 1
Fatal accidents caused by drunken drivers: 0
Fatalities: 1
Persons involved in fatal accidents: 1
Pedestrians involved in fatal accidents: 0
2002 - 2018 National Fire Incident Reporting System (NFIRS) incidents
According to the data from the years 2002 - 2018 the average number of fires per year is 8. The highest number of reported fires - 17 took place in 2005, and the least - 3 in 2012. The data has a declining trend.
When looking into fire subcategories, the most incidents belonged to: Outside Fires (56.8%), and Structure Fires (33.1%).
Fire incident types reported to NFIRS in Zip Code 77664


 Nearest zip codes: 77663, 77624, 75979, 75942, 77625, 77616.


 According to the data from the years 2002 - 2018 the average number of fires per year is 8. The highest number of reported fires - 17 took place in 2005, and the least - 3 in 2012. The data has a declining trend.
 When looking into fire subcategories, the most incidents belonged to: Outside Fires (56.8%), and Structure Fires (33.1%).