Estimated zip code population in 2022: 12,056 Zip code population in 2010: 10,831 Zip code population in 2000: 8,857
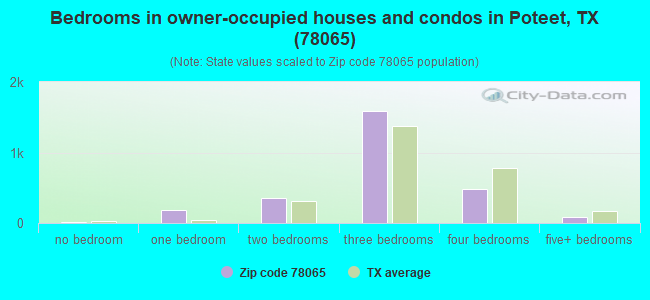
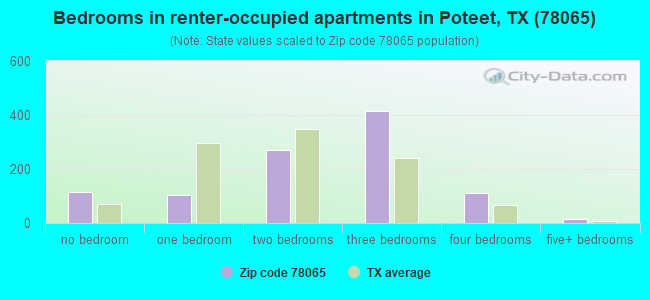
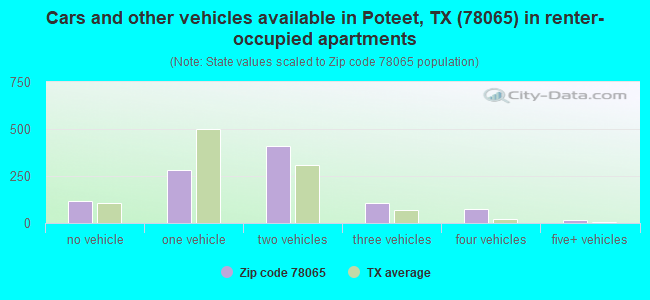
Houses and condos: 4,254 Renter-occupied apartments: 1,017
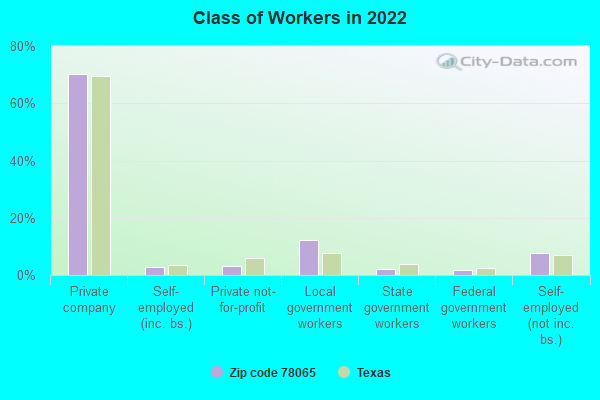
% of renters here:
27%
State:
38%
March 2022 cost of living index in zip code 78065: 78.9 (low, U.S. average is 100)
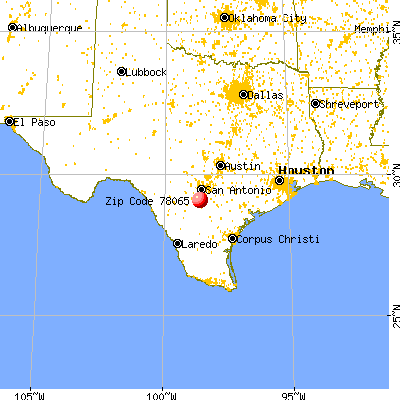
Land area: 166.8 sq. mi. Water area: 0.1 sq. mi.
Population density: 72 people per square mile
(very low).
OSM Map
General Map
Google Map
MSN Map
OSM Map
General Map
Google Map
MSN Map
OSM Map
General Map
Google Map
MSN Map
OSM Map
General Map
Google Map
MSN Map
Please wait while loading the map...
Real estate property taxes paid for housing units in 2022:
This zip code:
1.3% ($1,822)
Texas:
1.5% ($4,050)
Median real estate property taxes paid for housing units with mortgages in 2022: $1,742 (1.0%) Median real estate property taxes paid for housing units with no mortgage in 2022: $2,032 (1.6%)
Averages for the 2020 tax year for zip code 78065, filed in 2021:
Average Adjusted Gross Income (AGI) in 2020: $43,475 (Individual Income Tax Returns)
Here:
$43,475
State:
$77,054
Salary/wage: $41,524 (reported on 84.5% of returns)
Here:
$41,524
State:
$62,766
(% of AGI for various income ranges: 1165.9% for AGIs below $25k, 3490.0% for AGIs $25k-50k, 6500.5% for AGIs $50k-75k, 9853.9% for AGIs $75k-100k, 15725.9% for AGIs $100k-200k, 53545.0% for AGIs over 200k)
Taxable interest for individuals: $900 (reported on 11.5% of returns)
This zip code:
$900
Texas:
$2,665
(% of AGI for various income ranges: 5.4% for AGIs below $25k, 6.7% for AGIs $25k-50k, 20.4% for AGIs $50k-75k, 29.3% for AGIs $75k-100k, 40.4% for AGIs $100k-200k, 265.0% for AGIs over 200k)
Ordinary dividends: $3,043 (reported on 4.4% of returns)
Here:
$3,043
State:
$10,044
(% of AGI for various income ranges: 2.8% for AGIs below $25k, 2.4% for AGIs $25k-50k, 20.7% for AGIs $50k-75k, 43.2% for AGIs $75k-100k, 71.1% for AGIs $100k-200k, 950.0% for AGIs over 200k)
Net capital gain/loss in AGI: +$6,712 (reported on 5.0% of returns)
Here:
+$6,712
State:
+$39,590
(% of AGI for various income ranges: 3.6% for AGIs below $25k, 4.0% for AGIs $25k-50k, 22.6% for AGIs $50k-75k, 24.6% for AGIs $75k-100k, 396.7% for AGIs $100k-200k, 1810.0% for AGIs over 200k)
Profit/loss from business: +$7,639 (reported on 18.0% of returns)
Here:
+$7,639
State:
+$10,888
(% of AGI for various income ranges: 182.8% for AGIs below $25k, 133.7% for AGIs $25k-50k, 9.3% for AGIs $50k-75k, 276.8% for AGIs $75k-100k, 535.9% for AGIs $100k-200k)
Taxable individual retirement arrangement distribution: $14,706 (reported on 3.3% of returns)
78065:
$14,706
Texas:
$24,740
(% of AGI for various income ranges: 9.8% for AGIs below $25k, 26.8% for AGIs $25k-50k, 85.4% for AGIs $50k-75k, 240.0% for AGIs $75k-100k, 305.2% for AGIs $100k-200k)
Total itemized deductions: $28,000 (reported on 2.5% of returns)
Here:
$28,000
State:
$40,428
(% of AGI for various income ranges: 53.4% for AGIs $25k-50k, 167.7% for AGIs $50k-75k, 295.7% for AGIs $75k-100k, 432.2% for AGIs $100k-200k)
Charity contributions: $8,589 (reported on 1.7% of returns)
Here:
$8,589
State:
$18,201
(% of AGI for various income ranges: 6.7% for AGIs below $25k, 69.1% for AGIs $50k-75k, 97.4% for AGIs $100k-200k)
Taxes paid: $5,967 (reported on 2.3% of returns)
78065:
$5,967
State:
$7,821
(% of AGI for various income ranges: 6.4% for AGIs below $25k, 34.7% for AGIs $50k-75k, 65.4% for AGIs $75k-100k, 83.0% for AGIs $100k-200k)
Earned income credit: $2,801 (reported on 29.3% of returns)
Here:
$2,801
State:
$2,584
(% of AGI for various income ranges: 166.8% for AGIs below $25k, 105.7% for AGIs $25k-50k, 3.3% for AGIs $50k-75k)
Percentage of individuals using paid preparers for their 2020 taxes: 90.4%
Here:
90%
State:
92%
(% for various income ranges: 88.9% for AGIs below $25k, 91.3% for AGIs $25k-50k, 90.3% for AGIs $50k-75k, 92.3% for AGIs $75k-100k, 92.5% for AGIs $100k-200k, 100.0% for AGIs over 200k)
Averages for the 2012 tax year for zip code 78065, filed in 2013:
Average Adjusted Gross Income (AGI) in 2012: $37,973 (Individual Income Tax Returns)
Here:
$37,973
State:
$65,384
Salary/wage: $35,121 (reported on 88.0% of returns)
Here:
$35,121
State:
$52,524
(% of AGI for various income ranges: 79.9% for AGIs below $25k, 88.7% for AGIs $25k-50k, 86.2% for AGIs $50k-75k, 85.6% for AGIs $75k-100k, 86.2% for AGIs $100k-200k)
Taxable interest for individuals: $1,214 (reported on 11.8% of returns)
This zip code:
$1,214
Texas:
$2,372
(% of AGI for various income ranges: 0.3% for AGIs below $25k, 0.3% for AGIs $25k-50k, 0.4% for AGIs $50k-75k, 0.4% for AGIs $75k-100k, 0.7% for AGIs $100k-200k)
Ordinary dividends: $1,135 (reported on 4.6% of returns)
Here:
$1,135
State:
$9,721
(% of AGI for various income ranges: 0.1% for AGIs below $25k, 0.4% for AGIs $100k-200k)
Net capital gain/loss in AGI: +$1,894 (reported on 3.7% of returns)
Here:
+$1,894
State:
+$35,319
(% of AGI for various income ranges: 0.2% for AGIs below $25k, 0.2% for AGIs $25k-50k, 0.3% for AGIs $75k-100k, 0.3% for AGIs $100k-200k)
Profit/loss from business: +$9,264 (reported on 16.1% of returns)
Here:
+$9,264
State:
+$13,732
(% of AGI for various income ranges: 10.5% for AGIs below $25k, 1.8% for AGIs $25k-50k, 1.4% for AGIs $50k-75k, 1.9% for AGIs $75k-100k, 6.8% for AGIs $100k-200k)
Taxable individual retirement arrangement distribution: $9,594 (reported on 3.7% of returns)
78065:
$9,594
Texas:
$19,511
(% of AGI for various income ranges: 0.7% for AGIs below $25k, 0.6% for AGIs $25k-50k, 2.1% for AGIs $50k-75k, 1.5% for AGIs $100k-200k)
Total itemized deductions: $19,354 (27% of AGI, reported on 12.0% of returns)
Here:
$19,354
State:
$24,724
Here:
27.0% of AGI
State:
15.9% of AGI
(% of AGI for various income ranges: 3.1% for AGIs below $25k, 4.8% for AGIs $25k-50k, 7.8% for AGIs $50k-75k, 7.0% for AGIs $75k-100k, 10.3% for AGIs $100k-200k)
Charity contributions: $3,120 (reported on 8.1% of returns)
Here:
$3,120
State:
$6,808
(% of AGI for various income ranges: 0.2% for AGIs below $25k, 0.4% for AGIs $25k-50k, 1.0% for AGIs $50k-75k, 0.8% for AGIs $75k-100k, 1.1% for AGIs $100k-200k)
Taxes paid: $4,294 (reported on 11.1% of returns)
78065:
$4,294
State:
$6,921
(% of AGI for various income ranges: 0.4% for AGIs below $25k, 1.1% for AGIs $25k-50k, 1.3% for AGIs $50k-75k, 1.6% for AGIs $75k-100k, 2.4% for AGIs $100k-200k)
Earned income credit: $2,734 (reported on 35.0% of returns)
Here:
$2,734
State:
$2,570
(% of AGI for various income ranges: 11.8% for AGIs below $25k, 2.1% for AGIs $25k-50k)
Percentage of individuals using paid preparers for their 2012 taxes: 51.8%
Here:
52%
State:
51%
(% for various income ranges: 50.5% for AGIs below $25k, 50.0% for AGIs $25k-50k, 54.7% for AGIs $50k-75k, 55.2% for AGIs $75k-100k, 59.1% for AGIs $100k-200k, 100.0% for AGIs over 200k)
Averages for the 2004 tax year for zip code 78065, filed in 2005:
Average Adjusted Gross Income (AGI) in 2004: $26,319 (Individual Income Tax Returns)
Here:
$26,319
State:
$47,881
Salary/wage: $25,717 (reported on 87.9% of returns)
Here:
$25,717
State:
$41,947
(% of AGI for various income ranges: 121.9% for AGIs below $10k, 84.8% for AGIs $10k-25k, 90.3% for AGIs $25k-50k, 87.2% for AGIs $50k-75k, 80.9% for AGIs $75k-100k, 58.7% for AGIs over 100k)
Taxable interest for individuals: $1,146 (reported on 15.4% of returns)
This zip code:
$1,146
Texas:
$2,255
(% of AGI for various income ranges: 2.9% for AGIs below $10k, 0.5% for AGIs $10k-25k, 0.6% for AGIs $25k-50k, 0.4% for AGIs $50k-75k, 0.7% for AGIs $75k-100k, 1.3% for AGIs over 100k)
Taxable dividends: $1,975 (reported on 5.6% of returns)
Here:
$1,975
State:
$4,261
(% of AGI for various income ranges: 0.6% for AGIs below $10k, 0.1% for AGIs $10k-25k, 0.1% for AGIs $25k-50k, 0.2% for AGIs $50k-75k, 0.1% for AGIs $75k-100k, 3.7% for AGIs over 100k)
Net capital gain/loss: +$4,614 (reported on 5.5% of returns)
Here:
+$4,614
State:
+$16,110
(% of AGI for various income ranges: 1.6% for AGIs below $10k, -0.1% for AGIs $10k-25k, 0.3% for AGIs $25k-50k, 1.1% for AGIs $50k-75k, 0.5% for AGIs $75k-100k, 6.9% for AGIs over 100k)
Profit/loss from business: +$7,150 (reported on 14.1% of returns)
Here:
+$7,150
State:
+$11,013
(% of AGI for various income ranges: 13.9% for AGIs below $10k, 7.1% for AGIs $10k-25k, 1.6% for AGIs $25k-50k, 2.0% for AGIs $50k-75k, 2.5% for AGIs $75k-100k, 6.5% for AGIs over 100k)
IRA payment deduction: $2,300 (reported on 1.1% of returns)
78065:
$2,300
Texas:
$3,120
Total itemized deductions: $15,107 (27% of AGI, reported on 7.2% of returns)
Here:
$15,107
State:
$19,631
Here:
27.0% of AGI
State:
18.9% of AGI
(% of AGI for various income ranges: 2.6% for AGIs $10k-25k, 3.8% for AGIs $25k-50k, 5.3% for AGIs $50k-75k, 6.1% for AGIs $75k-100k, 6.3% for AGIs over 100k)
Charity contributions deductions: $2,282 (4% of AGI, reported on 5.2% of returns)
Here:
$2,282
State:
$4,753
Here:
3.9% of AGI
State:
4.2% of AGI
(% of AGI for various income ranges: 0.2% for AGIs $10k-25k, 0.3% for AGIs $25k-50k, 0.5% for AGIs $50k-75k, 1.0% for AGIs $75k-100k, 1.0% for AGIs over 100k)
Total tax: $3,105 (reported on 58.5% of returns)
78065:
$3,105
State:
$9,058
(% of AGI for various income ranges: 4.0% for AGIs below $10k, 2.9% for AGIs $10k-25k, 5.2% for AGIs $25k-50k, 8.2% for AGIs $50k-75k, 11.5% for AGIs $75k-100k, 17.8% for AGIs over 100k)
Earned income credit: $2,122 (reported on 40.0% of returns)
Here:
$2,122
State:
$2,024
Percentage of individuals using paid preparers for their 2004 taxes: 61.8%
Here:
62%
State:
57%
(% for various income ranges: 57.7% for AGIs below $10k, 66.8% for AGIs $10k-25k, 59.0% for AGIs $25k-50k, 60.9% for AGIs $50k-75k, 57.5% for AGIs $75k-100k, 66.0% for AGIs over 100k)
Household received Food Stamps/SNAP in the past 12 months: 778 Household did not receive Food Stamps/SNAP in the past 12 months: 2,986
Women who had a birth in the past 12 months: 206 (62 now married, 139 unmarried) Women who did not have a birth in the past 12 months: 2,297 (990 now married, 1,306 unmarried)
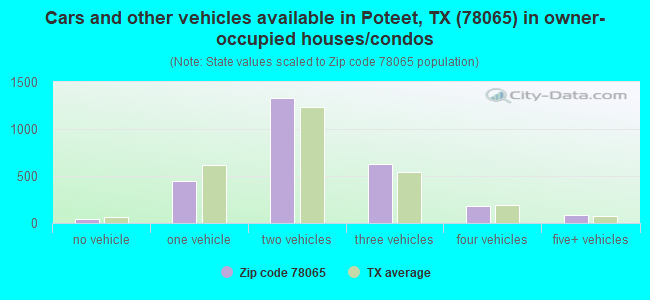
Housing units in zip code 78065 with a mortgage: 1,129 (34 second mortgage, 37 both second mortgage and home equity loan) Median monthly owner costs for units with a mortgage: $1,293 Median monthly owner costs for units without a mortgage: $432
Residents with income below the poverty level in 2022:
This zip code:
12.8%
Whole state:
14.0%
Residents with income below 50% of the poverty level in 2022:
This zip code:
2.9%
Whole state:
7.4%
Median number of rooms in houses and condos:
Here:
5.3
State:
6.3
Median number of rooms in apartments:
Here:
4.6
State:
4.0
Notable locations in this zip code not listed on our city pages
Notable locations in zip code 78065: Ditto (A), Sue (B), Primrose Volunteer Fire Department (C), Poteet Emergency Medical Services (D), Atascosa County Emergency Medical Services (E). Display/hide their locations on the map
Cemeteries: Estrada Cemetery (1), Madre Dolorosa Cemetery (2), Lott Cemetery (3), Brown Cemetery (4), Layer Cemetery (5), Zavala Cemetery (6), Rossville Cemetery (7). Display/hide their locations on the map
Streams, rivers, and creeks: Agua Negra Creek (A), Willow Creek (B), Siestedero Creek (C), Palo Alto Creek (D), Salt Branch (E), Padilla Creek (F), Mile and a Half Creek (G). Display/hide their locations on the map
In group quarters: 47 (-1 institutionalized population)
Size of family households: 1,203 2-persons, 584 3-persons, 574 4-persons, 357 5-persons, 2 6-persons, 158 7-or-more-persons
Size of nonfamily households: 721 1-person, 108 2-persons, 26 3-persons
1,163 married couples with children.
1,059 single-parent households (253 men, 806 women).
57.5% of residents of 78065 zip code speak English at home.
40.8% of residents speak Spanish at home (70% very well, 17% well, 13% not well).
0.2% of residents speak other Indo-European language at home (100% very well).
0.2% of residents speak Asian or Pacific Island language at home (100% very well).
1.3% of residents speak other language at home (50% very well, 50% well).
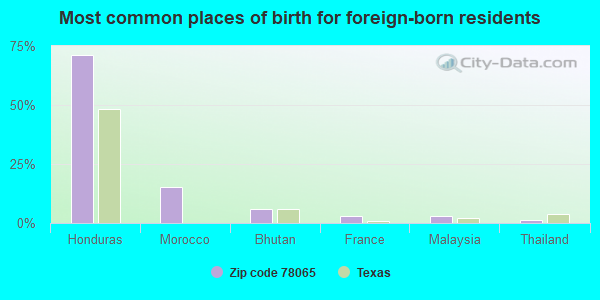
Foreign born population: 649 (5.4%) (42.6% of them are naturalized citizens)
This zip code:
5.4%
Whole state:
17.2%
71%Honduras
15%Morocco
6%Bhutan
3%France
3%Malaysia
1%Thailand
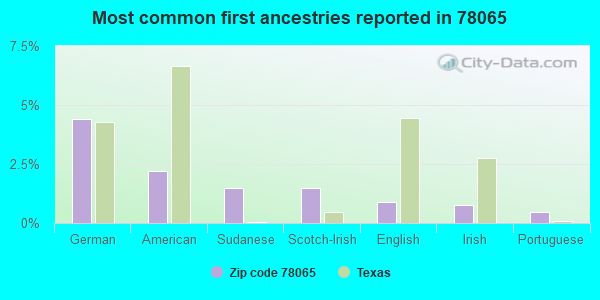
4%German
2%American
1%Sudanese
1%Scotch-Irish
1%English
1%Irish
0%Portuguese
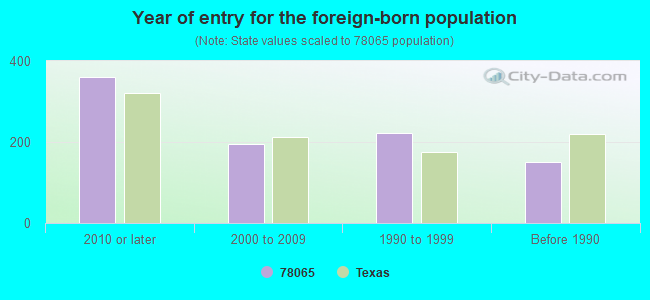
Year of entry for the foreign-born population
3602010 or later
1952000 to 2009
2231990 to 1999
151Before 1990
Facilities with environmental interests located in this zip code:
ATASCOSA CO JUVENILE UNIT (1100 SCHOOL DR in POTEET, TX)
(National Center for Education Statistics) - STATE ID-007906003 Organizations: POTEET ISD (SCHOOL DISTRICT)
Housing units lacking complete plumbing facilities: 4.4% Housing units lacking complete kitchen facilities: 5.1%
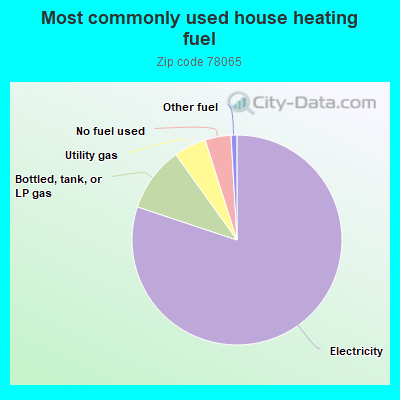
80.2%Electricity
10.0%Bottled, tank, or LP gas
5.0%Utility gas
4.0%No fuel used
0.9%Other fuel
Population in 1990: 9,523.
Place of birth for U.S.-born residents:
This state: 9,667
Northeast: 144
Midwest: 284
South: 278
West: 685
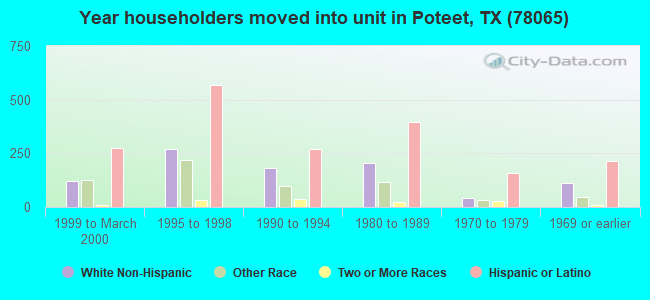
67% of the 78065 zip code residents lived in the same house 5 years ago. Out of people who lived in different houses, 39% lived in this county. Out of people who lived in different counties, 50% lived in Texas.
92% of the 78065 zip code residents lived in the same house 1 year ago. Out of people who lived in different houses, 67% moved from this county. Out of people who lived in different houses, 21% moved from different county within same state. Out of people who lived in different houses, 6% moved from different state. Out of people who lived in different houses, 4% moved from abroad.
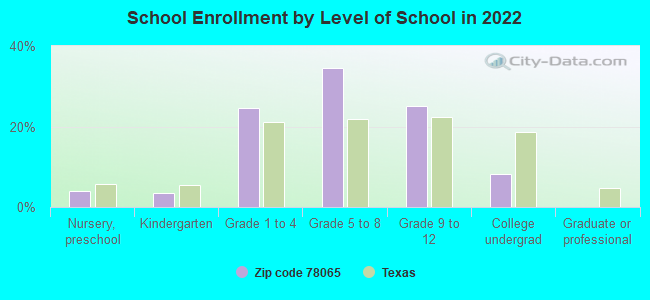
Private vs. public school enrollment:
Students in private schools in grades 1 to 8 (elementary and middle school): 40
Here:
2.4%
Texas:
8.8%
Students in private schools in grades 9 to 12 (high school): 32
Here:
4.5%
Texas:
8.0%
Students in private undergraduate colleges: 69
Here:
28.9%
Texas:
16.2%
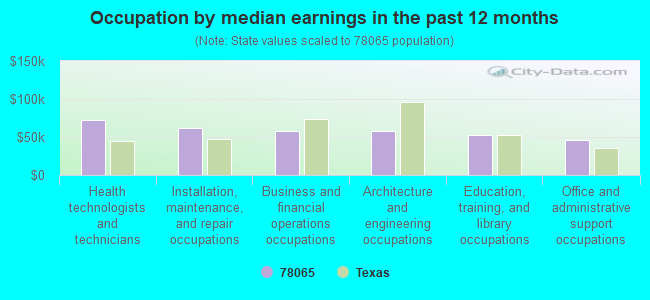
Occupation by median earnings in the past 12 months ($)
72,056Health technologists and technicians
62,214Installation, maintenance, and repair occupations
58,428Business and financial operations occupations
58,425Architecture and engineering occupations
52,389Education, training, and library occupations
46,149Office and administrative support occupations
Companies with federal contracts located in this zip code:
JB GARCIA SPORTS MAINTENANCE (314 FOURTH ST in POTEET, TX; small business) : $111,798 in 4 contractsfrom 1999 to 2004
$40,900 with Air Force for Installation of Equipment -- Miscellaneous. Signed on 2001-09-28. Completion date: 2001-12-07.
$35,000 with Air Force for Maintenance, Repair and Rebuilding of Equipment -- Musical Instruments, Phonographs, and Home-Type Radios. Signed on 1999-10-29. Completion date: 2000-09-30.
$18,498 with Air Force for Maintenance, Repair and Rebuilding of Equipment -- Miscellaneous. Signed on 2004-05-27. Completion date: 2005-05-31.
$17,400, same as above.Signed on 2003-05-21. Completion date: 2004-05-13.
TUTTLE MOTOR COMPANY (509 AVE H in POTEET, TX; small business) : $87,673 in 2 contractsin 2005
$84,590 with Air Force for Trucks and Truck Tractors, Wheeled. Signed on 2005-09-22. Completion date: 2005-10-07.
$3,083, same as above.Signed on 2005-09-27. Completion date: 2005-10-07.
J B GYM SERVICES (314 FOURTH ST in POTEET, TX; small business) : $29,758 in 2 contractsfrom 2005 to 2006
$22,425 with Air Force for Maintenance, Repair and Rebuilding of Equipment -- Miscellaneous. Signed on 2005-10-01. Completion date: 2006-03-31.
$7,333 with Air Force for Maintenance, Repair and Rebuilding of Equipment -- Recreational and Athletic Equipment. Signed on 2006-04-12. Completion date: 2006-09-30.
Top industries in this zip code by the number of employees in 2005:
Accommodation and Food Services: Full-Service Restaurants (50-99 employees: 1 establishment)
Accommodation and Food Services: Limited-Service Restaurants (20-49: 1, 1-4: 1)
Wholesale Trade: Farm and Garden Machinery and Equipment Merchant Wholesalers (20-49: 1)
Accommodation and Food Services: Rooming and Boarding Houses (20-49: 1)
Construction: New Single-Family Housing Construction (except Operative Builders) (20-49: 1)
Health Care and Social Assistance: Child Day Care Services (10-19: 1, 5-9: 2)
Other Services (except Public Administration): Religious Organizations (10-19: 1, 5-9: 1, 1-4: 3)
People in group quarters in 2010:
47 people in nursing facilities/skilled-nursing facilities
People in group quarters in 2000:
33 people in nursing homes
Fatal accident statistics in 2014:
Fatal accident count: 3
Vehicles involved in fatal accidents: 6
Fatal accidents caused by drunken drivers: 2
Fatalities: 4
Persons involved in fatal accidents: 10
Pedestrians involved in fatal accidents: 0
Fatal accident statistics in 2013:
Fatal accident count: 2
Vehicles involved in fatal accidents: 2
Fatal accidents caused by drunken drivers: 1
Fatalities: 2
Persons involved in fatal accidents: 4
Pedestrians involved in fatal accidents: 1
Home Mortgage Disclosure Act Aggregated Statistics For Year 2009 (Based on 2 full and 6 partial tracts)
A) FHA, FSA/RHS & VA Home Purchase Loans
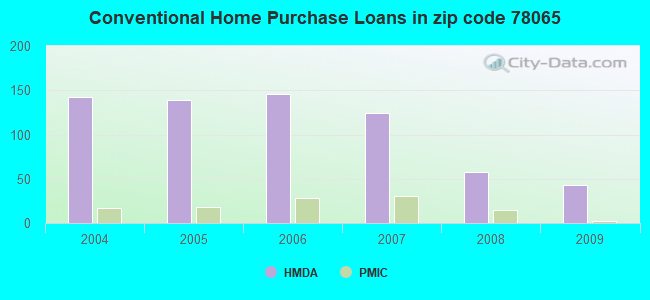
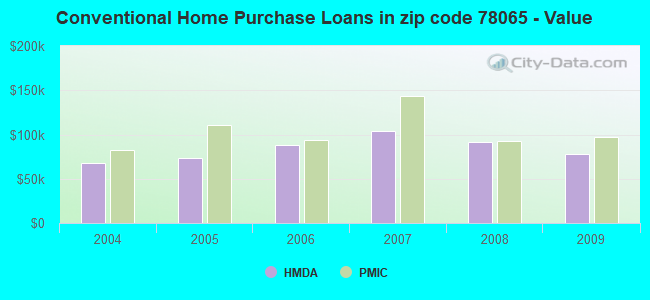
B) Conventional Home Purchase Loans
C) Refinancings
D) Home Improvement Loans
F) Non-occupant Loans on < 5 Family Dwellings (A B C & D)
G) Loans On Manufactured Home Dwelling (A B C & D)
Number
Average Value
Number
Average Value
Number
Average Value
Number
Average Value
Number
Average Value
Number
Average Value
LOANS ORIGINATED
56
$118,449
43
$78,507
67
$121,967
27
$24,366
12
$88,495
45
$76,381
APPLICATIONS APPROVED, NOT ACCEPTED
4
$111,050
17
$87,714
34
$94,730
2
$39,370
8
$42,382
23
$58,777
APPLICATIONS DENIED
16
$85,611
50
$67,683
96
$112,681
74
$25,241
7
$61,531
62
$57,643
APPLICATIONS WITHDRAWN
4
$196,685
3
$126,140
32
$128,832
4
$46,255
6
$103,017
5
$37,952
FILES CLOSED FOR INCOMPLETENESS
2
$146,545
2
$162,460
11
$86,019
1
$21,350
0
$0
7
$75,593
Aggregated Statistics For Year 2008 (Based on 2 full and 6 partial tracts)
A) FHA, FSA/RHS & VA Home Purchase Loans
B) Conventional Home Purchase Loans
C) Refinancings
D) Home Improvement Loans
F) Non-occupant Loans on < 5 Family Dwellings (A B C & D)
G) Loans On Manufactured Home Dwelling (A B C & D)
Number
Average Value
Number
Average Value
Number
Average Value
Number
Average Value
Number
Average Value
Number
Average Value
LOANS ORIGINATED
51
$140,898
58
$91,477
82
$117,994
40
$28,710
12
$75,612
48
$75,503
APPLICATIONS APPROVED, NOT ACCEPTED
4
$77,760
25
$63,164
28
$82,004
14
$24,435
5
$50,450
31
$57,550
APPLICATIONS DENIED
15
$94,077
79
$68,187
138
$101,062
132
$29,453
19
$80,748
83
$53,985
APPLICATIONS WITHDRAWN
7
$79,053
11
$81,221
51
$121,235
12
$57,507
4
$95,998
6
$56,282
FILES CLOSED FOR INCOMPLETENESS
1
$153,700
2
$94,870
14
$94,311
4
$34,040
0
$0
1
$92,220
Aggregated Statistics For Year 2007 (Based on 2 full and 6 partial tracts)
A) FHA, FSA/RHS & VA Home Purchase Loans
B) Conventional Home Purchase Loans
C) Refinancings
D) Home Improvement Loans
F) Non-occupant Loans on < 5 Family Dwellings (A B C & D)
G) Loans On Manufactured Home Dwelling (A B C & D)
Number
Average Value
Number
Average Value
Number
Average Value
Number
Average Value
Number
Average Value
Number
Average Value
LOANS ORIGINATED
39
$109,025
124
$103,946
108
$126,249
72
$26,050
26
$99,553
53
$69,600
APPLICATIONS APPROVED, NOT ACCEPTED
1
$118,720
36
$72,973
28
$129,406
10
$50,881
2
$77,340
27
$57,512
APPLICATIONS DENIED
3
$89,473
187
$71,841
159
$96,606
167
$28,592
31
$58,887
171
$56,616
APPLICATIONS WITHDRAWN
6
$190,472
25
$113,762
64
$99,990
20
$55,368
7
$75,044
15
$57,625
FILES CLOSED FOR INCOMPLETENESS
3
$63,257
7
$116,987
19
$204,644
2
$24,090
0
$0
1
$37,000
Aggregated Statistics For Year 2006 (Based on 2 full and 6 partial tracts)
A) FHA, FSA/RHS & VA Home Purchase Loans
B) Conventional Home Purchase Loans
C) Refinancings
D) Home Improvement Loans
F) Non-occupant Loans on < 5 Family Dwellings (A B C & D)
G) Loans On Manufactured Home Dwelling (A B C & D)
Number
Average Value
Number
Average Value
Number
Average Value
Number
Average Value
Number
Average Value
Number
Average Value
LOANS ORIGINATED
36
$124,856
146
$87,731
126
$103,195
50
$36,432
28
$71,248
77
$76,644
APPLICATIONS APPROVED, NOT ACCEPTED
5
$70,946
53
$60,380
33
$79,576
12
$27,052
5
$28,204
42
$48,109
APPLICATIONS DENIED
14
$82,848
163
$66,250
224
$78,735
154
$25,258
18
$64,230
182
$50,148
APPLICATIONS WITHDRAWN
8
$97,732
48
$76,120
97
$87,508
30
$32,030
10
$63,950
20
$64,140
FILES CLOSED FOR INCOMPLETENESS
3
$43,670
11
$119,051
14
$117,149
0
$0
0
$0
0
$0
Aggregated Statistics For Year 2005 (Based on 2 full and 6 partial tracts)
A) FHA, FSA/RHS & VA Home Purchase Loans
B) Conventional Home Purchase Loans
C) Refinancings
D) Home Improvement Loans
E) Loans on Dwellings For 5+ Families
F) Non-occupant Loans on < 5 Family Dwellings (A B C & D)
G) Loans On Manufactured Home Dwelling (A B C & D)
Number
Average Value
Number
Average Value
Number
Average Value
Number
Average Value
Number
Average Value
Number
Average Value
Number
Average Value
LOANS ORIGINATED
50
$102,920
139
$74,002
168
$88,060
61
$42,936
1
$44,520
22
$60,564
112
$69,705
APPLICATIONS APPROVED, NOT ACCEPTED
7
$78,776
91
$62,786
30
$72,795
8
$17,201
0
$0
1
$169,600
71
$53,910
APPLICATIONS DENIED
15
$49,257
233
$47,489
266
$68,697
167
$25,761
0
$0
26
$42,035
252
$44,253
APPLICATIONS WITHDRAWN
7
$78,567
33
$76,905
97
$77,665
35
$99,662
0
$0
5
$48,940
27
$64,372
FILES CLOSED FOR INCOMPLETENESS
2
$163,885
5
$59,266
38
$91,743
0
$0
0
$0
6
$75,765
1
$83,970
Aggregated Statistics For Year 2004 (Based on 2 full and 6 partial tracts)
A) FHA, FSA/RHS & VA Home Purchase Loans
B) Conventional Home Purchase Loans
C) Refinancings
D) Home Improvement Loans
F) Non-occupant Loans on < 5 Family Dwellings (A B C & D)
G) Loans On Manufactured Home Dwelling (A B C & D)
2003 - 2018 National Fire Incident Reporting System (NFIRS) incidents
Based on the data from the years 2003 - 2018 the average number of fires per year is 82. The highest number of reported fire incidents - 170 took place in 2008, and the least - 7 in 2003. The data has an increasing trend.
When looking into fire subcategories, the most incidents belonged to: Outside Fires (60.7%), and Structure Fires (26.5%).
Fire incident types reported to NFIRS in Zip Code 78065


 Nearest zip codes: 78069, 78050, 78073, 78052, 78264, 78002.


 Based on the data from the years 2003 - 2018 the average number of fires per year is 82. The highest number of reported fire incidents - 170 took place in 2008, and the least - 7 in 2003. The data has an increasing trend.
 When looking into fire subcategories, the most incidents belonged to: Outside Fires (60.7%), and Structure Fires (26.5%).