Estimated zip code population in 2022: 16,884 Zip code population in 2010: 15,225 Zip code population in 2000: 14,169
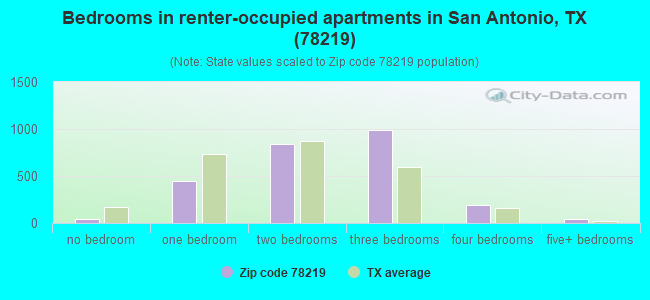
Houses and condos: 6,456 Renter-occupied apartments: 2,586
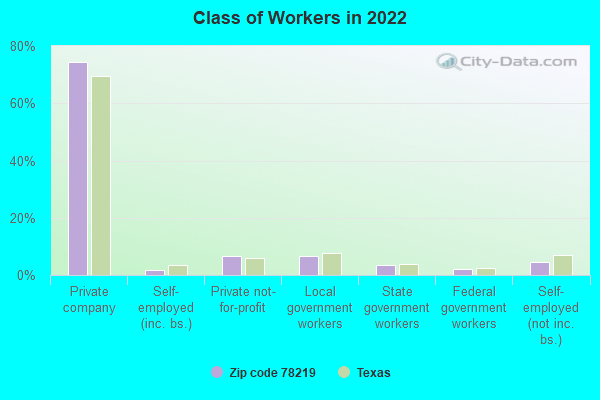
% of renters here:
44%
State:
38%
March 2022 cost of living index in zip code 78219: 86.9 (less than average, U.S. average is 100)
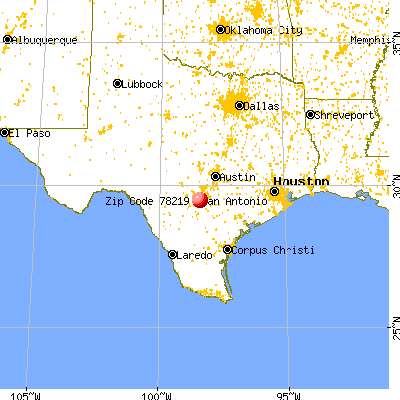
Land area: 13.7 sq. mi. Water area: 0.1 sq. mi.
Population density: 1,231 people per square mile
(low).
OSM Map
General Map
Google Map
MSN Map
OSM Map
General Map
Google Map
MSN Map
OSM Map
General Map
Google Map
MSN Map
OSM Map
General Map
Google Map
MSN Map
Please wait while loading the map...
Real estate property taxes paid for housing units in 2022:
This zip code:
1.5% ($2,355)
Texas:
1.5% ($4,050)
Median real estate property taxes paid for housing units with mortgages in 2022: $2,700 (1.6%) Median real estate property taxes paid for housing units with no mortgage in 2022: $2,173 (1.5%)
Averages for the 2020 tax year for zip code 78219, filed in 2021:
Average Adjusted Gross Income (AGI) in 2020: $36,008 (Individual Income Tax Returns)
Here:
$36,008
State:
$77,054
Salary/wage: $31,677 (reported on 82.8% of returns)
Here:
$31,677
State:
$62,766
(% of AGI for various income ranges: 1113.4% for AGIs below $25k, 3426.9% for AGIs $25k-50k, 6008.8% for AGIs $50k-75k, 9416.5% for AGIs $75k-100k, 13106.0% for AGIs $100k-200k)
Taxable interest for individuals: $823 (reported on 13.7% of returns)
This zip code:
$823
Texas:
$2,665
(% of AGI for various income ranges: 4.8% for AGIs below $25k, 4.9% for AGIs $25k-50k, 27.9% for AGIs $50k-75k, 78.7% for AGIs $75k-100k, 140.0% for AGIs $100k-200k)
Ordinary dividends: $1,709 (reported on 4.7% of returns)
Here:
$1,709
State:
$10,044
(% of AGI for various income ranges: 4.0% for AGIs below $25k, 3.0% for AGIs $25k-50k, 18.5% for AGIs $50k-75k, 80.0% for AGIs $75k-100k, 69.3% for AGIs $100k-200k)
Net capital gain/loss in AGI: +$17,412 (reported on 4.5% of returns)
Here:
+$17,412
State:
+$39,590
(% of AGI for various income ranges: 2.9% for AGIs below $25k, 5.5% for AGIs $25k-50k, 19.8% for AGIs $50k-75k, 143.0% for AGIs $75k-100k, 3279.3% for AGIs $100k-200k)
Profit/loss from business: +$7,724 (reported on 16.1% of returns)
Here:
+$7,724
State:
+$10,888
(% of AGI for various income ranges: 148.1% for AGIs below $25k, 110.3% for AGIs $25k-50k, 132.3% for AGIs $50k-75k, 275.2% for AGIs $75k-100k, 667.3% for AGIs $100k-200k)
Taxable individual retirement arrangement distribution: $9,504 (reported on 3.6% of returns)
78219:
$9,504
Texas:
$24,740
(% of AGI for various income ranges: 13.0% for AGIs below $25k, 34.8% for AGIs $25k-50k, 73.2% for AGIs $50k-75k, 165.7% for AGIs $75k-100k, 354.0% for AGIs $100k-200k)
Total itemized deductions: $30,558 (reported on 1.7% of returns)
Here:
$30,558
State:
$40,428
(% of AGI for various income ranges: 67.4% for AGIs $25k-50k, 134.7% for AGIs $50k-75k, 603.9% for AGIs $75k-100k)
Charity contributions: $7,310 (reported on 1.4% of returns)
Here:
$7,310
State:
$18,201
(% of AGI for various income ranges: 11.0% for AGIs $25k-50k, 42.3% for AGIs $50k-75k, 98.3% for AGIs $75k-100k)
Taxes paid: $5,142 (reported on 1.7% of returns)
78219:
$5,142
State:
$7,821
(% of AGI for various income ranges: 10.7% for AGIs $25k-50k, 26.1% for AGIs $50k-75k, 97.4% for AGIs $75k-100k)
Earned income credit: $2,780 (reported on 32.8% of returns)
Here:
$2,780
State:
$2,584
(% of AGI for various income ranges: 160.3% for AGIs below $25k, 101.7% for AGIs $25k-50k)
Percentage of individuals using paid preparers for their 2020 taxes: 91.8%
Here:
92%
State:
92%
(% for various income ranges: 91.3% for AGIs below $25k, 93.3% for AGIs $25k-50k, 89.3% for AGIs $50k-75k, 91.2% for AGIs $75k-100k, 91.3% for AGIs $100k-200k, 100.0% for AGIs over 200k)
Averages for the 2012 tax year for zip code 78219, filed in 2013:
Average Adjusted Gross Income (AGI) in 2012: $30,656 (Individual Income Tax Returns)
Here:
$30,656
State:
$65,384
Salary/wage: $27,330 (reported on 84.9% of returns)
Here:
$27,330
State:
$52,524
(% of AGI for various income ranges: 78.7% for AGIs below $25k, 83.1% for AGIs $25k-50k, 73.9% for AGIs $50k-75k, 73.8% for AGIs $75k-100k, 82.6% for AGIs $100k-200k)
Taxable interest for individuals: $789 (reported on 15.7% of returns)
This zip code:
$789
Texas:
$2,372
(% of AGI for various income ranges: 0.3% for AGIs below $25k, 0.3% for AGIs $25k-50k, 0.4% for AGIs $50k-75k, 0.4% for AGIs $75k-100k, 1.1% for AGIs $100k-200k)
Ordinary dividends: $1,830 (reported on 6.0% of returns)
Here:
$1,830
State:
$9,721
(% of AGI for various income ranges: 0.6% for AGIs below $25k, 0.3% for AGIs $25k-50k, 0.3% for AGIs $50k-75k, 0.2% for AGIs $75k-100k, 0.5% for AGIs $100k-200k)
Net capital gain/loss in AGI: +$3,857 (reported on 3.5% of returns)
Here:
+$3,857
State:
+$35,319
(% of AGI for various income ranges: 0.3% for AGIs $75k-100k, 4.1% for AGIs $100k-200k)
Profit/loss from business: +$7,949 (reported on 13.3% of returns)
Here:
+$7,949
State:
+$13,732
(% of AGI for various income ranges: 9.7% for AGIs below $25k, 1.6% for AGIs $25k-50k, 1.3% for AGIs $50k-75k, 1.0% for AGIs $75k-100k, 2.7% for AGIs $100k-200k)
Taxable individual retirement arrangement distribution: $8,743 (reported on 5.3% of returns)
78219:
$8,743
Texas:
$19,511
(% of AGI for various income ranges: 1.1% for AGIs below $25k, 0.9% for AGIs $25k-50k, 1.7% for AGIs $50k-75k, 1.8% for AGIs $75k-100k, 4.3% for AGIs $100k-200k)
Total itemized deductions: $16,251 (26% of AGI, reported on 8.6% of returns)
Here:
$16,251
State:
$24,724
Here:
26.5% of AGI
State:
15.9% of AGI
(% of AGI for various income ranges: 2.4% for AGIs below $25k, 4.2% for AGIs $25k-50k, 5.5% for AGIs $50k-75k, 6.9% for AGIs $75k-100k, 8.5% for AGIs $100k-200k)
Charity contributions: $4,233 (reported on 5.9% of returns)
Here:
$4,233
State:
$6,808
(% of AGI for various income ranges: 0.2% for AGIs below $25k, 0.6% for AGIs $25k-50k, 1.1% for AGIs $50k-75k, 1.3% for AGIs $75k-100k, 2.2% for AGIs $100k-200k)
Taxes paid: $3,224 (reported on 8.3% of returns)
78219:
$3,224
State:
$6,921
(% of AGI for various income ranges: 0.4% for AGIs below $25k, 0.8% for AGIs $25k-50k, 1.1% for AGIs $50k-75k, 1.2% for AGIs $75k-100k, 2.1% for AGIs $100k-200k)
Earned income credit: $2,728 (reported on 38.2% of returns)
Here:
$2,728
State:
$2,570
(% of AGI for various income ranges: 11.8% for AGIs below $25k, 1.8% for AGIs $25k-50k)
Percentage of individuals using paid preparers for their 2012 taxes: 44.6%
Here:
45%
State:
51%
(% for various income ranges: 45.1% for AGIs below $25k, 41.7% for AGIs $25k-50k, 44.6% for AGIs $50k-75k, 46.2% for AGIs $75k-100k, 56.2% for AGIs $100k-200k, 100.0% for AGIs over 200k)
Averages for the 2004 tax year for zip code 78219, filed in 2005:
Average Adjusted Gross Income (AGI) in 2004: $27,648 (Individual Income Tax Returns)
Here:
$27,648
State:
$47,881
Salary/wage: $24,882 (reported on 87.3% of returns)
Here:
$24,882
State:
$41,947
(% of AGI for various income ranges: 87.4% for AGIs below $10k, 82.8% for AGIs $10k-25k, 82.7% for AGIs $25k-50k, 77.7% for AGIs $50k-75k, 77.1% for AGIs $75k-100k, 52.7% for AGIs over 100k)
Taxable interest for individuals: $1,036 (reported on 23.2% of returns)
This zip code:
$1,036
Texas:
$2,255
(% of AGI for various income ranges: 1.5% for AGIs below $10k, 0.9% for AGIs $10k-25k, 0.7% for AGIs $25k-50k, 0.8% for AGIs $50k-75k, 0.9% for AGIs $75k-100k, 1.4% for AGIs over 100k)
Taxable dividends: $1,014 (reported on 8.4% of returns)
Here:
$1,014
State:
$4,261
(% of AGI for various income ranges: 0.3% for AGIs below $10k, 0.2% for AGIs $10k-25k, 0.3% for AGIs $25k-50k, 0.3% for AGIs $50k-75k, 0.3% for AGIs $75k-100k, 0.6% for AGIs over 100k)
Net capital gain/loss: +$1,183 (reported on 5.5% of returns)
Here:
+$1,183
State:
+$16,110
(% of AGI for various income ranges: -0.3% for AGIs below $10k, 0.0% for AGIs $10k-25k, 0.2% for AGIs $25k-50k, 0.2% for AGIs $50k-75k, -0.0% for AGIs $75k-100k, 1.5% for AGIs over 100k)
Profit/loss from business: +$5,789 (reported on 11.9% of returns)
Here:
+$5,789
State:
+$11,013
(% of AGI for various income ranges: 7.8% for AGIs below $10k, 3.7% for AGIs $10k-25k, 1.9% for AGIs $25k-50k, 1.4% for AGIs $50k-75k, 0.2% for AGIs $75k-100k, 4.1% for AGIs over 100k)
IRA payment deduction: $2,175 (reported on 1.0% of returns)
78219:
$2,175
Texas:
$3,120
Total itemized deductions: $12,894 (25% of AGI, reported on 9.8% of returns)
Here:
$12,894
State:
$19,631
Here:
24.6% of AGI
State:
18.9% of AGI
(% of AGI for various income ranges: 2.8% for AGIs below $10k, 2.2% for AGIs $10k-25k, 4.8% for AGIs $25k-50k, 5.8% for AGIs $50k-75k, 5.5% for AGIs $75k-100k, 6.8% for AGIs over 100k)
Charity contributions deductions: $3,312 (6% of AGI, reported on 8.0% of returns)
Here:
$3,312
State:
$4,753
Here:
6.1% of AGI
State:
4.2% of AGI
(% of AGI for various income ranges: 0.2% for AGIs below $10k, 0.3% for AGIs $10k-25k, 0.9% for AGIs $25k-50k, 1.4% for AGIs $50k-75k, 1.8% for AGIs $75k-100k, 1.4% for AGIs over 100k)
Total tax: $3,502 (reported on 63.2% of returns)
78219:
$3,502
State:
$9,058
(% of AGI for various income ranges: 2.4% for AGIs below $10k, 3.2% for AGIs $10k-25k, 6.4% for AGIs $25k-50k, 9.2% for AGIs $50k-75k, 11.7% for AGIs $75k-100k, 21.6% for AGIs over 100k)
Earned income credit: $2,081 (reported on 33.4% of returns)
Here:
$2,081
State:
$2,024
Percentage of individuals using paid preparers for their 2004 taxes: 58.5%
Here:
58%
State:
57%
(% for various income ranges: 57.7% for AGIs below $10k, 64.8% for AGIs $10k-25k, 53.3% for AGIs $25k-50k, 50.4% for AGIs $50k-75k, 53.9% for AGIs $75k-100k, 64.0% for AGIs over 100k)
Household received Food Stamps/SNAP in the past 12 months: 1,484 Household did not receive Food Stamps/SNAP in the past 12 months: 4,459
Women who had a birth in the past 12 months: 417 (299 now married, 119 unmarried) Women who did not have a birth in the past 12 months: 3,253 (1,484 now married, 1,767 unmarried)
Housing units in zip code 78219 with a mortgage: 1,239 (39 second mortgage, 21 both second mortgage and home equity loan) Median monthly owner costs for units with a mortgage: $1,213 Median monthly owner costs for units without a mortgage: $495
Residents with income below the poverty level in 2022:
This zip code:
22.6%
Whole state:
14.0%
Residents with income below 50% of the poverty level in 2022:
This zip code:
13.7%
Whole state:
7.4%
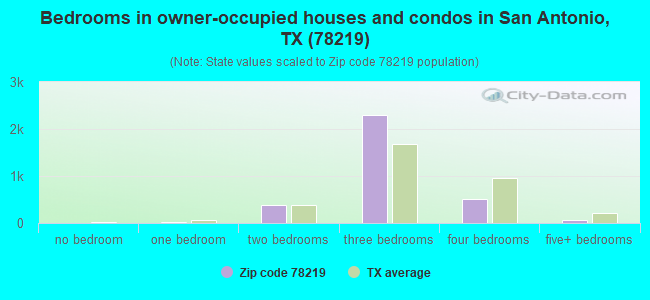
Median number of rooms in houses and condos:
Here:
5.8
State:
6.3
Median number of rooms in apartments:
Here:
4.6
State:
4.0
Notable locations in this zip code not listed on our city pages
Notable locations in zip code 78219: Willow Springs Golf Course (A), Protocol School of Texas (B), San Antonio Fire Department Station 30 (C), Freeman Coliseum (D), Kirby Fire / Emergency Medical Services (E), Kirby City Hall (F), Kirby Police Department (G), San Antonio SE Area Police Station (H). Display/hide their locations on the map
Churches in zip code 78219 include: Eastgate Spanish Seventh Day Adventist Church (A), East End Baptist Church (B), White Robe Missionary Baptist Church (C), Saint Joan of Arc Catholic Church (D), Philadelphia Missionary Baptist Church (E), Kirby Baptist Church (F), Ball Tabernacle African Methodist Episcopal Church (G), Christian Unity Missionary Baptist Church (H), Community Evangelical United Church of Christ (I). Display/hide their locations on the map
Parks in zip code 78219 include: Hugo Lenzt Park (1), Skyline Park (2), Pletz County Park (3), John H Sterling Memorial Park (4), SBC Center (5). Display/hide their locations on the map
Tourist attractions (not listed on the city page) : Antioch Village Activity Center (Amusement & Theme Parks; 1514 Upland Road Ofc) (1), All-Pro Tours Inc (Tours & Charters; 5529 Fm 78) (2). Display/hide their approximate locations on the map
1,563 married couples with children.
1,750 single-parent households (315 men, 1,435 women).
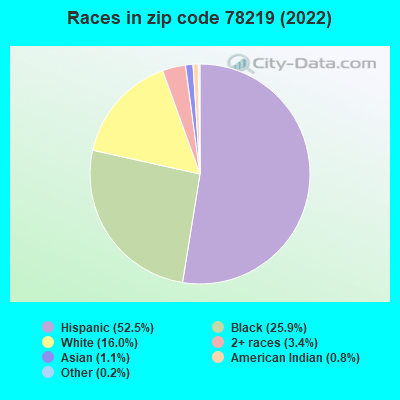
63.6% of residents of 78219 zip code speak English at home.
34.4% of residents speak Spanish at home (66% very well, 18% well, 11% not well, 5% not at all).
0.4% of residents speak other Indo-European language at home (100% very well).
1.2% of residents speak Asian or Pacific Island language at home (34% very well, 17% well, 49% not well).
0.4% of residents speak other language at home (70% not well, 30% not at all).
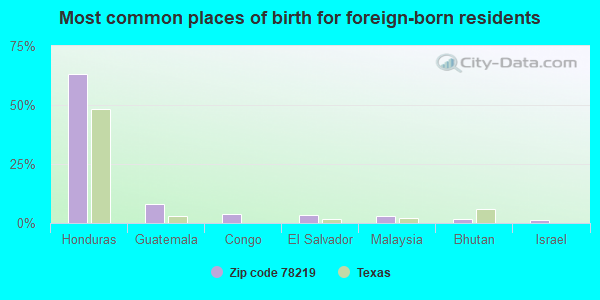
Foreign born population: 2,307 (13.7%) (47.4% of them are naturalized citizens)
Major facilities with environmental interests located in this zip code:
ALAMO IRON WORKS INCORPORATED (943 COLISEUM ROAD in SAN ANTONIO, TX)
COMPLIANCE ACTIVITY (Tracking inspections of insecticide, fungicide, and rodenticide, and toxic substances) Large Quantity Generators, more that 1000 kg of hazardous waste/month (Resource Conservation and Recovery Act (tracking hazardous waste)) Business SIC classification: GRAY AND DUCTILE IRON FOUNDRIES Business NAICS classification: ALL OTHER MISCELLANEOUS FABRICATED METAL PRODUCT MANUFACTURING.
AARON PAINT & BODY SHOP (2107 ACKERMAN RD in SAN ANTONIO, TX)
(Resource Conservation and Recovery Act (tracking hazardous waste))
ABF FREIGHT SYSTEM INC (4354 DIRECTOR DR in SAN ANTONIO, TX)
(Resource Conservation and Recovery Act (tracking hazardous waste))
AER MANUFACTURING INC (3978 N PAN AM EXPWY in SAN ANTONIO, TX)
(Resource Conservation and Recovery Act (tracking hazardous waste)) Business NAICS classification: MOTOR VEHICLE BODY MANUFACTURING.
ALAMO CITY TRUCK SERVICE INC (3410 E HOUSTON ST in SAN ANTONIO, TX)
(Resource Conservation and Recovery Act (tracking hazardous waste)) Business NAICS classification: GENERAL AUTOMOTIVE REPAIR. Alternative names: ALAMO CITY TRK SVC INC
ANDERSON MACHINERY COMPANY (9415 NE LOOP 410 in SAN ANTONIO, TX)
(Resource Conservation and Recovery Act (tracking hazardous waste)) Business NAICS classification: GENERAL AUTOMOTIVE REPAIR.
AZTEC CERAMIC CORPORATION (4735 EMIL RD in SAN ANTONIO, TX)
(Resource Conservation and Recovery Act (tracking hazardous waste)) Alternative names: AZTEC CERAMICS CORP
ACE METAL FNSHNG CO (5563 SEGUIN RD in KIRBY, TX)
(Resource Conservation and Recovery Act (tracking hazardous waste))
AGGREGATE PLANT PRODUCTS CO (442 NW WEST WHITE RD in SAN ANTONIO, TX)
(Resource Conservation and Recovery Act (tracking hazardous waste)) Business NAICS classification: SHEET METAL WORK MANUFACTURING.
ALAMO TRAILER (4100 FACTORY HILL in SAN ANTONIO, TX)
Small Quantity Generators, between 100 kg and 1000 kg of hazardous waste/month (Resource Conservation and Recovery Act (tracking hazardous waste)) - notification Business NAICS classification: GENERAL AUTOMOTIVE REPAIR.
AMERICAN TELEPHONE AND TELEGRAPH CONSUME (3802 BINZ-ENGLEMAN STE 102 in SAN ANTONIO, TX)
(Resource Conservation and Recovery Act (tracking hazardous waste)) Alternative names: A T & T
BAKER HUGHES OILFIELD OPERATIONS INC (4302 PROFIT ST in SAN ANTONIO, TX)
Small Quantity Generators, between 100 kg and 1000 kg of hazardous waste/month (Resource Conservation and Recovery Act (tracking hazardous waste)) - notification Business NAICS classification: ALL OTHER MISCELLANEOUS MANUFACTURING. Alternative names: BAKER SPD
ADVANCED AMERICAN TELEPHONE (1143 COLISEUM RD. in SAN ANTONIO, TX)
Small Quantity Generators, between 100 kg and 1000 kg of hazardous waste/month (Resource Conservation and Recovery Act (tracking hazardous waste)) - notification
Housing units lacking complete plumbing facilities: 2.1% Housing units lacking complete kitchen facilities: 1.6%
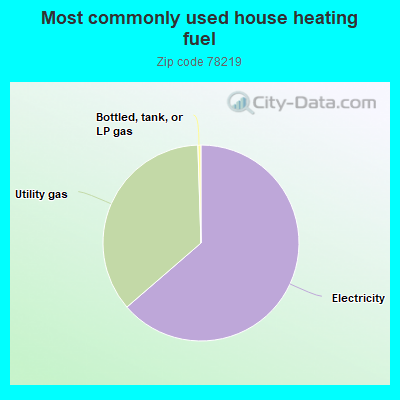
63.4%Electricity
35.7%Utility gas
0.5%Bottled, tank, or LP gas
Population in 1990: 14,249.
Place of birth for U.S.-born residents:
This state: 10,636
Northeast: 517
Midwest: 1,240
South: 950
West: 942
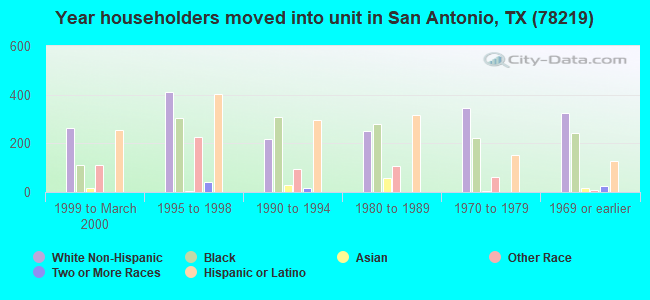
65% of the 78219 zip code residents lived in the same house 5 years ago. Out of people who lived in different houses, 79% lived in this county. Out of people who lived in different counties, 50% lived in Texas.
87% of the 78219 zip code residents lived in the same house 1 year ago. Out of people who lived in different houses, 74% moved from this county. Out of people who lived in different houses, 10% moved from different county within same state. Out of people who lived in different houses, 10% moved from different state. Out of people who lived in different houses, 1% moved from abroad.
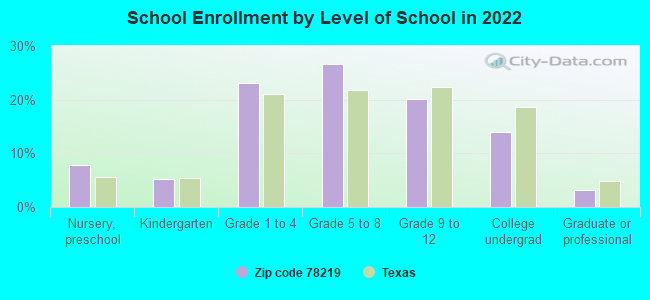
Private vs. public school enrollment:
Students in private schools in grades 1 to 8 (elementary and middle school): 111
Here:
5.3%
Texas:
8.8%
Students in private schools in grades 9 to 12 (high school): 68
Here:
8.1%
Texas:
8.0%
Students in private undergraduate colleges: 112
Here:
19.2%
Texas:
16.2%
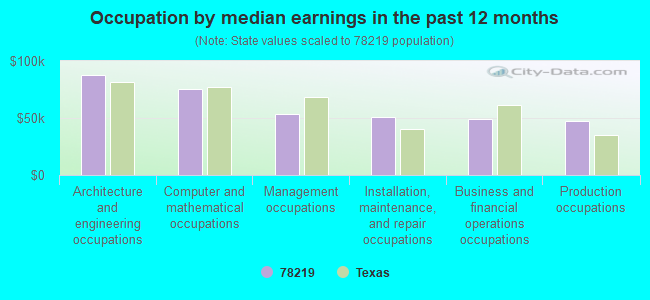
Occupation by median earnings in the past 12 months ($)
88,101Architecture and engineering occupations
75,099Computer and mathematical occupations
53,795Management occupations
50,950Installation, maintenance, and repair occupations
48,960Business and financial operations occupations
47,109Production occupations
Companies with biggest federal contracts located in this zip code (SAN ANTONIO, TX):
MCS MANAGEMENT, INC (4415 DIVIDEND ROAD; small business) : $41,393,724 in 69 contractsfrom 1999 to 2006
Contracts for Food Services by Navy, Army Signed by year:2000: $9,849,461; 2001: $14,368,609; 2002: $10,906,058; 2003: $0; 2004: $1,331,658; 2005: $2,799,727; 2006: -$5,070,900.
Biggest contracts:
$7,040,368 with Navy for Food Services. Taking place in NC. Signed on 1999-10-01. Completion date: 2000-09-30.
$4,807,275 with Navy for Food Services. Taking place in CA. Signed on 2000-06-01. Completion date: 2000-12-29.
$2,342,713, same as above.Signed on 2002-07-10. Completion date: 2002-09-30.
$2,342,713, same as above.Signed on 2002-04-01. Completion date: 2002-06-30.
GRANDE FORD TRUCK SALES INC (4562 E IH 10; small business) : $26,075,579 in 551 contractsfrom 2003 to 2006
Contracts for Trucks and Truck Tractors, Wheeled, Miscellaneous Items, Passenger Motor Vehicles, Vehicular Cab, Body, and Frame Structural Components, and moreby Federal Supply Service, ENERGY, Department of, Navy, Army, and others Signed by year:2000: $0; 2001: $0; 2002: $0; 2003: $2,567,621; 2004: $12,799,528; 2005: $7,497,723; 2006: $3,210,707.
Biggest contracts:
$794,296 with Federal Supply Service for Trucks and Truck Tractors, Wheeled. Taking place in KY. Signed on 2004-02-20. Completion date: 2004-07-19.
$588,659, same as above.Signed on 2005-04-11. Completion date: 2005-12-07.
$456,696 with ENERGY, Department of for Trucks and Truck Tractors, Wheeled. Signed on 2003-05-15. Completion date: 2003-07-15.
$407,426 with Federal Supply Service for Trucks and Truck Tractors, Wheeled. Taking place in KY. Signed on 2004-10-13. Completion date: 2004-10-20.
COCA-COLA ENTERPRISES (1 COCA COLA PLACE) : $18,920,595 in 97 contractsfrom 1999 to 2006
Contracts for Food Items For Resale, Non-Food Items For Resale, Beverages, Nonalcoholic by Department of Defense, Defense Commissary Agency, Army Signed by year:2000: $1,478,409; 2001: $4,762,685; 2002: $1,569,466; 2003: $1,532,362; 2004: $3,318,097; 2005: $4,016,011; 2006: $1,264,772.
Biggest contracts:
$1,960,837 with Department of Defense for Food Items For Resale. Signed on 2001-11-01. Completion date: 2002-08-31.
$1,140,311, same as above.Signed on 2002-10-01. Completion date: 2003-05-31.
$1,082,618 with Defense Commissary Agency for Food Items For Resale. Signed on 2005-04-01. Completion date: 2005-08-31.
$953,270, same as above.Signed on 2004-10-01. Completion date: 2005-02-28.
EMPIRE INTEGRATED SERVICES INC (1003 PAULSUN DRIVE; small business) : $8,193,869 in 104 contractsfrom 2003 to 2006
Contracts for Other ADP and Telecommunications Services (includes data storage on tapes, compact disks, etc.), Other Special Studies and Analyses, Fiber Optic Cables, ADP Input/Output and Storage Devices, and moreby Air Force, Department of Veterans Affairs Signed by year:2000: $0; 2001: $0; 2002: $0; 2003: $338,036; 2004: $5,776,419; 2005: $2,293,578; 2006: -$214,164.
Biggest contracts:
$973,651 with Air Force for Other ADP and Telecommunications Services (includes data storage on tapes, compact disks, etc.). Signed on 2004-12-23. Completion date: 2005-09-16.
$399,764, same as above.Signed on 2004-08-31. Completion date: 2004-12-15.
$381,690 with Air Force for Other Special Studies and Analyses. Taking place in OK. Signed on 2004-09-22. Completion date: 2004-12-26.
$361,000 with Air Force for Other ADP and Telecommunications Services (includes data storage on tapes, compact disks, etc.). Signed on 2004-09-27. Completion date: 2004-10-22.
MAGNETO & DIESEL INJECTORSVC (1002 PAULSUN ST; small business) : $3,578,861 in 59 contractsfrom 2003 to 2006
Contracts for Engine Fuel System Components, Nonaircraft, Miscellaneous Power Transmission Equipment, Valves, Powered, Maintenance, Repair and Rebuilding of Equipment -- Ship and Marine Equipment, and moreby Army, Defense Logistics Agency, U.S. Coast Guard Signed by year:2000: $0; 2001: $0; 2002: $0; 2003: $80,549; 2004: $1,240,948; 2005: $2,128,964; 2006: $128,400.
Biggest contracts:
$820,817 with Army for Engine Fuel System Components, Nonaircraft. Signed on 2005-07-01. Completion date: 2009-09-30.
$617,450, same as above.Signed on 2005-04-07. Completion date: 2009-09-30.
$547,680 with Defense Logistics Agency for Engine Fuel System Components, Nonaircraft. Signed on 2004-01-29. Completion date: 2004-08-16.
$403,058 with Army for Engine Fuel System Components, Nonaircraft. Signed on 2005-07-29. Completion date: 2009-09-30.
COASTALTRANSPORT CO INC (1603 ACKERMAN RD) : $3,230,912 in 4 contractsin 2003
$2,833,252 with Army for Motor Freight. Signed on 2003-01-13. Completion date: 2003-10-31.
$397,660, same as above.Signed on 2003-03-13. Completion date: 2003-10-31.
$0, same as above.Signed on 2003-03-13. Completion date: 2007-10-31.
$0, same as above.Signed on 2003-03-13. Completion date: 2007-10-31.
BIG RED/SEVEN-UP BOTTLING COMP (4518 SEGUIN RD) : $1,535,459 in 11 contractsfrom 2003 to 2006
Contracts for Food Items For Resale, Non-Food Items For Resale by Defense Commissary Agency, Department of Defense Signed by year:2000: $0; 2001: $0; 2002: $0; 2003: $27,600; 2004: $402,038; 2005: $807,960; 2006: $297,861.
Biggest contracts:
$391,477 with Defense Commissary Agency for Food Items For Resale. Signed on 2005-04-01. Completion date: 2005-08-31.
$297,861 with Defense Commissary Agency for Non-Food Items For Resale. Signed on 2006-01-01. Completion date: 2006-03-31.
$279,156 with Defense Commissary Agency for Food Items For Resale. Signed on 2004-10-01. Completion date: 2005-02-28.
$185,983 with Defense Commissary Agency for Non-Food Items For Resale. Signed on 2005-10-01. Completion date: 2005-12-31.
C J MACHINE, INC (1034 GRUBB ROAD; small business) : $1,423,402 in 18 contractsfrom 1999 to 2005
Contracts for Guided Missile Handling and Servicing Equipment, Aircraft Ground Servicing Equipment, Miscellaneous Power Transmission Equipment, Miscellaneous Weapons, and moreby Air Force, Defense Logistics Agency Signed by year:2000: $821,100; 2001: $457,400; 2002: $0; 2003: $0; 2004: $0; 2005: $76,099; 2006: $0.
Biggest contracts:
$408,500 with Air Force for Guided Missile Handling and Servicing Equipment. Signed on 2001-01-29. Completion date: 2001-11-30.
$301,128 with Air Force for Aircraft Ground Servicing Equipment. Signed on 2000-03-08. Completion date: 2000-12-31.
$223,880, same as above.Signed on 2000-04-26. Completion date: 2000-12-31.
$94,500, same as above.Signed on 2000-09-28. Completion date: 2000-09-30.
GOMEZ FLOOR COVERING INC (3816 BINZ ENGLEMAN; small business) : $969,436 in 41 contractsfrom 2000 to 2006
Contracts for Construction of Structures and Facilities -- Other Administrative Facilities and Service Buildings, Floor Coverings, Office Furniture, Maintenance, Repair or Alteration of Real Property -- Office Buildings, and moreby Air Force, Forest Service, Army, Public Buildings Service, and others Signed by year:2000: $1,900; 2001: $0; 2002: $0; 2003: $2,858; 2004: $572,473; 2005: $253,965; 2006: $138,240.
Biggest contracts:
$199,819 with Air Force for Construction of Structures and Facilities -- Other Administrative Facilities and Service Buildings. Signed on 2004-09-29. Completion date: 2004-10-01.
$136,185 with Air Force for Floor Coverings. Signed on 2004-09-28. Completion date: 2004-12-31.
$78,662, same as above.Signed on 2004-09-21. Completion date: 2004-10-29.
$71,596, same as above.Signed on 2005-09-29. Completion date: 2005-10-25.
DAILEY & WELLS COMMUNICATIONS, (3440 E HOUSTON ST; small business) : $951,837 in 33 contractsfrom 2002 to 2006
Contracts for Radio and Television Communication Equipment, Except Airborne, Radio Navigation Equipment, Airborne, Radio and Television Communication Equipment, Airborne, Communications Security Equipment and Components, and moreby Navy, Army, Federal Bureau of Investigation, U.S. Fish and Wildlife Service, and others Signed by year:2000: $0; 2001: $0; 2002: $321,685; 2003: $182,822; 2004: $174,741; 2005: $136,426; 2006: $136,163.
Biggest contracts:
$229,594 with Navy for Radio and Television Communication Equipment, Except Airborne. Signed on 2002-09-18. Completion date: 2002-10-18.
$127,010 with Army for Radio Navigation Equipment, Airborne. Signed on 2003-09-30. Completion date: 2003-12-01.
$98,650 with Army for Radio and Television Communication Equipment, Except Airborne. Signed on 2006-02-24. Completion date: 2006-04-03.
$91,110 with Army for Radio and Television Communication Equipment, Airborne. Signed on 2005-06-24. Completion date: 2005-10-20.
Top industries in this zip code by the number of employees in 2005:
Construction: Other Building Equipment Contractors (over 1000 employees: 1 establishment, 20-49 employees: 1 establishment)
Accommodation and Food Services: Food Service Contractors (250-499: 2, 100-249: 1, 20-49: 1, 10-19: 3, 1-4: 3)
Management of Companies and Enterprises: Corporate, Subsidiary, and Regional Managing Offices (500-999: 1, 50-99: 1, 20-49: 2, 10-19: 1, 5-9: 3, 1-4: 1)
Administrative and Support and Waste Management and Remediation Services: Convention and Trade Show Organizers (500-999: 1, 100-249: 1, 1-4: 1)
2002 - 2018 National Fire Incident Reporting System (NFIRS) incidents
According to the data from the years 2002 - 2018 the average number of fire incidents per year is 95. The highest number of fire incidents - 144 took place in 2006, and the least - 30 in 2008. The data has a decreasing trend.
When looking into fire subcategories, the most reports belonged to: Outside Fires (46.1%), and Mobile Property/Vehicle Fires (26.2%).
Fire incident types reported to NFIRS in Zip Code 78219


 Nearest zip codes: 78220, 78218, 78244, 78234, 78208, 78202.
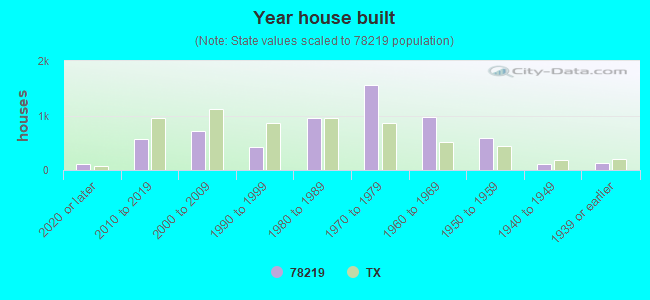


 According to the data from the years 2002 - 2018 the average number of fire incidents per year is 95. The highest number of fire incidents - 144 took place in 2006, and the least - 30 in 2008. The data has a decreasing trend.
 When looking into fire subcategories, the most reports belonged to: Outside Fires (46.1%), and Mobile Property/Vehicle Fires (26.2%).