Estimated zip code population in 2022: 15,301 Zip code population in 2010: 16,867 Zip code population in 2000: 17,344
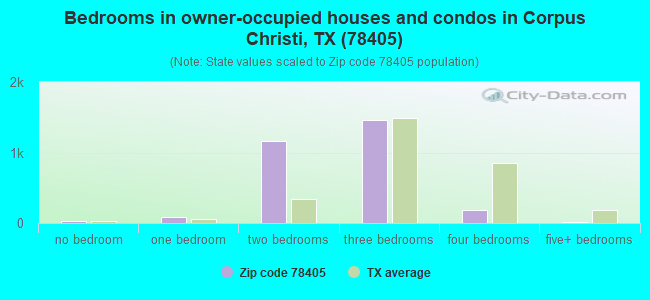
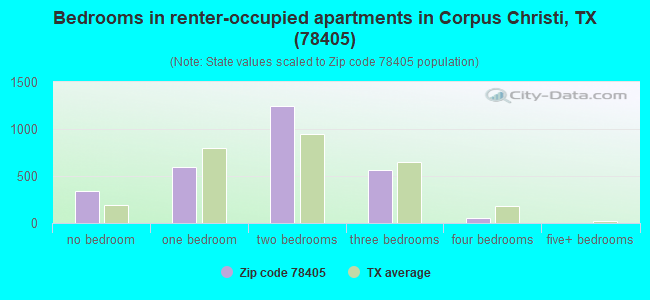
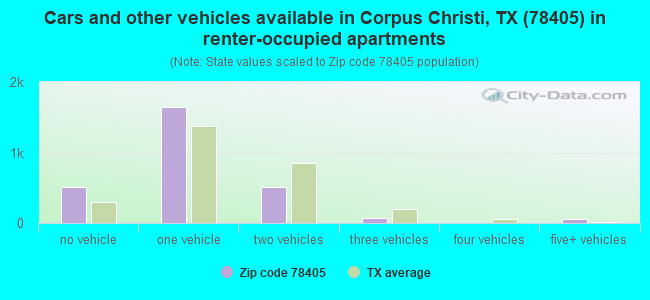
Houses and condos: 6,546 Renter-occupied apartments: 2,761
% of renters here:
48%
State:
38%
March 2022 cost of living index in zip code 78405: 85.1 (less than average, U.S. average is 100)
Land area: 5.1 sq. mi. Water area: 0.0 sq. mi.
Population density: 3,013 people per square mile
(average).
OSM Map
General Map
Google Map
MSN Map
OSM Map
General Map
Google Map
MSN Map
OSM Map
General Map
Google Map
MSN Map
OSM Map
General Map
Google Map
MSN Map
Please wait while loading the map...
Real estate property taxes paid for housing units in 2022:
This zip code:
1.5% ($1,235)
Texas:
1.5% ($4,050)
Median real estate property taxes paid for housing units with mortgages in 2022: $1,639 (1.5%) Median real estate property taxes paid for housing units with no mortgage in 2022: $1,151 (1.6%)
Averages for the 2020 tax year for zip code 78405, filed in 2021:
Average Adjusted Gross Income (AGI) in 2020: $27,565 (Individual Income Tax Returns)
Here:
$27,565
State:
$77,054
Salary/wage: $26,477 (reported on 82.8% of returns)
Here:
$26,477
State:
$62,766
(% of AGI for various income ranges: 1131.3% for AGIs below $25k, 3466.9% for AGIs $25k-50k, 6559.5% for AGIs $50k-75k, 10641.8% for AGIs $75k-100k, 17330.0% for AGIs $100k-200k)
Taxable interest for individuals: $395 (reported on 7.6% of returns)
This zip code:
$395
Texas:
$2,665
(% of AGI for various income ranges: 3.0% for AGIs below $25k, 4.3% for AGIs $25k-50k, 3.8% for AGIs $50k-75k, 8.2% for AGIs $75k-100k, 15.0% for AGIs $100k-200k)
Ordinary dividends: $467 (reported on 1.1% of returns)
Here:
$467
State:
$10,044
(% of AGI for various income ranges: 2.0% for AGIs $25k-50k)
Net capital gain/loss in AGI: +$3,820 (reported on 0.9% of returns)
Here:
+$3,820
State:
+$39,590
(% of AGI for various income ranges: 11.7% for AGIs $25k-50k, 7.2% for AGIs $50k-75k)
Profit/loss from business: +$6,985 (reported on 20.8% of returns)
Here:
+$6,985
State:
+$10,888
(% of AGI for various income ranges: 236.8% for AGIs below $25k, 102.2% for AGIs $25k-50k, 74.5% for AGIs $50k-75k, 368.2% for AGIs $75k-100k)
Taxable individual retirement arrangement distribution: $8,811 (reported on 1.6% of returns)
78405:
$8,811
Texas:
$24,740
(% of AGI for various income ranges: 10.8% for AGIs below $25k, 16.4% for AGIs $25k-50k, 74.0% for AGIs $50k-75k)
Total itemized deductions: $35,375 (reported on 1.4% of returns)
Here:
$35,375
State:
$40,428
(% of AGI for various income ranges: 99.3% for AGIs $25k-50k, 364.8% for AGIs $50k-75k)
Charity contributions: $6,175 (reported on 0.7% of returns)
Here:
$6,175
State:
$18,201
(% of AGI for various income ranges: 17.9% for AGIs $25k-50k)
Taxes paid: $4,100 (reported on 0.9% of returns)
78405:
$4,100
State:
$7,821
(% of AGI for various income ranges: 14.9% for AGIs $25k-50k)
Earned income credit: $2,878 (reported on 41.8% of returns)
Here:
$2,878
State:
$2,584
(% of AGI for various income ranges: 202.0% for AGIs below $25k, 115.9% for AGIs $25k-50k)
Percentage of individuals using paid preparers for their 2020 taxes: 92.2%
Here:
92%
State:
92%
(% for various income ranges: 90.8% for AGIs below $25k, 93.9% for AGIs $25k-50k, 94.0% for AGIs $50k-75k, 93.8% for AGIs $75k-100k, 100.0% for AGIs $100k-200k)
Averages for the 2012 tax year for zip code 78405, filed in 2013:
Average Adjusted Gross Income (AGI) in 2012: $24,557 (Individual Income Tax Returns)
Here:
$24,557
State:
$65,384
Salary/wage: $23,840 (reported on 88.0% of returns)
Here:
$23,840
State:
$52,524
(% of AGI for various income ranges: 81.8% for AGIs below $25k, 90.7% for AGIs $25k-50k, 92.3% for AGIs $50k-75k, 92.6% for AGIs $75k-100k, 55.9% for AGIs $100k-200k)
Taxable interest for individuals: $480 (reported on 6.9% of returns)
This zip code:
$480
Texas:
$2,372
(% of AGI for various income ranges: 0.2% for AGIs below $25k, 0.1% for AGIs $25k-50k, 0.4% for AGIs $75k-100k)
Ordinary dividends: $2,286 (reported on 1.2% of returns)
Here:
$2,286
State:
$9,721
Profit/loss from business: +$7,960 (reported on 15.8% of returns)
Here:
+$7,960
State:
+$13,732
(% of AGI for various income ranges: 12.0% for AGIs below $25k, 1.8% for AGIs $25k-50k, 1.5% for AGIs $50k-75k)
Taxable individual retirement arrangement distribution: $6,888 (reported on 1.4% of returns)
78405:
$6,888
Texas:
$19,511
Total itemized deductions: $19,050 (30% of AGI, reported on 5.5% of returns)
Here:
$19,050
State:
$24,724
Here:
29.7% of AGI
State:
15.9% of AGI
(% of AGI for various income ranges: 1.4% for AGIs below $25k, 4.3% for AGIs $25k-50k, 5.9% for AGIs $50k-75k, 11.4% for AGIs $75k-100k, 8.6% for AGIs $100k-200k)
Charity contributions: $3,455 (reported on 3.8% of returns)
Here:
$3,455
State:
$6,808
(% of AGI for various income ranges: 0.1% for AGIs below $25k, 0.6% for AGIs $25k-50k, 0.7% for AGIs $50k-75k, 1.6% for AGIs $75k-100k, 0.9% for AGIs $100k-200k)
Taxes paid: $3,553 (reported on 5.2% of returns)
78405:
$3,553
State:
$6,921
(% of AGI for various income ranges: 0.2% for AGIs below $25k, 0.7% for AGIs $25k-50k, 0.8% for AGIs $50k-75k, 2.2% for AGIs $75k-100k, 2.1% for AGIs $100k-200k)
Earned income credit: $2,846 (reported on 49.1% of returns)
Here:
$2,846
State:
$2,570
(% of AGI for various income ranges: 13.8% for AGIs below $25k, 2.3% for AGIs $25k-50k)
Percentage of individuals using paid preparers for their 2012 taxes: 55.5%
Here:
55%
State:
51%
(% for various income ranges: 54.0% for AGIs below $25k, 55.9% for AGIs $25k-50k, 60.0% for AGIs $50k-75k, 70.0% for AGIs $75k-100k, 83.3% for AGIs $100k-200k)
Averages for the 2004 tax year for zip code 78405, filed in 2005:
Average Adjusted Gross Income (AGI) in 2004: $17,818 (Individual Income Tax Returns)
Here:
$17,818
State:
$47,881
Salary/wage: $17,636 (reported on 89.3% of returns)
Here:
$17,636
State:
$41,947
(% of AGI for various income ranges: 84.9% for AGIs below $10k, 87.2% for AGIs $10k-25k, 91.4% for AGIs $25k-50k, 93.5% for AGIs $50k-75k, 65.5% for AGIs $75k-100k)
Taxable interest for individuals: $490 (reported on 8.7% of returns)
This zip code:
$490
Texas:
$2,255
(% of AGI for various income ranges: 0.4% for AGIs below $10k, 0.2% for AGIs $10k-25k, 0.2% for AGIs $25k-50k, 0.2% for AGIs $50k-75k, 0.3% for AGIs $75k-100k)
Taxable dividends: $463 (reported on 1.5% of returns)
Here:
$463
State:
$4,261
(% of AGI for various income ranges: 0.0% for AGIs below $10k, 0.1% for AGIs $10k-25k, 0.0% for AGIs $25k-50k, 0.1% for AGIs $50k-75k)
Net capital gain/loss: +$820 (reported on 1.1% of returns)
Here:
+$820
State:
+$16,110
Profit/loss from business: +$6,329 (reported on 11.6% of returns)
Here:
+$6,329
State:
+$11,013
(% of AGI for various income ranges: 12.2% for AGIs below $10k, 5.8% for AGIs $10k-25k, 1.6% for AGIs $25k-50k, -0.1% for AGIs $50k-75k)
IRA payment deduction: $1,882 (reported on 0.3% of returns)
78405:
$1,882
Texas:
$3,120
Total itemized deductions: $14,667 (36% of AGI, reported on 2.3% of returns)
Here:
$14,667
State:
$19,631
Here:
36.1% of AGI
State:
18.9% of AGI
Charity contributions deductions: $2,810 (7% of AGI, reported on 1.8% of returns)
Here:
$2,810
State:
$4,753
Here:
6.6% of AGI
State:
4.2% of AGI
Total tax: $1,708 (reported on 47.6% of returns)
78405:
$1,708
State:
$9,058
(% of AGI for various income ranges: 2.4% for AGIs below $10k, 2.8% for AGIs $10k-25k, 5.1% for AGIs $25k-50k, 8.4% for AGIs $50k-75k, 14.1% for AGIs $75k-100k)
Earned income credit: $2,147 (reported on 53.5% of returns)
Here:
$2,147
State:
$2,024
Percentage of individuals using paid preparers for their 2004 taxes: 61.8%
Here:
62%
State:
57%
(% for various income ranges: 59.3% for AGIs below $10k, 64.8% for AGIs $10k-25k, 58.3% for AGIs $25k-50k, 66.9% for AGIs $50k-75k, 59.0% for AGIs $75k-100k)
Likely homosexual households (counted as self-reported same-sex unmarried-partner households)
Lesbian couples: 0.0% of all households
Gay men: 0.4% of all households
Household received Food Stamps/SNAP in the past 12 months: 1,693 Household did not receive Food Stamps/SNAP in the past 12 months: 4,096
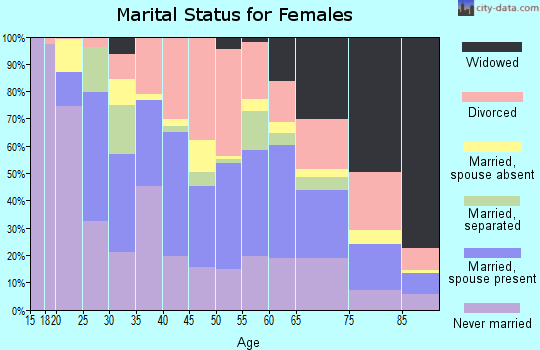
Women who had a birth in the past 12 months: 89 (33 now married, 54 unmarried) Women who did not have a birth in the past 12 months: 3,588 (1,376 now married, 2,217 unmarried)
Housing units in zip code 78405 with a mortgage: 654 (18 second mortgage, 20 both second mortgage and home equity loan) Median monthly owner costs for units with a mortgage: $1,023 Median monthly owner costs for units without a mortgage: $410
Residents with income below the poverty level in 2022:
This zip code:
34.2%
Whole state:
14.0%
Residents with income below 50% of the poverty level in 2022:
This zip code:
22.2%
Whole state:
7.4%
Median number of rooms in houses and condos:
Here:
4.8
State:
6.3
Median number of rooms in apartments:
Here:
4.0
State:
4.0
Notable locations in this zip code not listed on our city pages
Churches in zip code 78405 include: Calvary First Baptist Church (A), Saint Josephs Catholic Church (B), Templo Baptist Church (C), James Chapel Church of God in Christ (D), Seventh Day Church of God (E), Pentecostal Holiness Church (F), Monte Sion Pentecostal Church (G). Display/hide their locations on the map
Parks in zip code 78405 include: Wiggins Park (1), San Diego Park (2), Meadow Park (3), Elgin Park (4), Lawson Park (5), Airport Park (6). Display/hide their locations on the map
1,101 married couples with children.
1,617 single-parent households (130 men, 1,487 women).
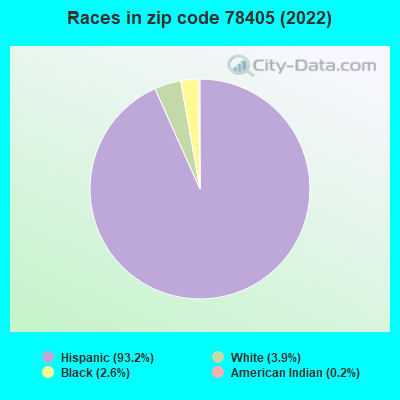
49.0% of residents of 78405 zip code speak English at home.
51.7% of residents speak Spanish at home (75% very well, 17% well, 4% not well, 3% not at all).
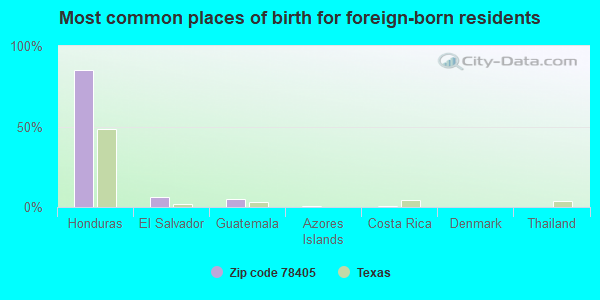
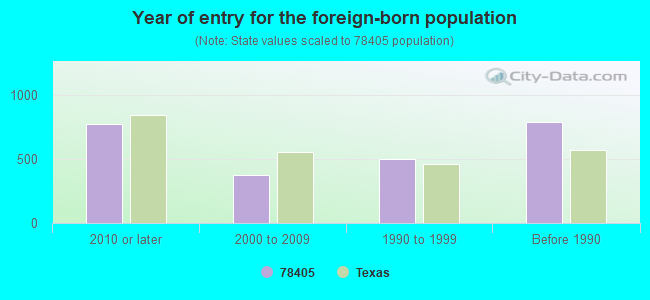
Foreign born population: 2,355 (15.4%) (14.6% of them are naturalized citizens)
Facilities with environmental interests located in this zip code:
ANDERSON WEST INC (4615 BALDWIN in CORPUS CHRISTI, TX)
(Resource Conservation and Recovery Act (tracking hazardous waste))
ACME CLEANERS (2847 SOUTH PORT AVENUE in CORPUS CHRISTI, TX)
AIR MINOR (AIRS/AFS) Business SIC classification: DRYCLEANING PLANTS, EXCEPT RUG CLEANING
AIRGAS SOUTHWEST (4817 AGNES in CORPUS CHRISTI, TX)
TRI REPORTER (Tracking of toxic chemicals releasing facilities) Business SIC classification: INDUSTRIAL GASES; CHEMICALS AND ALLIED PRODUCTS
Housing units lacking complete plumbing facilities: 4.8% Housing units lacking complete kitchen facilities: 6.5%
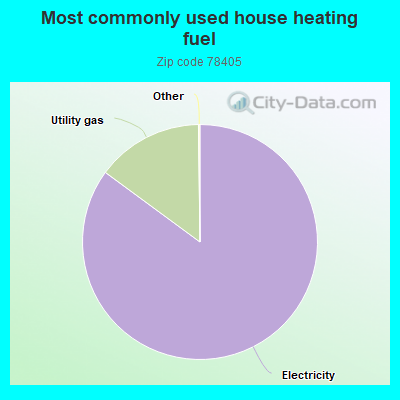
85.1%Electricity
14.7%Utility gas
Population in 1990: 17,437.
Place of birth for U.S.-born residents:
This state: 12,019
Northeast: 133
Midwest: 140
South: 213
West: 209
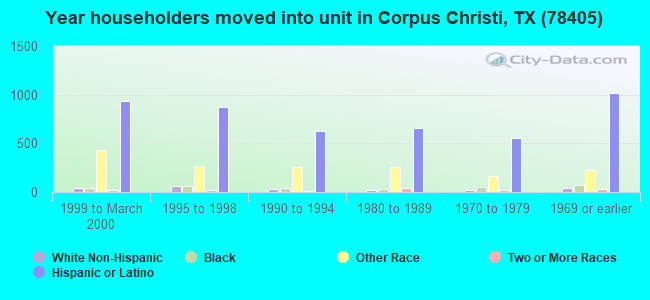
66% of the 78405 zip code residents lived in the same house 5 years ago. Out of people who lived in different houses, 78% lived in this county. Out of people who lived in different counties, 50% lived in Texas.
92% of the 78405 zip code residents lived in the same house 1 year ago. Out of people who lived in different houses, 77% moved from this county. Out of people who lived in different houses, 6% moved from different county within same state. Out of people who lived in different houses, 6% moved from different state. Out of people who lived in different houses, 8% moved from abroad.
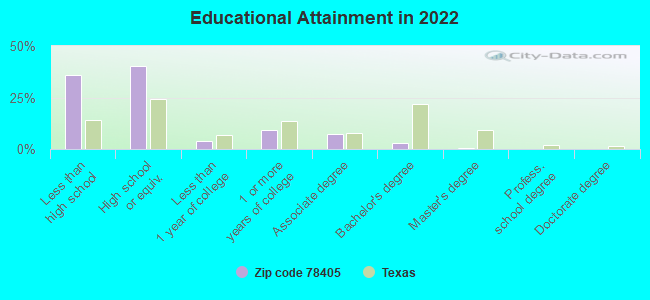
Private vs. public school enrollment:
Students in private schools in grades 1 to 8 (elementary and middle school): 39
Here:
2.5%
Texas:
8.8%
Students in private schools in grades 9 to 12 (high school): 40
Here:
3.5%
Texas:
8.0%
Students in private undergraduate colleges: 25
Here:
4.6%
Texas:
16.2%
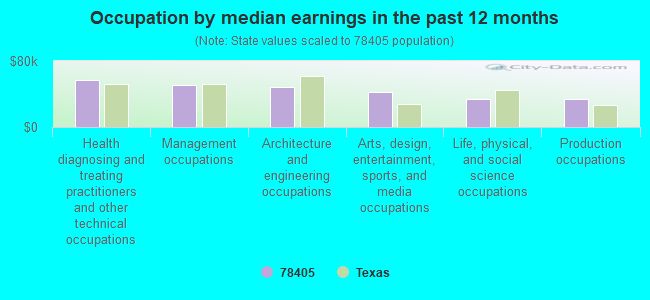
Occupation by median earnings in the past 12 months ($)
57,236Health diagnosing and treating practitioners and other technical occupations
50,496Management occupations
48,567Architecture and engineering occupations
42,067Arts, design, entertainment, sports, and media occupations
33,975Life, physical, and social science occupations
33,631Production occupations
Companies with biggest federal contracts located in this zip code (CORPUS CHRISTI, TX):
GRACE PAVING AND CONSTRUCTION, (4237 BALDWIN BLVD; small business) : $12,849,960 in 301 contractsfrom 2000 to 2006
Contracts for Maintenance, Repair or Alteration of Real Property -- Airport Runways, Construction of Structures and Facilities -- Airport Runways, Maintenance, Repair or Alteration of Real Property -- Airport Service Roads, Maintenance, Repair or Alteration of Real Property -- Parking Facilities Conservation, and moreby Navy, National Park Service Signed by year:2000: $1,989,655; 2001: $3,181,192; 2002: $2,251,312; 2003: $1,569,508; 2004: $288,421; 2005: $3,298,749; 2006: $271,123.
Biggest contracts:
$1,989,655 with Navy for Maintenance, Repair or Alteration of Real Property -- Airport Runways. Signed on 2000-10-01. Completion date: 2001-04-08.
$633,664 with Navy for Construction of Structures and Facilities -- Airport Runways. Signed on 2002-09-30. Completion date: 2003-07-12.
$544,873 with Navy for Maintenance, Repair or Alteration of Real Property -- Airport Service Roads. Signed on 2001-10-01. Completion date: 2002-03-23.
$418,375 with Navy for Maintenance, Repair or Alteration of Real Property -- Parking Facilities Conservation. Signed on 2001-09-10. Completion date: 2001-11-10.
DIFCO INC (2728 AGNES ST; small business) : $8,703,089 in 5 contractsfrom 2000 to 2004
Contracts for Fuel Oils, Liquid Propellants and Fuels, Petroleum Base, Petroleum Production and Distribution Equipment by Defense Logistics Agency, Navy Signed by year:2000: $1,767,014; 2001: $1,110,568; 2002: $2,768,932; 2003: $0; 2004: $3,056,575; 2005: $0; 2006: $0.
Biggest contracts:
$3,056,575 with Defense Logistics Agency for Fuel Oils. Signed on 2004-05-24. Completion date: 2006-04-30.
$2,768,932, same as above.Signed on 2002-04-01. Completion date: 2004-03-31.
$1,767,014, same as above.Signed on 2000-03-20. Completion date: 2002-04-30.
$798,568 with Defense Logistics Agency for Liquid Propellants and Fuels, Petroleum Base. Signed on 2001-06-01. Completion date: 2004-05-31.
A. ORTIZ PAVING & CONSTRUCTION (102 AIRPORT ROAD; small business) : $4,584,286 in 241 contractsfrom 1999 to 2002
Contracts for Maintenance, Repair or Alteration of Real Property -- Highways, Roads, Streets, Bridges, and Railways (includes resurfacing), Maintenance, Repair or Alteration of Real Property -- Airport Runways, Maintenance, Repair or Alteration of Real Property -- Office Buildings, Maintenance, Repair or Alteration of Real Property -- Miscellaneous Buildings, and moreby Navy Signed by year:2000: $2,875,322; 2001: $258,072; 2002: $80,085; 2003: $0; 2004: $0; 2005: $0; 2006: $0.
Biggest contracts:
$348,060 with Navy for Maintenance, Repair or Alteration of Real Property -- Highways, Roads, Streets, Bridges, and Railways (includes resurfacing). Signed on 2000-10-01. Completion date: 2000-10-26.
$176,029, same as above.Signed on 2000-10-01. Completion date: 2000-08-26.
$146,514, same as above.Signed on 1999-10-01. Completion date: 1999-11-30.
$127,880, same as above.Signed on 2000-10-01. Completion date: 2000-11-29.
ROSARIO C CARRIZO (702 S PORT; small business) : $2,602,548 in 9 contractsfrom 2002 to 2005
Contracts for Food Services by Navy Signed by year:2000: $0; 2001: $0; 2002: $579,697; 2003: $631,711; 2004: $687,908; 2005: $703,232; 2006: $0.
Biggest contracts:
$678,750 with Navy for Food Services. Taking place in CA. Signed on 2005-09-16. Completion date: 2005-09-30.
$677,441, same as above.Signed on 2004-10-01. Completion date: 2004-09-30.
$596,578, same as above.Signed on 2003-09-26. Completion date: 2004-09-30.
$579,697, same as above.Signed on 2002-10-01. Completion date: 2003-09-30.
COLUMBUS MC KINNON CORPORATION (4230 BEACON ST) : $777,224 in 19 contractsfrom 2004 to 2006
Contracts for Blocks, Tackle, Rigging, and Slings, Winches, Hoists, Cranes, and Derricks, Miscellaneous Materials Handling Equipment, Maintenance, Repair and Rebuilding of Equipment -- Maintenance and Repair Shop Equipment, and moreby Army, U.S. Army Corps of Engineers - civil program financing only, Defense Logistics Agency, Navy, and others Signed by year:2000: $0; 2001: $0; 2002: $0; 2003: $0; 2004: $257,035; 2005: $461,736; 2006: $58,453.
Biggest contracts:
$323,965 with Army for Blocks, Tackle, Rigging, and Slings. Signed on 2005-06-10. Completion date: 2005-12-22.
$189,602 with Army for Winches, Hoists, Cranes, and Derricks. Signed on 2004-06-04. Completion date: 2004-12-03.
$88,000, same as above.Signed on 2005-04-12. Completion date: 2005-06-10.
$23,933 with Army for Miscellaneous Materials Handling Equipment. Signed on 2006-05-08. Completion date: 2006-06-09.
GOODWILL INDUSTRIES OF SOUTH T (2961 S PORT AVE) : $548,274 in 12 contractsfrom 2002 to 2006
Contracts for Specialized Shipping and Storage Containers, Boxes, Cartons, and Crates, Miscellaneous Fabricated Nonmetallic Materials by Army Signed by year:2000: $0; 2001: $0; 2002: $28,750; 2003: $0; 2004: $178,324; 2005: $229,872; 2006: $111,328.
Biggest contracts:
$112,302 with Army for Specialized Shipping and Storage Containers. Signed on 2005-05-10. Completion date: 2005-09-15.
$111,710, same as above.Signed on 2004-03-17. Completion date: 2004-09-10.
$111,328, same as above.Signed on 2006-04-05. Completion date: 2006-02-03.
$69,580, same as above.Signed on 2005-11-22. Completion date: 2006-02-03.
AIRGAS-SOUTHWEST INC (4817 AGNES ST; small business) : $461,480 in 41 contractsfrom 2000 to 2006
Contracts for Gases: Compressed and Liquefied, Miscellaneous Construction Equipment, Drugs and Biologicals, Safety and Rescue Equipment, and moreby Army, Department of Veterans Affairs, Navy, Indian Affairs (Assistant Secretary), and others Signed by year:2000: $57,464; 2001: $0; 2002: $77,096; 2003: $74,892; 2004: $130,666; 2005: $103,988; 2006: $17,374.
Biggest contracts:
$77,096 with Army for Gases: Compressed and Liquefied. Signed on 2002-04-02. Completion date: 2005-03-31.
$50,656, same as above.Signed on 2003-03-24. Completion date: 2005-03-31.
$36,443 with Army for Miscellaneous Construction Equipment. Signed on 2005-08-11. Completion date: 2005-09-16.
$31,915 with Army for Gases: Compressed and Liquefied. Signed on 2004-04-28. Completion date: 2005-03-31.
PREMIER SHIELDING COMPANY INC (310 CENTAURUS ST; small business) : $303,032 in 29 contractsfrom 2001 to 2006
Contracts for Miscellaneous Electrical and Electronic Components, Refrigeration and Air Conditioning Components by Defense Logistics Agency, Army Signed by year:2000: $0; 2001: $25,142; 2002: $71,571; 2003: $0; 2004: $113,113; 2005: $59,392; 2006: $33,814.
Biggest contracts:
$67,325 with Defense Logistics Agency for Miscellaneous Electrical and Electronic Components. Signed on 2002-01-08. Completion date: 2002-03-12.
$38,442, same as above.Signed on 2004-11-19. Completion date: 2005-03-16.
$31,227, same as above.Signed on 2004-02-10. Completion date: 2004-04-02.
$30,550, same as above.Signed on 2004-11-08. Completion date: 2005-02-01.
SOUTHWEST SERVICES (341 44TH ST; small business)
$185,740 with Defense Logistics Agency for Fuel Oils. Signed on 2000-03-20. Completion date: 2002-04-30.
LEONCITOS, INC (410 S PADRE ISLAND DRIVE #; small business) : $153,429 in 6 contractsfrom 2005 to 2006
Contracts for Maintenance, Repair or Alteration of Real Property -- Miscellaneous Buildings, Maintenance, Repair or Alteration of Real Property -- Office Buildings by Navy, Public Buildings Service Signed by year:2000: $0; 2001: $0; 2002: $0; 2003: $0; 2004: $0; 2005: $9,500; 2006: $143,929.
Biggest contracts:
$58,521 with Navy for Maintenance, Repair or Alteration of Real Property -- Miscellaneous Buildings. Signed on 2006-03-27. Completion date: 2006-05-12.
$38,984 with Navy for Maintenance, Repair or Alteration of Real Property -- Office Buildings. Signed on 2006-05-23. Completion date: 2006-06-26.
$21,498 with Navy for Maintenance, Repair or Alteration of Real Property -- Miscellaneous Buildings. Signed on 2006-05-23. Completion date: 2006-06-02.
$12,978, same as above.Signed on 2006-05-23. Completion date: 2006-06-26.
Top industries in this zip code by the number of employees in 2005:
Health Care and Social Assistance: General Medical and Surgical Hospitals (over 1000 employees: 1 establishment)
Mining: Drilling Oil and Gas Wells (250-499: 1, 20-49: 1)
2002 - 2018 National Fire Incident Reporting System (NFIRS) incidents
Based on the data from the years 2002 - 2018 the average number of fires per year is 54. The highest number of fire incidents - 74 took place in 2002, and the least - 25 in 2015. The data has a declining trend.
When looking into fire subcategories, the most incidents belonged to: Outside Fires (44.6%), and Structure Fires (29.0%).
Fire incident types reported to NFIRS in Zip Code 78405


 Nearest zip codes: 78408, 78416, 78407, 78404, 78417, 78401.
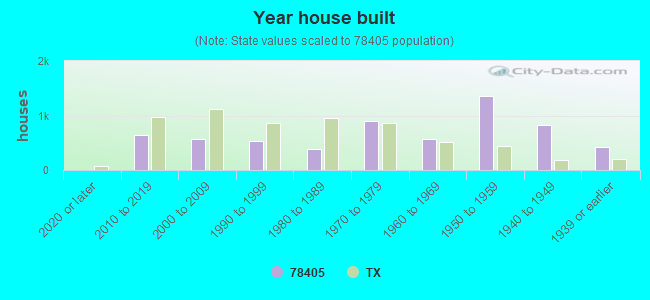


 Based on the data from the years 2002 - 2018 the average number of fires per year is 54. The highest number of fire incidents - 74 took place in 2002, and the least - 25 in 2015. The data has a declining trend.
 When looking into fire subcategories, the most incidents belonged to: Outside Fires (44.6%), and Structure Fires (29.0%).