Estimated zip code population in 2022: 36,711 Zip code population in 2010: 36,953 Zip code population in 2000: 34,572
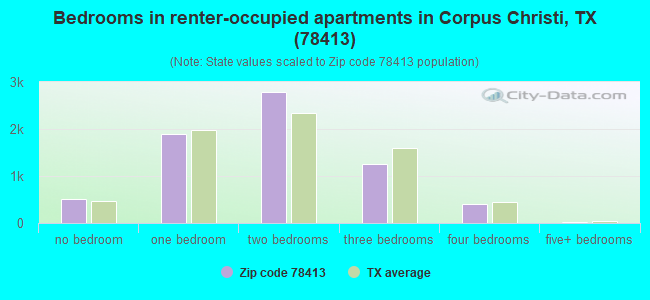
Houses and condos: 16,075 Renter-occupied apartments: 6,869
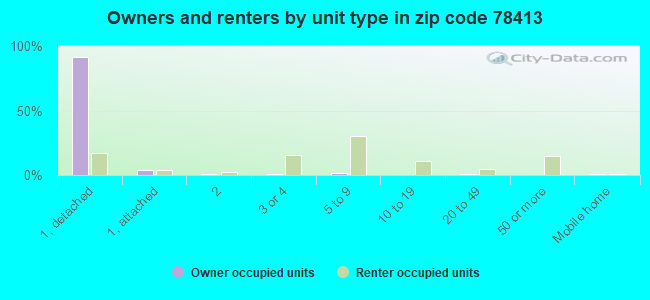
% of renters here:
46%
State:
38%
March 2022 cost of living index in zip code 78413: 87.1 (less than average, U.S. average is 100)
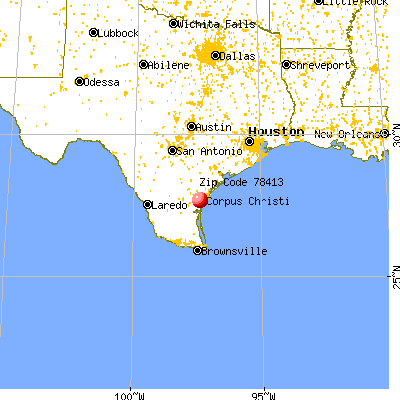
Land area: 8.0 sq. mi. Water area: 0.1 sq. mi.
Population density: 4,574 people per square mile
(average).
OSM Map
General Map
Google Map
MSN Map
OSM Map
General Map
Google Map
MSN Map
OSM Map
General Map
Google Map
MSN Map
OSM Map
General Map
Google Map
MSN Map
Please wait while loading the map...
Real estate property taxes paid for housing units in 2022:
This zip code:
1.6% ($4,108)
Texas:
1.5% ($4,050)
Median real estate property taxes paid for housing units with mortgages in 2022: $4,687 (1.8%) Median real estate property taxes paid for housing units with no mortgage in 2022: $3,152 (1.4%)
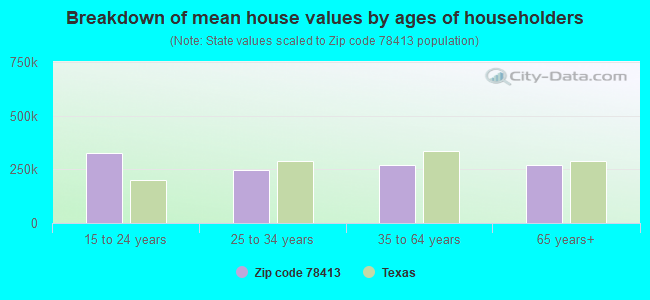
Estimated median house/condo value in 2022: $250,637
78413:
$250,637
Texas:
$275,400
According to our research of Texas and other state lists, there were 52 registered sex offenders living in 78413 zip code as of April 27, 2024. The ratio of all residents to sex offenders in zip code 78413 is 766 to 1. The ratio of registered sex offenders to all residents in this zip code is lower than the state average.
Median resident age:
This zip code:
35.7 years
Texas median age:
35.6 years
Average household size:
This zip code:
2.4 people
Texas:
2.6 people
Averages for the 2020 tax year for zip code 78413, filed in 2021:
Average Adjusted Gross Income (AGI) in 2020: $67,043 (Individual Income Tax Returns)
Here:
$67,043
State:
$77,054
Salary/wage: $54,233 (reported on 83.5% of returns)
Here:
$54,233
State:
$62,766
(% of AGI for various income ranges: 1201.4% for AGIs below $25k, 3516.9% for AGIs $25k-50k, 6307.5% for AGIs $50k-75k, 9298.1% for AGIs $75k-100k, 17512.2% for AGIs $100k-200k, 68360.5% for AGIs over 200k)
Taxable interest for individuals: $2,067 (reported on 25.2% of returns)
This zip code:
$2,067
Texas:
$2,665
(% of AGI for various income ranges: 13.0% for AGIs below $25k, 18.3% for AGIs $25k-50k, 44.5% for AGIs $50k-75k, 86.7% for AGIs $75k-100k, 141.4% for AGIs $100k-200k, 2089.5% for AGIs over 200k)
Ordinary dividends: $8,218 (reported on 12.8% of returns)
Here:
$8,218
State:
$10,044
(% of AGI for various income ranges: 10.4% for AGIs below $25k, 17.5% for AGIs $25k-50k, 59.2% for AGIs $50k-75k, 121.5% for AGIs $75k-100k, 311.1% for AGIs $100k-200k, 5349.5% for AGIs over 200k)
Net capital gain/loss in AGI: +$18,309 (reported on 12.5% of returns)
Here:
+$18,309
State:
+$39,590
(% of AGI for various income ranges: 4.8% for AGIs below $25k, 16.2% for AGIs $25k-50k, 54.5% for AGIs $50k-75k, 161.8% for AGIs $75k-100k, 409.1% for AGIs $100k-200k, 15875.8% for AGIs over 200k)
Profit/loss from business: +$11,628 (reported on 18.2% of returns)
Here:
+$11,628
State:
+$10,888
(% of AGI for various income ranges: 72.4% for AGIs below $25k, 58.8% for AGIs $25k-50k, 81.7% for AGIs $50k-75k, 266.2% for AGIs $75k-100k, 587.6% for AGIs $100k-200k, 9623.7% for AGIs over 200k)
Taxable individual retirement arrangement distribution: $20,581 (reported on 7.0% of returns)
78413:
$20,581
Texas:
$24,740
(% of AGI for various income ranges: 29.0% for AGIs below $25k, 71.3% for AGIs $25k-50k, 131.2% for AGIs $50k-75k, 314.4% for AGIs $75k-100k, 587.4% for AGIs $100k-200k, 3554.7% for AGIs over 200k)
Self-employed (Keogh) retirement plans: $23,729 (reported on 0.4% of returns)
78413:
$23,729
Texas:
$29,298
(% of AGI for various income ranges: 27.3% for AGIs $75k-100k, 718.9% for AGIs over 200k)
Total itemized deductions: $38,188 (reported on 6.2% of returns)
Here:
$38,188
State:
$40,428
(% of AGI for various income ranges: 21.3% for AGIs below $25k, 98.1% for AGIs $25k-50k, 258.6% for AGIs $50k-75k, 559.2% for AGIs $75k-100k, 846.2% for AGIs $100k-200k, 6896.3% for AGIs over 200k)
Charity contributions: $15,457 (reported on 4.8% of returns)
Here:
$15,457
State:
$18,201
(% of AGI for various income ranges: 1.8% for AGIs below $25k, 15.9% for AGIs $25k-50k, 30.9% for AGIs $50k-75k, 86.0% for AGIs $75k-100k, 222.1% for AGIs $100k-200k, 3980.5% for AGIs over 200k)
Taxes paid: $6,981 (reported on 5.8% of returns)
78413:
$6,981
State:
$7,821
(% of AGI for various income ranges: 3.3% for AGIs below $25k, 16.8% for AGIs $25k-50k, 42.8% for AGIs $50k-75k, 101.9% for AGIs $75k-100k, 168.6% for AGIs $100k-200k, 977.4% for AGIs over 200k)
Earned income credit: $2,344 (reported on 17.7% of returns)
Here:
$2,344
State:
$2,584
(% of AGI for various income ranges: 102.5% for AGIs below $25k, 68.3% for AGIs $25k-50k, 0.8% for AGIs $50k-75k)
Percentage of individuals using paid preparers for their 2020 taxes: 91.7%
Here:
92%
State:
92%
(% for various income ranges: 92.2% for AGIs below $25k, 93.7% for AGIs $25k-50k, 91.4% for AGIs $50k-75k, 89.3% for AGIs $75k-100k, 89.8% for AGIs $100k-200k, 88.4% for AGIs over 200k)
Averages for the 2012 tax year for zip code 78413, filed in 2013:
Average Adjusted Gross Income (AGI) in 2012: $63,721 (Individual Income Tax Returns)
Here:
$63,721
State:
$65,384
Salary/wage: $52,427 (reported on 86.8% of returns)
Here:
$52,427
State:
$52,524
(% of AGI for various income ranges: 82.7% for AGIs below $25k, 82.8% for AGIs $25k-50k, 81.0% for AGIs $50k-75k, 79.2% for AGIs $75k-100k, 77.2% for AGIs $100k-200k, 45.1% for AGIs over 200k)
Taxable interest for individuals: $1,936 (reported on 29.5% of returns)
This zip code:
$1,936
Texas:
$2,372
(% of AGI for various income ranges: 0.9% for AGIs below $25k, 0.7% for AGIs $25k-50k, 0.7% for AGIs $50k-75k, 0.7% for AGIs $75k-100k, 0.7% for AGIs $100k-200k, 1.4% for AGIs over 200k)
Ordinary dividends: $7,580 (reported on 14.1% of returns)
Here:
$7,580
State:
$9,721
(% of AGI for various income ranges: 1.1% for AGIs below $25k, 0.8% for AGIs $25k-50k, 0.9% for AGIs $50k-75k, 0.9% for AGIs $75k-100k, 1.2% for AGIs $100k-200k, 3.8% for AGIs over 200k)
Net capital gain/loss in AGI: +$15,417 (reported on 12.1% of returns)
Here:
+$15,417
State:
+$35,319
(% of AGI for various income ranges: 0.3% for AGIs $25k-50k, 0.4% for AGIs $50k-75k, 0.6% for AGIs $75k-100k, 1.2% for AGIs $100k-200k, 10.1% for AGIs over 200k)
Profit/loss from business: +$15,382 (reported on 15.9% of returns)
Here:
+$15,382
State:
+$13,732
(% of AGI for various income ranges: 6.1% for AGIs below $25k, 2.8% for AGIs $25k-50k, 2.0% for AGIs $50k-75k, 2.3% for AGIs $75k-100k, 3.6% for AGIs $100k-200k, 6.0% for AGIs over 200k)
Taxable individual retirement arrangement distribution: $16,441 (reported on 7.6% of returns)
78413:
$16,441
Texas:
$19,511
(% of AGI for various income ranges: 1.7% for AGIs below $25k, 1.6% for AGIs $25k-50k, 1.7% for AGIs $50k-75k, 2.1% for AGIs $75k-100k, 2.5% for AGIs $100k-200k, 1.7% for AGIs over 200k)
Self-employment retirement plans: $23,980 (reported on 0.6% of returns)
78413:
$23,980
Texas:
$23,938
(% of AGI for various income ranges: 0.4% for AGIs below $25k, 0.1% for AGIs $100k-200k, 0.6% for AGIs over 200k)
Total itemized deductions: $21,230 (17% of AGI, reported on 27.7% of returns)
Here:
$21,230
State:
$24,724
Here:
17.0% of AGI
State:
15.9% of AGI
(% of AGI for various income ranges: 5.2% for AGIs below $25k, 8.0% for AGIs $25k-50k, 11.2% for AGIs $50k-75k, 11.7% for AGIs $75k-100k, 10.1% for AGIs $100k-200k, 7.3% for AGIs over 200k)
Charity contributions: $5,519 (reported on 22.7% of returns)
Here:
$5,519
State:
$6,808
(% of AGI for various income ranges: 0.5% for AGIs below $25k, 1.0% for AGIs $25k-50k, 1.6% for AGIs $50k-75k, 2.0% for AGIs $75k-100k, 2.2% for AGIs $100k-200k, 2.9% for AGIs over 200k)
Taxes paid: $5,783 (reported on 27.3% of returns)
78413:
$5,783
State:
$6,921
(% of AGI for various income ranges: 1.0% for AGIs below $25k, 1.9% for AGIs $25k-50k, 2.7% for AGIs $50k-75k, 3.0% for AGIs $75k-100k, 3.1% for AGIs $100k-200k, 2.0% for AGIs over 200k)
Earned income credit: $2,276 (reported on 17.1% of returns)
Here:
$2,276
State:
$2,570
(% of AGI for various income ranges: 6.8% for AGIs below $25k, 1.0% for AGIs $25k-50k)
Percentage of individuals using paid preparers for their 2012 taxes: 48.8%
Here:
49%
State:
51%
(% for various income ranges: 41.7% for AGIs below $25k, 45.7% for AGIs $25k-50k, 53.5% for AGIs $50k-75k, 53.8% for AGIs $75k-100k, 56.9% for AGIs $100k-200k, 78.6% for AGIs over 200k)
Averages for the 2004 tax year for zip code 78413, filed in 2005:
Average Adjusted Gross Income (AGI) in 2004: $52,561 (Individual Income Tax Returns)
Here:
$52,561
State:
$47,881
Salary/wage: $45,216 (reported on 87.0% of returns)
Here:
$45,216
State:
$41,947
(% of AGI for various income ranges: 126.0% for AGIs below $10k, 81.7% for AGIs $10k-25k, 84.1% for AGIs $25k-50k, 81.7% for AGIs $50k-75k, 82.9% for AGIs $75k-100k, 63.2% for AGIs over 100k)
Taxable interest for individuals: $1,844 (reported on 39.0% of returns)
This zip code:
$1,844
Texas:
$2,255
(% of AGI for various income ranges: 5.2% for AGIs below $10k, 1.5% for AGIs $10k-25k, 1.1% for AGIs $25k-50k, 1.2% for AGIs $50k-75k, 1.1% for AGIs $75k-100k, 1.5% for AGIs over 100k)
Taxable dividends: $3,689 (reported on 21.4% of returns)
Here:
$3,689
State:
$4,261
(% of AGI for various income ranges: 3.9% for AGIs below $10k, 1.2% for AGIs $10k-25k, 0.8% for AGIs $25k-50k, 0.8% for AGIs $50k-75k, 0.8% for AGIs $75k-100k, 2.3% for AGIs over 100k)
Net capital gain/loss: +$9,593 (reported on 18.5% of returns)
Here:
+$9,593
State:
+$16,110
(% of AGI for various income ranges: -1.0% for AGIs below $10k, 0.4% for AGIs $10k-25k, 0.4% for AGIs $25k-50k, 0.7% for AGIs $50k-75k, 0.6% for AGIs $75k-100k, 7.1% for AGIs over 100k)
Profit/loss from business: +$15,360 (reported on 17.0% of returns)
Here:
+$15,360
State:
+$11,013
(% of AGI for various income ranges: 2.8% for AGIs below $10k, 3.9% for AGIs $10k-25k, 3.2% for AGIs $25k-50k, 2.8% for AGIs $50k-75k, 2.9% for AGIs $75k-100k, 7.5% for AGIs over 100k)
IRA payment deduction: $3,276 (reported on 2.6% of returns)
78413:
$3,276
Texas:
$3,120
(% of AGI for various income ranges: 0.3% for AGIs below $10k, 0.1% for AGIs $10k-25k, 0.2% for AGIs $25k-50k, 0.2% for AGIs $50k-75k, 0.1% for AGIs $75k-100k, 0.1% for AGIs over 100k)
Self-employed pension: $16,693 (reported on 1.0% of returns)
Here:
$16,693
Texas:
$16,401
(% of AGI for various income ranges: 0.1% for AGIs $25k-50k, 0.1% for AGIs $50k-75k, 0.1% for AGIs $75k-100k, 0.6% for AGIs over 100k)
Total itemized deductions: $17,999 (19% of AGI, reported on 31.8% of returns)
Here:
$17,999
State:
$19,631
Here:
19.1% of AGI
State:
18.9% of AGI
(% of AGI for various income ranges: 11.0% for AGIs below $10k, 6.8% for AGIs $10k-25k, 10.2% for AGIs $25k-50k, 13.1% for AGIs $50k-75k, 12.5% for AGIs $75k-100k, 10.4% for AGIs over 100k)
Charity contributions deductions: $4,358 (4% of AGI, reported on 27.4% of returns)
Here:
$4,358
State:
$4,753
Here:
4.4% of AGI
State:
4.2% of AGI
(% of AGI for various income ranges: 0.7% for AGIs below $10k, 0.6% for AGIs $10k-25k, 1.2% for AGIs $25k-50k, 2.0% for AGIs $50k-75k, 2.1% for AGIs $75k-100k, 3.1% for AGIs over 100k)
Total tax: $9,095 (reported on 75.9% of returns)
78413:
$9,095
State:
$9,058
(% of AGI for various income ranges: 3.0% for AGIs below $10k, 4.0% for AGIs $10k-25k, 7.2% for AGIs $25k-50k, 9.2% for AGIs $50k-75k, 10.8% for AGIs $75k-100k, 19.5% for AGIs over 100k)
Earned income credit: $1,860 (reported on 15.3% of returns)
Here:
$1,860
State:
$2,024
Percentage of individuals using paid preparers for their 2004 taxes: 52.5%
Here:
53%
State:
57%
(% for various income ranges: 43.4% for AGIs below $10k, 54.1% for AGIs $10k-25k, 51.6% for AGIs $25k-50k, 51.8% for AGIs $50k-75k, 53.7% for AGIs $75k-100k, 65.8% for AGIs over 100k)
Likely homosexual households (counted as self-reported same-sex unmarried-partner households)
Lesbian couples: 0.2% of all households
Gay men: 0.1% of all households
Household received Food Stamps/SNAP in the past 12 months: 1,987 Household did not receive Food Stamps/SNAP in the past 12 months: 13,013
Women who had a birth in the past 12 months: 342 (256 now married, 87 unmarried) Women who did not have a birth in the past 12 months: 9,141 (3,538 now married, 5,617 unmarried)
Housing units in zip code 78413 with a mortgage: 4,982 (173 second mortgage, 13 home equity loan, 128 both second mortgage and home equity loan) Houses without a mortgage: 24
Median monthly owner costs for units with a mortgage: $1,927 Median monthly owner costs for units without a mortgage: $771
Residents with income below the poverty level in 2022:
This zip code:
12.5%
Whole state:
14.0%
Residents with income below 50% of the poverty level in 2022:
This zip code:
4.2%
Whole state:
7.4%
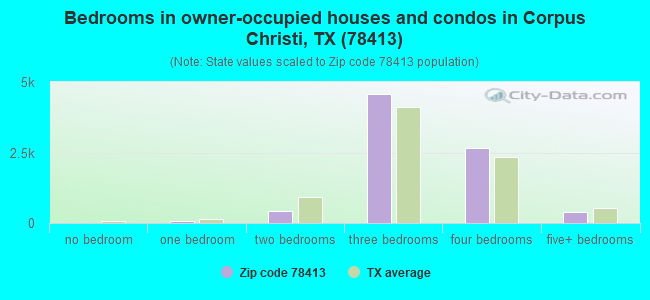
Median number of rooms in houses and condos:
Here:
6.2
State:
6.3
Median number of rooms in apartments:
Here:
3.9
State:
4.0
Notable locations in this zip code not listed on our city pages
Notable locations in zip code 78413: Corpus Christi Fire Department Station 14 (A), Corpus Christi Fire Department Station 6 (B). Display/hide their locations on the map
Churches in zip code 78413 include: Saint Paul United Church of Christ (A), Church of Christ - Lakeview (B), Yorktown Baptist Church (C), Trinity Church of the Nazarene (D). Display/hide their locations on the map
Parks in zip code 78413 include: Snead Park (1), Schanen Park (2), Saint Andrews Park (3), Ridgewood Park (4), Middlecoff Park (5), Winrock Park (6), Congress Park (7), Country Club Park (8), Acushnet Park (9). Display/hide their locations on the map
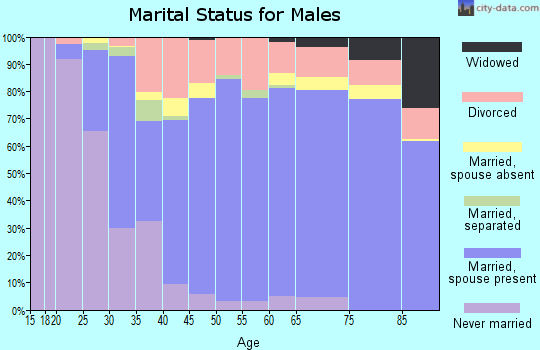
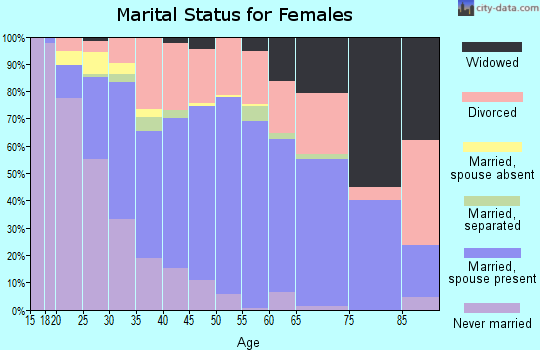
4,615 married couples with children.
1,535 single-parent households (372 men, 1,163 women).
74.5% of residents of 78413 zip code speak English at home.
22.2% of residents speak Spanish at home (81% very well, 15% well, 3% not well, 2% not at all).
0.9% of residents speak other Indo-European language at home (88% very well, 11% well, 1% not well).
1.9% of residents speak Asian or Pacific Island language at home (74% very well, 18% well, 8% not well).
0.9% of residents speak other language at home (98% very well, 2% well).
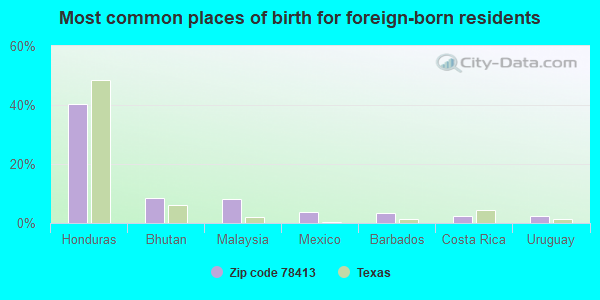
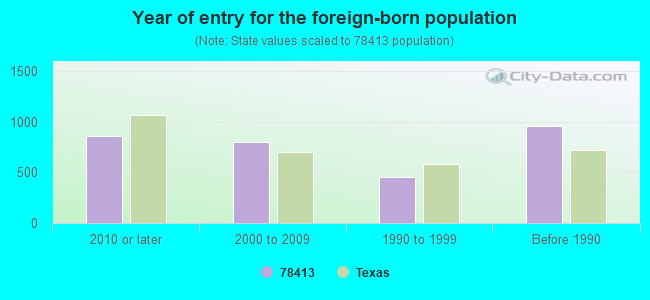
Foreign born population: 2,685 (7.3%) (54.5% of them are naturalized citizens)
Facilities with environmental interests located in this zip code:
AUTO CRAFTERS (3809 APOLLO in CORPUS CHRISTI, TX)
(Resource Conservation and Recovery Act (tracking hazardous waste))
Housing units lacking complete plumbing facilities: 0.6% Housing units lacking complete kitchen facilities: 1.6%
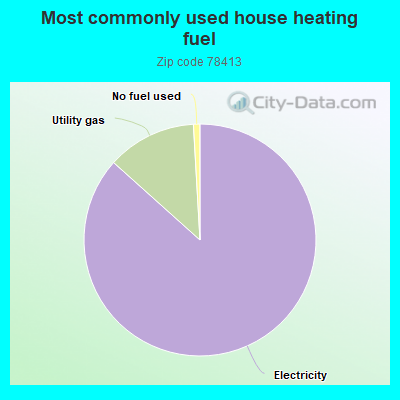
86.3%Electricity
12.4%Utility gas
0.9%No fuel used
Population in 1990: 27,278. Population change in the 1990s: +7,294 (+26.7%).
Place of birth for U.S.-born residents:
This state: 27,471
Northeast: 755
Midwest: 1,707
South: 1,891
West: 1,550
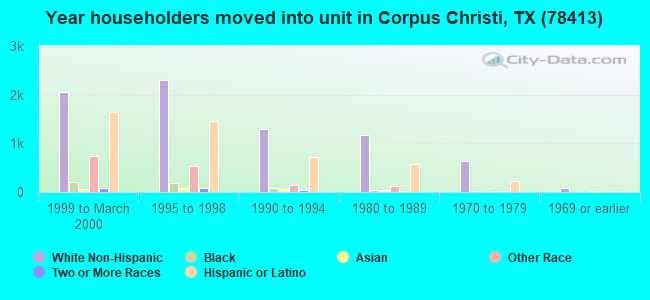
46% of the 78413 zip code residents lived in the same house 5 years ago. Out of people who lived in different houses, 58% lived in this county. Out of people who lived in different counties, 50% lived in Texas.
85% of the 78413 zip code residents lived in the same house 1 year ago. Out of people who lived in different houses, 61% moved from this county. Out of people who lived in different houses, 21% moved from different county within same state. Out of people who lived in different houses, 14% moved from different state. Out of people who lived in different houses, 2% moved from abroad.
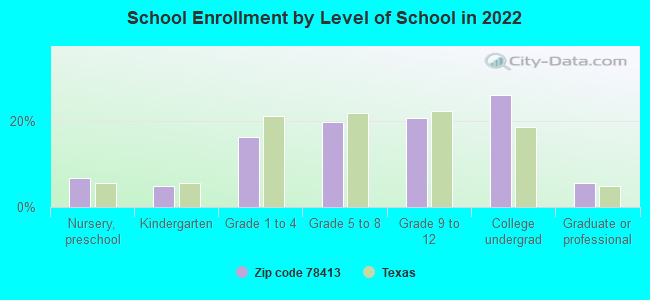
Private vs. public school enrollment:
Students in private schools in grades 1 to 8 (elementary and middle school): 407
Here:
13.9%
Texas:
8.8%
Students in private schools in grades 9 to 12 (high school): 158
Here:
9.5%
Texas:
8.0%
Students in private undergraduate colleges: 122
Here:
5.8%
Texas:
16.2%
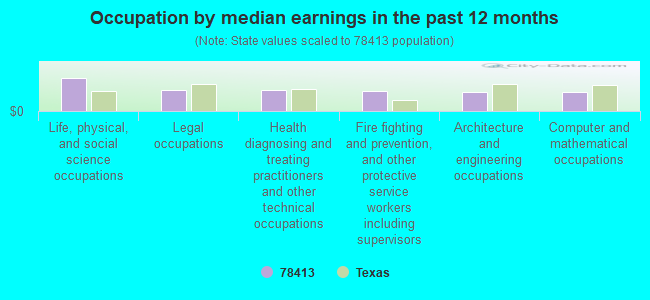
Occupation by median earnings in the past 12 months ($)
123,432Life, physical, and social science occupations
77,103Legal occupations
76,787Health diagnosing and treating practitioners and other technical occupations
74,617Fire fighting and prevention, and other protective service workers including supervisors
71,020Architecture and engineering occupations
69,211Computer and mathematical occupations
Companies with biggest federal contracts located in this zip code (CORPUS CHRISTI, TX):
BMST INC AND STC CONSTRUCTORS (6262 WEBER RD STE 310; small business) : $7,935,295 in 7 contractsfrom 2003 to 2005
Contracts for Maintenance, Repair or Alteration of Real Property -- Other Non-Building Facilities, Maintenance, Repair or Alteration of Real Property -- Other Industrial Buildings, Construction of Structures and Facilities -- Other Administrative Facilities and Service Buildings by Navy Signed by year:2000: $0; 2001: $0; 2002: $0; 2003: $4,414,000; 2004: $10,508; 2005: $3,510,787; 2006: $0.
Biggest contracts:
$4,414,000 with Navy for Maintenance, Repair or Alteration of Real Property -- Other Non-Building Facilities. Signed on 2003-08-28. Completion date: 2004-10-14.
$2,710,000 with Navy for Maintenance, Repair or Alteration of Real Property -- Other Industrial Buildings. Signed on 2005-03-03. Completion date: 2005-07-16.
$468,000, same as above.Signed on 2005-03-03. Completion date: 2005-07-16.
$235,836, same as above.Signed on 2005-11-18. Completion date: 2005-07-16.
ELITE CONSTRUCTION CO (5414 PRESSLER; small business) : $424,975 in 2 contractsfrom 2005 to 2006
$396,840 with Navy for Maintenance, Repair or Alteration of Real Property -- Other Administrative Facilities and Service Buildings. Signed on 2005-09-30. Completion date: 2006-05-13.
$28,135, same as above.Signed on 2006-05-15. Completion date: 2006-05-13.
SCHOONOVER, JANEMARIE (5133 LETHABY DR; small business) : $254,330 in 7 contractsfrom 2003 to 2006
Contracts for Nursing Services by Navy Signed by year:2000: $0; 2001: $0; 2002: $0; 2003: $84,471; 2004: $0; 2005: $167,859; 2006: $2,000.
Biggest contracts:
$88,171 with Navy for Nursing Services. Signed on 2005-10-19. Completion date: 2005-09-30.
$80,973, same as above.Signed on 2005-10-19. Completion date: 2005-09-30.
$78,160, same as above.Signed on 2003-10-01. Completion date: 2004-09-30.
$6,311, same as above.Signed on 2003-08-19. Completion date: 2003-09-30.
RONALD CHAGNON (6036 KILLARMET CIRCLE; small business) : $128,000 in 2 contractsfrom 1999 to 2001
$80,000 with Army for Other Professional Services. Signed on 2001-02-26. Completion date: 2001-06-30.
$48,000 with Army for Maintenance, Repair and Rebuilding of Equipment -- Automatic Data Processing Equipment (Including Firmware), Software, Supplies and Support Equipment. Signed on 1999-11-04. Completion date: 1999-12-31.
THOMAS C KYLER (5757 SOUTH STAPLES 403; small business) : $111,640 in 2 contractsin 2000
$64,520 with Navy for Dentistry Services. Taking place in FL. Signed on 2000-01-12. Completion date: 2000-09-30.
$47,120, same as above.Signed on 2000-10-01. Completion date: 2001-09-30.
SS STRUCTURE COMPANY (4113 EAGLE DRIVE; small business) : $73,376 in 4 contractsfrom 1999 to 2000
$32,911 with Navy for Construction of Structures and Facilities -- Other Educational Buildings. Signed on 2000-10-01. Completion date: 2000-11-13.
$24,875 with Navy for Construction of Structures and Facilities -- Other Administrative Facilities and Service Buildings. Signed on 1999-10-01. Completion date: 1999-11-08.
$13,790 with Navy for Construction of Structures and Facilities -- Food or Grain Storage Buildings. Signed on 2000-10-01. Completion date: 2000-08-28.
$1,800 with Navy for Construction of Structures and Facilities -- Other Administrative Facilities and Service Buildings. Signed on 1999-10-01. Completion date: 1999-11-08.
BAY FIRE & SAFETY EQUIPMENT CO (3810 SATURN; small business) : $72,154 in 6 contractsfrom 2000 to 2006
Contracts for Construction of Structures and Facilities -- Other Administrative Facilities and Service Buildings, Fire Fighting Equipment, Safety and Rescue Equipment by Navy, Army Signed by year:2000: $41,435; 2001: $3,000; 2002: $0; 2003: $0; 2004: $16,164; 2005: $0; 2006: $11,555.
Biggest contracts:
$36,635 with Navy for Construction of Structures and Facilities -- Other Administrative Facilities and Service Buildings. Signed on 2000-10-01. Completion date: 2000-09-11.
$11,865 with Army for Fire Fighting Equipment. Signed on 2004-04-22. Completion date: 2004-06-10.
$11,555 with Army for Safety and Rescue Equipment. Signed on 2006-01-11. Completion date: 2006-02-10.
$4,800 with Navy for Construction of Structures and Facilities -- Other Administrative Facilities and Service Buildings. Signed on 2000-10-01. Completion date: 2000-09-11.
ENVIORNMENTAL MARINE SERVICES, (7618 TIMBER CREST DR; small business) : $67,123 in 2 contractsfrom 2003 to 2004
$37,468 with Navy for ADP Software. Taking place in CA. Signed on 2004-04-07. Completion date: 2004-05-13.
$29,655, same as above.Signed on 2003-09-25. Completion date: 2003-10-31.
PORTAIRS, INC (3741 APOLLO; small business) : $61,100 in 3 contractsfrom 2001 to 2002
$31,000 with Army for Air Conditioning Equipment. Signed on 2002-08-08. Completion date: 2002-09-20.
$18,100 with Navy for Maintenance, Repair or Alteration of Real Property -- Office Buildings. Signed on 2001-08-02. Completion date: 2001-09-06.
$12,000 with Navy for Maintenance, Repair or Alteration of Real Property -- Maintenance Buildings. Taking place in SC. Signed on 2001-08-17. Completion date: 2001-09-21.
GILLARD INC (3834 APOLLO RD; small business) : $50,354 in 3 contractsfrom 2002 to 2004
$17,677 with Army for Other Administrative Support Services. Signed on 2004-08-30. Completion date: 2004-09-24.
$17,677 with U.S. Army Corps of Engineers - civil program financing only for Other Administrative Support Services. Signed on 2004-08-30. Completion date: 2004-09-24.
$15,000 with United States Coast Guard (disused code: now 7008) for Maintenance, Repair or Alteration of Real Property -- Other Non-Building Facilities. Signed on 2002-05-15. Completion date: 2002-05-15.
Top industries in this zip code by the number of employees in 2005:
Health Care and Social Assistance: Home Health Care Services (250-499 employees: 1 establishment, 100-249 employees: 1 establishment, 10-19 employees: 1 establishment)
2002 - 2018 National Fire Incident Reporting System (NFIRS) incidents
According to the data from the years 2002 - 2018 the average number of fire incidents per year is 53. The highest number of fires - 76 took place in 2006, and the least - 38 in 2007. The data has a decreasing trend.
When looking into fire subcategories, the most reports belonged to: Outside Fires (40.1%), and Structure Fires (33.6%).
Fire incident types reported to NFIRS in Zip Code 78413


 Nearest zip codes: 78414, 78411, 78412, 78416, 78415, 78417.


 According to the data from the years 2002 - 2018 the average number of fire incidents per year is 53. The highest number of fires - 76 took place in 2006, and the least - 38 in 2007. The data has a decreasing trend.
 When looking into fire subcategories, the most reports belonged to: Outside Fires (40.1%), and Structure Fires (33.6%).