Estimated zip code population in 2022: 10,958 Zip code population in 2010: 10,741 Zip code population in 2000: 9,920
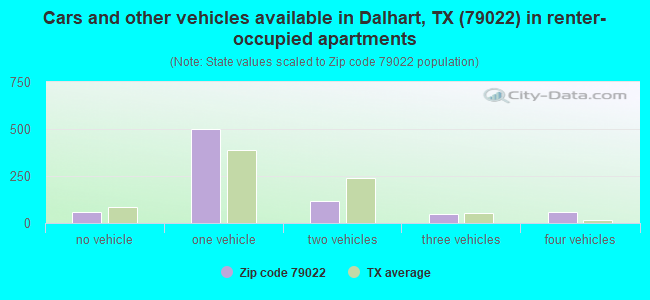
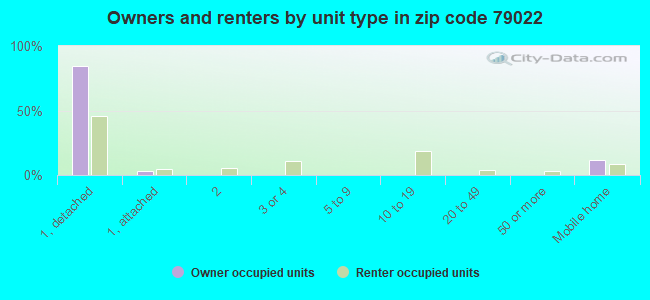
Houses and condos: 4,065 Renter-occupied apartments: 774
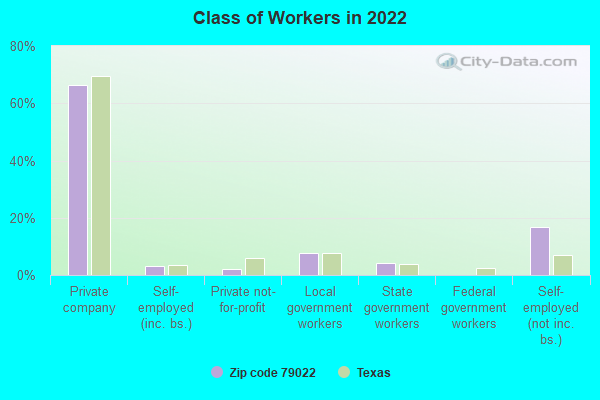
% of renters here:
23%
State:
38%
March 2022 cost of living index in zip code 79022: 78.5 (low, U.S. average is 100)
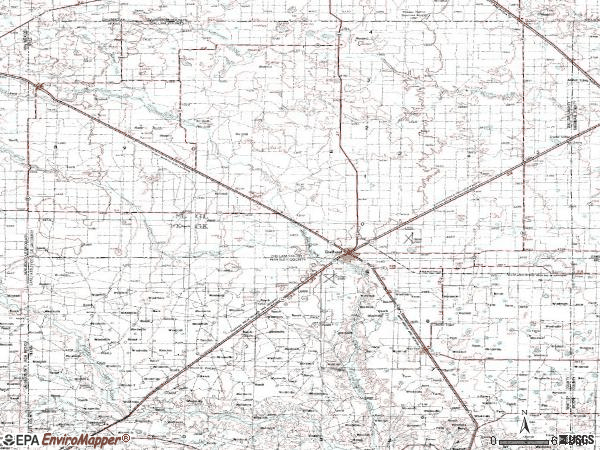
Land area: 1915.7 sq. mi. Water area: 1.7 sq. mi.
Population density: 6 people per square mile
(very low).
OSM Map
General Map
Google Map
MSN Map
OSM Map
General Map
Google Map
MSN Map
OSM Map
General Map
Google Map
MSN Map
OSM Map
General Map
Google Map
MSN Map
Please wait while loading the map...
Real estate property taxes paid for housing units in 2022:
This zip code:
1.2% ($1,978)
Texas:
1.5% ($4,050)
Median real estate property taxes paid for housing units with mortgages in 2022: $2,075 (1.2%) Median real estate property taxes paid for housing units with no mortgage in 2022: $1,509 (0.9%)
Business Search- 14 Million verified businesses
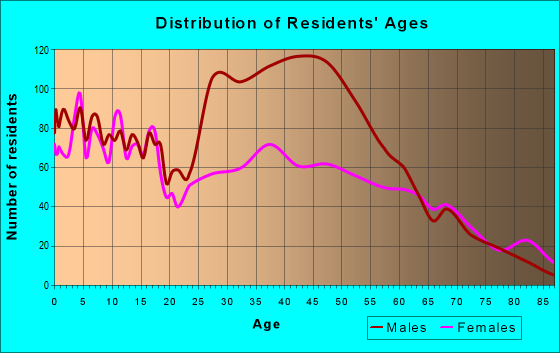
Males: 6,157
(56.2%)
Females: 4,801
(43.8%)
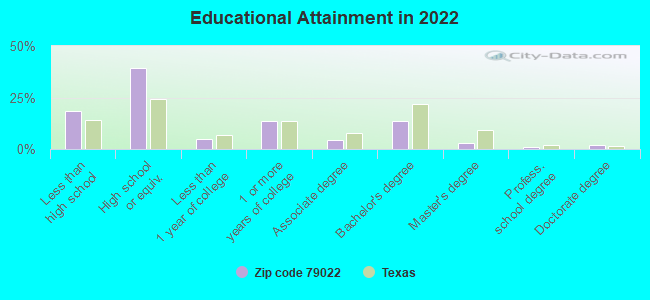
For population 25 years and over in 79022:
High school or higher: 80.5%
Bachelor's degree or higher: 19.3%
Graduate or professional degree: 5.7%
Unemployed: 1.7%
Mean travel time to work (commute): 11.9 minutes
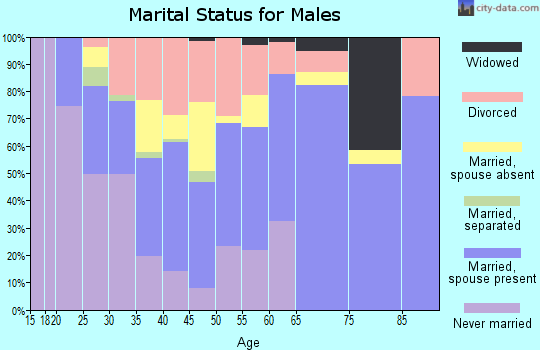
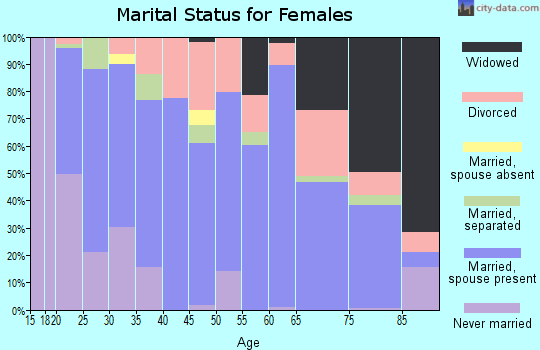
For population 15 years and over in 79022:
Never married: 26.0%
Now married: 58.6%
Separated: 2.0%
Widowed: 3.8%
Divorced: 9.6%
Zip code 79022 compared to state average:
Median house value below state average.
Unemployed percentage below state average.
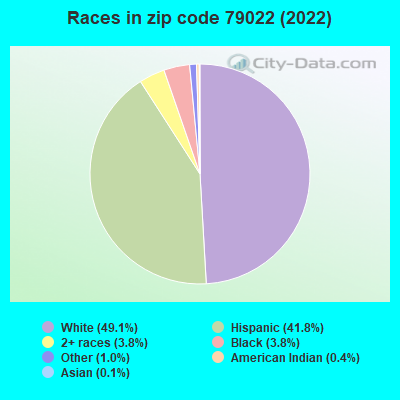
Black race population percentage significantly below state average.
Renting percentage below state average.
Length of stay since moving in significantly above state average.
Number of college students significantly below state average.
Percentage of population with a bachelor's degree or higher below state average.
Estimated median house/condo value in 2022: $166,281
79022:
$166,281
Texas:
$275,400
According to our research of Texas and other state lists, there were 32 registered sex offenders living in 79022 zip code as of April 26, 2024. The ratio of all residents to sex offenders in zip code 79022 is 362 to 1. The ratio of registered sex offenders to all residents in this zip code is near the state average.
Median resident age:
This zip code:
36.6 years
Texas median age:
35.6 years
Average household size:
This zip code:
2.8 people
Texas:
2.6 people
Averages for the 2020 tax year for zip code 79022, filed in 2021:
Average Adjusted Gross Income (AGI) in 2020: $86,197 (Individual Income Tax Returns)
Here:
$86,197
State:
$77,054
Salary/wage: $50,601 (reported on 87.2% of returns)
Here:
$50,601
State:
$62,766
(% of AGI for various income ranges: 1543.4% for AGIs below $25k, 4597.1% for AGIs $25k-50k, 7414.7% for AGIs $50k-75k, 10864.4% for AGIs $75k-100k, 19554.8% for AGIs $100k-200k)
Taxable interest for individuals: $4,200 (reported on 22.9% of returns)
This zip code:
$4,200
Texas:
$2,665
(% of AGI for various income ranges: 13.6% for AGIs below $25k, 21.1% for AGIs $25k-50k, 41.4% for AGIs $50k-75k, 51.6% for AGIs $75k-100k, 193.0% for AGIs $100k-200k)
Ordinary dividends: $14,752 (reported on 10.6% of returns)
Here:
$14,752
State:
$10,044
(% of AGI for various income ranges: 20.2% for AGIs below $25k, 18.2% for AGIs $25k-50k, 70.2% for AGIs $50k-75k, 34.4% for AGIs $75k-100k, 179.1% for AGIs $100k-200k)
Net capital gain/loss in AGI: +$65,300 (reported on 11.9% of returns)
Here:
+$65,300
State:
+$39,590
(% of AGI for various income ranges: 16.8% for AGIs below $25k, 37.0% for AGIs $25k-50k, 49.0% for AGIs $50k-75k, 104.0% for AGIs $75k-100k, 985.7% for AGIs $100k-200k)
Profit/loss from business: +$19,425 (reported on 17.4% of returns)
Here:
+$19,425
State:
+$10,888
(% of AGI for various income ranges: 76.6% for AGIs below $25k, 110.3% for AGIs $25k-50k, 188.2% for AGIs $50k-75k, 386.8% for AGIs $75k-100k, 1133.5% for AGIs $100k-200k)
Taxable individual retirement arrangement distribution: $12,794 (reported on 4.1% of returns)
79022:
$12,794
Texas:
$24,740
(% of AGI for various income ranges: 21.1% for AGIs below $25k, 31.5% for AGIs $25k-50k, 60.8% for AGIs $50k-75k, 192.4% for AGIs $75k-100k, 443.9% for AGIs $100k-200k)
Total itemized deductions: $66,278 (reported on 4.1% of returns)
Here:
$66,278
State:
$40,428
(% of AGI for various income ranges: 98.8% for AGIs $25k-50k, 209.6% for AGIs $50k-75k, 973.9% for AGIs $100k-200k)
Charity contributions: $47,447 (reported on 3.4% of returns)
Here:
$47,447
State:
$18,201
(% of AGI for various income ranges: 98.8% for AGIs $50k-75k, 382.6% for AGIs $100k-200k)
Taxes paid: $6,106 (reported on 4.1% of returns)
79022:
$6,106
State:
$7,821
(% of AGI for various income ranges: 14.3% for AGIs $25k-50k, 35.9% for AGIs $50k-75k, 133.5% for AGIs $100k-200k)
Earned income credit: $2,178 (reported on 15.4% of returns)
Here:
$2,178
State:
$2,584
(% of AGI for various income ranges: 90.0% for AGIs below $25k, 64.4% for AGIs $25k-50k, 2.7% for AGIs $50k-75k)
Percentage of individuals using paid preparers for their 2020 taxes: 89.0%
Here:
89%
State:
92%
(% for various income ranges: 88.0% for AGIs below $25k, 85.8% for AGIs $25k-50k, 90.4% for AGIs $50k-75k, 92.1% for AGIs $75k-100k, 93.8% for AGIs $100k-200k, 94.1% for AGIs over 200k)
Averages for the 2012 tax year for zip code 79022, filed in 2013:
Average Adjusted Gross Income (AGI) in 2012: $59,452 (Individual Income Tax Returns)
Here:
$59,452
State:
$65,384
Salary/wage: $39,028 (reported on 86.5% of returns)
Here:
$39,028
State:
$52,524
(% of AGI for various income ranges: 81.2% for AGIs below $25k, 88.3% for AGIs $25k-50k, 81.0% for AGIs $50k-75k, 80.2% for AGIs $75k-100k, 58.9% for AGIs $100k-200k, 12.1% for AGIs over 200k)
Taxable interest for individuals: $3,588 (reported on 24.9% of returns)
This zip code:
$3,588
Texas:
$2,372
(% of AGI for various income ranges: 1.4% for AGIs below $25k, 0.4% for AGIs $25k-50k, 0.9% for AGIs $50k-75k, 0.4% for AGIs $75k-100k, 1.3% for AGIs $100k-200k, 2.9% for AGIs over 200k)
Ordinary dividends: $8,038 (reported on 11.4% of returns)
Here:
$8,038
State:
$9,721
(% of AGI for various income ranges: 1.1% for AGIs below $25k, 0.2% for AGIs $25k-50k, 0.6% for AGIs $50k-75k, 0.2% for AGIs $75k-100k, 0.8% for AGIs $100k-200k, 3.7% for AGIs over 200k)
Net capital gain/loss in AGI: +$40,076 (reported on 10.9% of returns)
Here:
+$40,076
State:
+$35,319
(% of AGI for various income ranges: 0.4% for AGIs below $25k, 0.8% for AGIs $50k-75k, 0.5% for AGIs $75k-100k, 5.0% for AGIs $100k-200k, 19.9% for AGIs over 200k)
Profit/loss from business: +$23,800 (reported on 17.6% of returns)
Here:
+$23,800
State:
+$13,732
(% of AGI for various income ranges: 7.3% for AGIs below $25k, 3.5% for AGIs $25k-50k, 4.0% for AGIs $50k-75k, 6.8% for AGIs $75k-100k, 10.2% for AGIs $100k-200k, 8.9% for AGIs over 200k)
Taxable individual retirement arrangement distribution: $11,168 (reported on 5.3% of returns)
79022:
$11,168
Texas:
$19,511
(% of AGI for various income ranges: 1.9% for AGIs below $25k, 0.6% for AGIs $25k-50k, 1.2% for AGIs $50k-75k, 0.9% for AGIs $75k-100k, 1.7% for AGIs $100k-200k, 0.5% for AGIs over 200k)
Self-employment retirement plans: $22,200 (reported on 0.5% of returns)
79022:
$22,200
Texas:
$23,938
(% of AGI for various income ranges: 1.3% for AGIs $50k-75k)
Total itemized deductions: $25,600 (16% of AGI, reported on 16.4% of returns)
Here:
$25,600
State:
$24,724
Here:
16.1% of AGI
State:
15.9% of AGI
(% of AGI for various income ranges: 5.7% for AGIs below $25k, 3.5% for AGIs $25k-50k, 6.7% for AGIs $50k-75k, 8.1% for AGIs $75k-100k, 11.4% for AGIs $100k-200k, 7.1% for AGIs over 200k)
Charity contributions: $11,200 (reported on 12.8% of returns)
Here:
$11,200
State:
$6,808
(% of AGI for various income ranges: 0.8% for AGIs below $25k, 0.6% for AGIs $25k-50k, 1.5% for AGIs $50k-75k, 1.9% for AGIs $75k-100k, 3.7% for AGIs $100k-200k, 3.8% for AGIs over 200k)
Taxes paid: $4,728 (reported on 16.2% of returns)
79022:
$4,728
State:
$6,921
(% of AGI for various income ranges: 0.7% for AGIs below $25k, 0.5% for AGIs $25k-50k, 1.1% for AGIs $50k-75k, 1.7% for AGIs $75k-100k, 2.1% for AGIs $100k-200k, 1.4% for AGIs over 200k)
Earned income credit: $2,338 (reported on 20.3% of returns)
Here:
$2,338
State:
$2,570
(% of AGI for various income ranges: 7.4% for AGIs below $25k, 1.3% for AGIs $25k-50k)
Percentage of individuals using paid preparers for their 2012 taxes: 62.1%
Here:
62%
State:
51%
(% for various income ranges: 57.7% for AGIs below $25k, 59.5% for AGIs $25k-50k, 59.6% for AGIs $50k-75k, 66.7% for AGIs $75k-100k, 78.1% for AGIs $100k-200k, 93.3% for AGIs over 200k)
Averages for the 2004 tax year for zip code 79022, filed in 2005:
Average Adjusted Gross Income (AGI) in 2004: $36,024 (Individual Income Tax Returns)
Here:
$36,024
State:
$47,881
Salary/wage: $30,973 (reported on 82.0% of returns)
Here:
$30,973
State:
$41,947
(% of AGI for various income ranges: 80.0% for AGIs $10k-25k, 81.8% for AGIs $25k-50k, 74.5% for AGIs $50k-75k, 73.7% for AGIs $75k-100k, 31.8% for AGIs over 100k)
Taxable interest for individuals: $2,978 (reported on 35.6% of returns)
This zip code:
$2,978
Texas:
$2,255
(% of AGI for various income ranges: 2.4% for AGIs $10k-25k, 1.6% for AGIs $25k-50k, 2.0% for AGIs $50k-75k, 2.0% for AGIs $75k-100k, 3.6% for AGIs over 100k)
Taxable dividends: $2,362 (reported on 17.5% of returns)
Here:
$2,362
State:
$4,261
(% of AGI for various income ranges: 0.9% for AGIs $10k-25k, 0.5% for AGIs $25k-50k, 0.6% for AGIs $50k-75k, 1.6% for AGIs $75k-100k, 1.4% for AGIs over 100k)
Net capital gain/loss: +$16,214 (reported on 16.7% of returns)
Here:
+$16,214
State:
+$16,110
(% of AGI for various income ranges: 0.8% for AGIs $10k-25k, 1.3% for AGIs $25k-50k, 1.3% for AGIs $50k-75k, 2.9% for AGIs $75k-100k, 16.6% for AGIs over 100k)
Profit/loss from business: +$11,047 (reported on 19.9% of returns)
Here:
+$11,047
State:
+$11,013
(% of AGI for various income ranges: 4.6% for AGIs $10k-25k, 4.4% for AGIs $25k-50k, 5.6% for AGIs $50k-75k, 8.4% for AGIs $75k-100k, 5.4% for AGIs over 100k)
IRA payment deduction: $3,879 (reported on 2.5% of returns)
79022:
$3,879
Texas:
$3,120
(% of AGI for various income ranges: 0.3% for AGIs $25k-50k, 0.2% for AGIs $50k-75k, 0.3% for AGIs $75k-100k, 0.2% for AGIs over 100k)
Self-employed pension: $10,579 (reported on 0.5% of returns)
Here:
$10,579
Texas:
$16,401
Total itemized deductions: $17,899 (21% of AGI, reported on 17.4% of returns)
Here:
$17,899
State:
$19,631
Here:
20.5% of AGI
State:
18.9% of AGI
(% of AGI for various income ranges: 6.5% for AGIs $10k-25k, 5.9% for AGIs $25k-50k, 9.9% for AGIs $50k-75k, 10.9% for AGIs $75k-100k, 7.1% for AGIs over 100k)
Charity contributions deductions: $6,421 (7% of AGI, reported on 14.1% of returns)
Here:
$6,421
State:
$4,753
Here:
6.9% of AGI
State:
4.2% of AGI
(% of AGI for various income ranges: 0.8% for AGIs $10k-25k, 1.3% for AGIs $25k-50k, 1.9% for AGIs $50k-75k, 2.9% for AGIs $75k-100k, 3.6% for AGIs over 100k)
Total tax: $6,989 (reported on 69.6% of returns)
79022:
$6,989
State:
$9,058
(% of AGI for various income ranges: 3.9% for AGIs $10k-25k, 6.2% for AGIs $25k-50k, 9.3% for AGIs $50k-75k, 11.5% for AGIs $75k-100k, 21.4% for AGIs over 100k)
Earned income credit: $1,733 (reported on 21.7% of returns)
Here:
$1,733
State:
$2,024
Percentage of individuals using paid preparers for their 2004 taxes: 59.6%
Here:
60%
State:
57%
(% for various income ranges: 53.7% for AGIs below $10k, 56.2% for AGIs $10k-25k, 57.8% for AGIs $25k-50k, 64.7% for AGIs $50k-75k, 75.6% for AGIs $75k-100k, 81.5% for AGIs over 100k)
Likely homosexual households (counted as self-reported same-sex unmarried-partner households)
Lesbian couples: 0.0% of all households
Gay men: 0.6% of all households
Household received Food Stamps/SNAP in the past 12 months: 204 Household did not receive Food Stamps/SNAP in the past 12 months: 3,161
Women who had a birth in the past 12 months: 133 (114 now married, 19 unmarried) Women who did not have a birth in the past 12 months: 1,879 (1,140 now married, 729 unmarried)
Housing units in zip code 79022 with a mortgage: 1,292 (52 second mortgage, 57 both second mortgage and home equity loan) Houses without a mortgage: 24
Median monthly owner costs for units with a mortgage: $1,219 Median monthly owner costs for units without a mortgage: $546
Residents with income below the poverty level in 2022:
This zip code:
7.8%
Whole state:
14.0%
Residents with income below 50% of the poverty level in 2022:
This zip code:
4.5%
Whole state:
7.4%
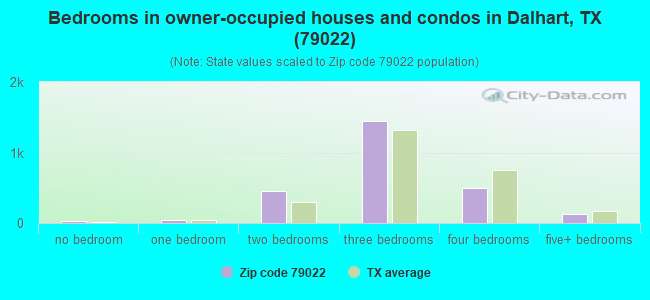
Median number of rooms in houses and condos:
Here:
6.3
State:
6.3
Median number of rooms in apartments:
Here:
4.5
State:
4.0
Notable locations in this zip code not listed on our city pages
Notable locations in zip code 79022: Castleberry Ranch (A), Coldwater Community House (B), Coloney Community House (C), Dammier Ranch (D), East Punta de Agua Windmill (E), Thompson Grove Campground (F), Hanbury Windmill (G), McCrory Ranch (H), McMordie Pens (I), Northeast Red White and Blue Windmill (J), Northwest Red White and Blue Windmill (K), Partition Windmill (L), Red Windmill (M), Sandhill Windmill (N), Sinclair Windmill (O), South Center Windmill (P), South Windmill (Q), Southeast Windmill (R), Steel Windmill (S), Taylor Ranch (T). Display/hide their locations on the map
Churches in zip code 79022 include: Central United Methodist Church (A), New Light Baptist Church (B), Lincoln Street Baptist Church (C), Antioch Baptist Church (D), Calvary Assembly of God Church (E), Seventh Day Adventist Church (F), First Presbyterian Church (G), Lakeview United Methodist Church (H), Saint Anthonys Catholic Church (I). Display/hide their locations on the map
Lakes and reservoirs: Coldwater Lakes (A), Alkali Lakes (B), Mildred Lake (C), Flater Lake (D), Lake Windmill (E), Rita Blanca Lake (F), Reynolds Lake (G), Martha Houghton Lake Number 4 (H). Display/hide their locations on the map
In group quarters: 1,510 (-1 institutionalized population)
Size of family households: 1,132 2-persons, 103 3-persons, 488 4-persons, 328 5-persons, 133 6-persons, 124 7-or-more-persons
Size of nonfamily households: 987 1-person, 65 2-persons, 4 5-persons
2,079 married couples with children.
415 single-parent households (204 men, 211 women).
70.6% of residents of 79022 zip code speak English at home.
27.0% of residents speak Spanish at home (57% very well, 12% well, 12% not well, 18% not at all).
2.4% of residents speak other Indo-European language at home (82% very well, 17% well, 1% not well).
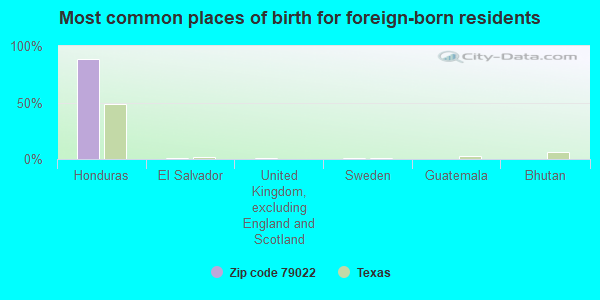
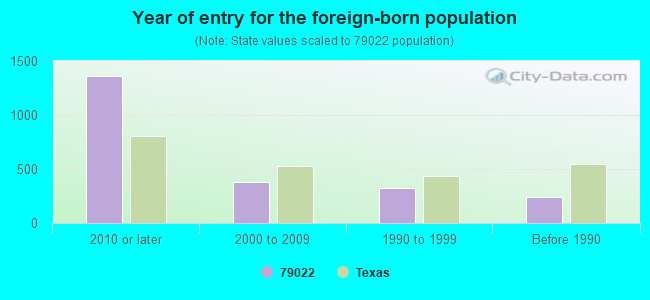
Foreign born population: 2,020 (18.4%) (30.9% of them are naturalized citizens)
This zip code:
18.4%
Whole state:
17.2%
88%Honduras
1%El Salvador
1%United Kingdom, excluding England and Scotland
1%Sweden
0%Guatemala
0%Bhutan
0%St. Vincent and the Grenadines
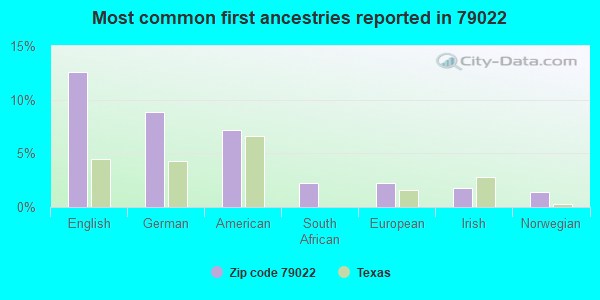
13%English
9%German
7%American
2%South African
2%European
2%Irish
1%Norwegian
Year of entry for the foreign-born population
1,3612010 or later
3842000 to 2009
3271990 to 1999
244Before 1990
Facilities with environmental interests located in this zip code:
BAILEY FLYING SERVICE INC (3 MI W ON HWY 54 MUNICIPAL AIR in DALHART, TX)
FORMAL ENFORCEMENT ACTION (Integrated Compliance Information System) - ICIS-06-2005-0306, ENFORCEMENT/COMPLIANCE ACTIVITY (Resource Conservation and Recovery Act (tracking hazardous waste))
AVALANCHE DAIRY (13390 HIGHWAY 385 in DALHART, TX)
National Pollutant Discharge Elimination System NON-MAJOR (Tracking pollutant discharge elimination systems) - permit Business SIC classification: DAIRY FARMS Organizations: CRAIG TAFT AND SYLVIA TAFT (CONTACT/OWNER)
Alternative names: CRAIG TAFT AND SYLVIA TAFT
B & E MOORE FAMILY (E SIDE OF CRMOORE APPROX 3 M N in DALHART, TX)
National Pollutant Discharge Elimination System NON-MAJOR (Tracking pollutant discharge elimination systems) - permit Business SIC classification: DAIRY FARMS Organizations: B & E MOORE FAMILY LTD (CONTACT/OWNER)
AMERICAN SPRAYERS INC (MUNICIPAL AIRPORT in DALHART, TX)
(Resource Conservation and Recovery Act (tracking hazardous waste)) Business NAICS classification: SOIL PREPARATION, PLANTING, AND CULTIVATING.
Housing units lacking complete plumbing facilities: 5.9% Housing units lacking complete kitchen facilities: 8.1%
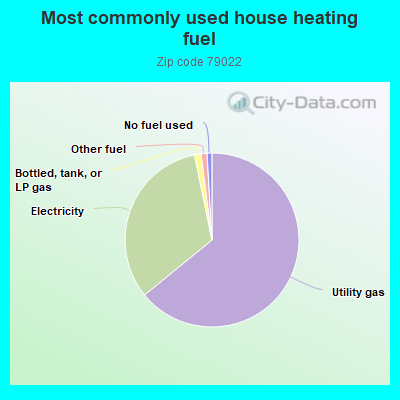
63.8%Utility gas
32.5%Electricity
1.2%Bottled, tank, or LP gas
1.1%Other fuel
0.9%No fuel used
Population in 1990: 7,051. Population change in the 1990s: +2,869 (+40.7%).
Place of birth for U.S.-born residents:
This state: 5,977
Northeast: 117
Midwest: 936
South: 601
West: 1,184
54% of the 79022 zip code residents lived in the same house 5 years ago. Out of people who lived in different houses, 32% lived in this county. Out of people who lived in different counties, 50% lived in Texas.
81% of the 79022 zip code residents lived in the same house 1 year ago. Out of people who lived in different houses, 27% moved from this county. Out of people who lived in different houses, 50% moved from different county within same state. Out of people who lived in different houses, 7% moved from different state. Out of people who lived in different houses, 19% moved from abroad.
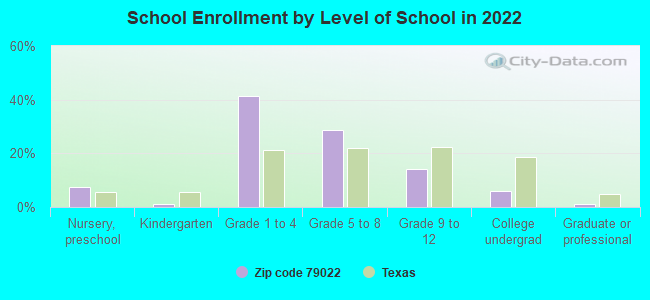
Private vs. public school enrollment:
Students in private schools in grades 1 to 8 (elementary and middle school): 213
Here:
12.9%
Texas:
8.8%
Students in private schools in grades 9 to 12 (high school): 51
Here:
15.6%
Texas:
8.0%
Students in private undergraduate colleges:
Here:
0.0%
Texas:
16.2%
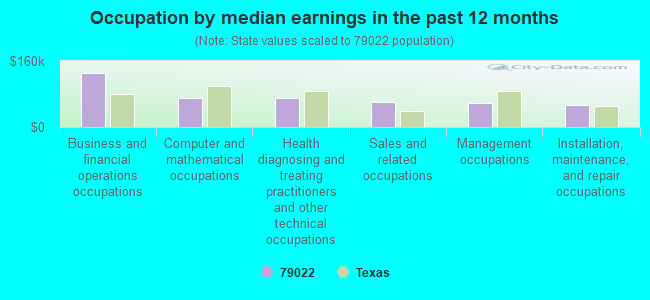
Occupation by median earnings in the past 12 months ($)
131,653Business and financial operations occupations
71,093Computer and mathematical occupations
69,473Health diagnosing and treating practitioners and other technical occupations
60,005Sales and related occupations
57,260Management occupations
53,270Installation, maintenance, and repair occupations
Top industries in this zip code by the number of employees in 2005:
68 people in nursing facilities/skilled-nursing facilities
38 people in local jails and other municipal confinement facilities
5 people in other noninstitutional facilities
People in group quarters in 2000:
1,343 people in state prisons
77 people in nursing homes
12 people in local jails and other confinement facilities (including police lockups)
4 people in religious group quarters
4 people in other noninstitutional group quarters
Fatal accident statistics in 2014:
Fatal accident count: 6
Vehicles involved in fatal accidents: 10
Fatal accidents caused by drunken drivers: 0
Fatalities: 7
Persons involved in fatal accidents: 16
Pedestrians involved in fatal accidents: 1
Fatal accident statistics in 2013:
Fatal accident count: 3
Vehicles involved in fatal accidents: 4
Fatal accidents caused by drunken drivers: 0
Fatalities: 3
Persons involved in fatal accidents: 4
Pedestrians involved in fatal accidents: 0
2010 - 2018 National Fire Incident Reporting System (NFIRS) incidents
Based on the data from the years 2010 - 2018 the average number of fire incidents per year is 58. The highest number of reported fire incidents - 111 took place in 2016, and the least - 0 in 2012. The data has a declining trend.
When looking into fire subcategories, the most incidents belonged to: Outside Fires (64.0%), and Structure Fires (18.5%).
Fire incident types reported to NFIRS in Zip Code 79022
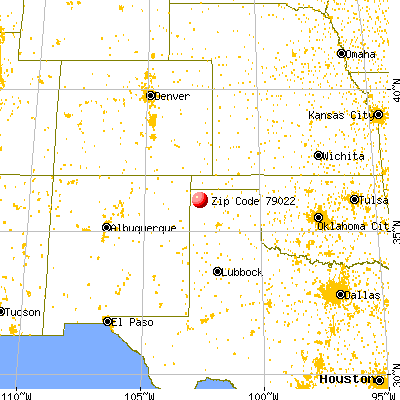


 Nearest zip codes: 79044, 79087, 73937, 79051, 88436, 79018.
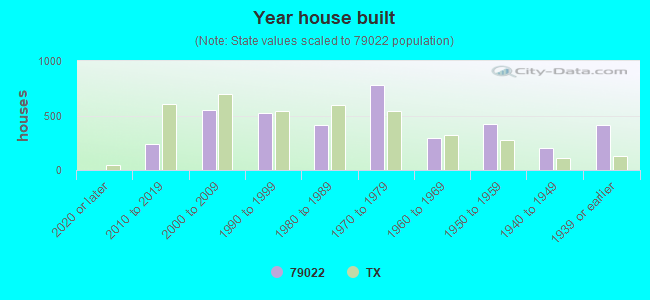


 Based on the data from the years 2010 - 2018 the average number of fire incidents per year is 58. The highest number of reported fire incidents - 111 took place in 2016, and the least - 0 in 2012. The data has a declining trend.
 When looking into fire subcategories, the most incidents belonged to: Outside Fires (64.0%), and Structure Fires (18.5%).