Estimated zip code population in 2022: 26,439 Zip code population in 2010: 28,849 Zip code population in 2000: 28,684
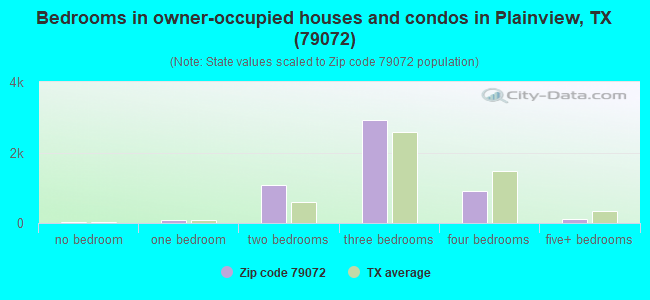
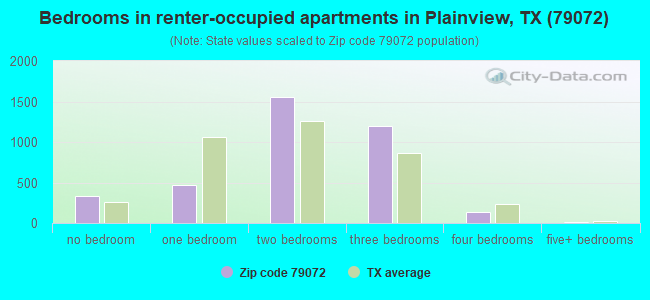
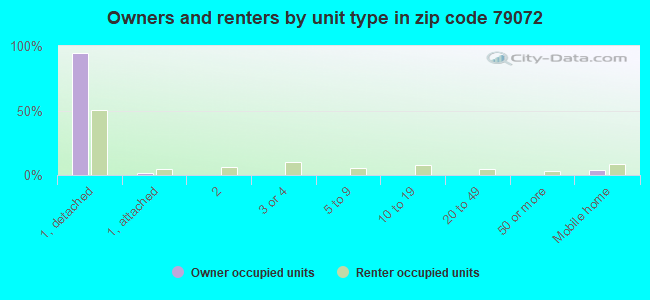
Houses and condos: 10,595 Renter-occupied apartments: 3,695
% of renters here:
42%
State:
38%
March 2022 cost of living index in zip code 79072: 76.4 (low, U.S. average is 100)
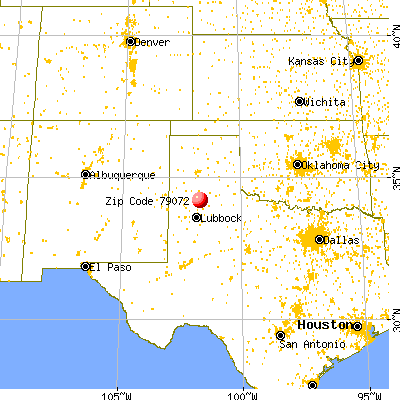
Land area: 382.7 sq. mi. Water area: 0.1 sq. mi.
Population density: 69 people per square mile
(very low).
OSM Map
General Map
Google Map
MSN Map
OSM Map
General Map
Google Map
MSN Map
OSM Map
General Map
Google Map
MSN Map
OSM Map
General Map
Google Map
MSN Map
Please wait while loading the map...
Real estate property taxes paid for housing units in 2022:
This zip code:
1.3% ($1,499)
Texas:
1.5% ($4,050)
Median real estate property taxes paid for housing units with mortgages in 2022: $2,434 (1.5%) Median real estate property taxes paid for housing units with no mortgage in 2022: $1,195 (1.3%)
Business Search- 14 Million verified businesses
Males: 13,658
(51.7%)
Females: 12,780
(48.3%)
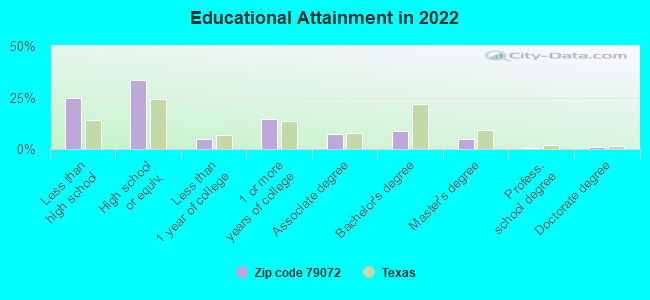
For population 25 years and over in 79072:
High school or higher: 73.4%
Bachelor's degree or higher: 14.5%
Graduate or professional degree: 6.1%
Unemployed: 4.9%
Mean travel time to work (commute): 18.1 minutes
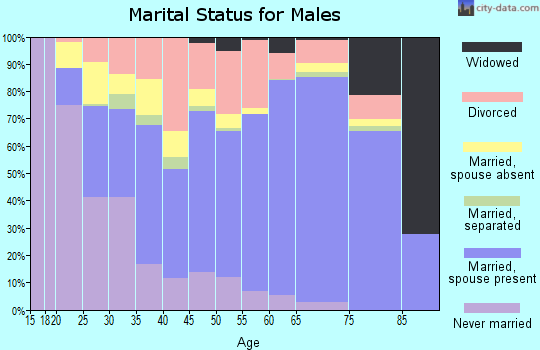
For population 15 years and over in 79072:
Never married: 35.0%
Now married: 47.8%
Separated: 3.7%
Widowed: 5.9%
Divorced: 7.6%
Zip code 79072 compared to state average:
Median house value significantly below state average.
Black race population percentage below state average.
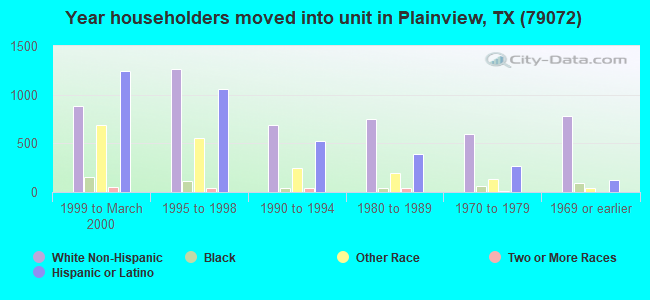
Length of stay since moving in significantly above state average.
House age above state average.
Percentage of population with a bachelor's degree or higher significantly below state average.
Averages for the 2020 tax year for zip code 79072, filed in 2021:
Average Adjusted Gross Income (AGI) in 2020: $48,546 (Individual Income Tax Returns)
Here:
$48,546
State:
$77,054
Salary/wage: $38,389 (reported on 87.3% of returns)
Here:
$38,389
State:
$62,766
(% of AGI for various income ranges: 1217.1% for AGIs below $25k, 3819.8% for AGIs $25k-50k, 6876.2% for AGIs $50k-75k, 10223.3% for AGIs $75k-100k, 18707.8% for AGIs $100k-200k, 83580.0% for AGIs over 200k)
Taxable interest for individuals: $2,916 (reported on 14.9% of returns)
This zip code:
$2,916
Texas:
$2,665
(% of AGI for various income ranges: 6.4% for AGIs below $25k, 14.2% for AGIs $25k-50k, 23.4% for AGIs $50k-75k, 59.8% for AGIs $75k-100k, 137.8% for AGIs $100k-200k, 9410.0% for AGIs over 200k)
Ordinary dividends: $5,924 (reported on 8.7% of returns)
Here:
$5,924
State:
$10,044
(% of AGI for various income ranges: 6.5% for AGIs below $25k, 18.7% for AGIs $25k-50k, 52.3% for AGIs $50k-75k, 120.7% for AGIs $75k-100k, 311.2% for AGIs $100k-200k, 7960.0% for AGIs over 200k)
Net capital gain/loss in AGI: +$31,868 (reported on 8.9% of returns)
Here:
+$31,868
State:
+$39,590
(% of AGI for various income ranges: 5.5% for AGIs below $25k, 19.7% for AGIs $25k-50k, 47.2% for AGIs $50k-75k, 103.1% for AGIs $75k-100k, 503.7% for AGIs $100k-200k, 82840.0% for AGIs over 200k)
Profit/loss from business: +$8,820 (reported on 15.7% of returns)
Here:
+$8,820
State:
+$10,888
(% of AGI for various income ranges: 107.6% for AGIs below $25k, 92.4% for AGIs $25k-50k, 163.8% for AGIs $50k-75k, 305.0% for AGIs $75k-100k, 805.6% for AGIs $100k-200k, 8120.0% for AGIs over 200k)
Taxable individual retirement arrangement distribution: $13,631 (reported on 4.8% of returns)
79072:
$13,631
Texas:
$24,740
(% of AGI for various income ranges: 18.4% for AGIs below $25k, 44.4% for AGIs $25k-50k, 83.1% for AGIs $50k-75k, 216.2% for AGIs $75k-100k, 599.4% for AGIs $100k-200k, 3896.7% for AGIs over 200k)
Total itemized deductions: $40,565 (reported on 2.6% of returns)
Here:
$40,565
State:
$40,428
(% of AGI for various income ranges: 49.5% for AGIs $25k-50k, 84.2% for AGIs $50k-75k, 349.0% for AGIs $75k-100k, 753.8% for AGIs $100k-200k, 15266.7% for AGIs over 200k)
Charity contributions: $23,346 (reported on 2.4% of returns)
Here:
$23,346
State:
$18,201
(% of AGI for various income ranges: 9.4% for AGIs $25k-50k, 27.1% for AGIs $50k-75k, 132.9% for AGIs $75k-100k, 351.9% for AGIs $100k-200k, 11366.7% for AGIs over 200k)
Taxes paid: $5,808 (reported on 2.5% of returns)
79072:
$5,808
State:
$7,821
(% of AGI for various income ranges: 6.9% for AGIs $25k-50k, 15.0% for AGIs $50k-75k, 49.0% for AGIs $75k-100k, 115.0% for AGIs $100k-200k, 1846.7% for AGIs over 200k)
Earned income credit: $2,673 (reported on 29.6% of returns)
Here:
$2,673
State:
$2,584
(% of AGI for various income ranges: 151.8% for AGIs below $25k, 115.0% for AGIs $25k-50k, 2.5% for AGIs $50k-75k)
Percentage of individuals using paid preparers for their 2020 taxes: 93.1%
Here:
93%
State:
92%
(% for various income ranges: 92.5% for AGIs below $25k, 94.7% for AGIs $25k-50k, 92.6% for AGIs $50k-75k, 91.0% for AGIs $75k-100k, 92.4% for AGIs $100k-200k, 94.4% for AGIs over 200k)
Averages for the 2012 tax year for zip code 79072, filed in 2013:
Average Adjusted Gross Income (AGI) in 2012: $40,628 (Individual Income Tax Returns)
Here:
$40,628
State:
$65,384
Salary/wage: $32,507 (reported on 88.7% of returns)
Here:
$32,507
State:
$52,524
(% of AGI for various income ranges: 84.9% for AGIs below $25k, 89.2% for AGIs $25k-50k, 80.8% for AGIs $50k-75k, 74.3% for AGIs $75k-100k, 59.7% for AGIs $100k-200k, 24.4% for AGIs over 200k)
Taxable interest for individuals: $1,879 (reported on 18.0% of returns)
This zip code:
$1,879
Texas:
$2,372
(% of AGI for various income ranges: 0.6% for AGIs below $25k, 0.4% for AGIs $25k-50k, 0.4% for AGIs $50k-75k, 1.1% for AGIs $75k-100k, 1.4% for AGIs $100k-200k, 1.5% for AGIs over 200k)
Ordinary dividends: $4,185 (reported on 10.3% of returns)
Here:
$4,185
State:
$9,721
(% of AGI for various income ranges: 0.7% for AGIs below $25k, 0.5% for AGIs $25k-50k, 0.7% for AGIs $50k-75k, 0.8% for AGIs $75k-100k, 1.7% for AGIs $100k-200k, 2.2% for AGIs over 200k)
Net capital gain/loss in AGI: +$11,253 (reported on 9.2% of returns)
Here:
+$11,253
State:
+$35,319
(% of AGI for various income ranges: 0.1% for AGIs $25k-50k, 0.5% for AGIs $50k-75k, 1.0% for AGIs $75k-100k, 2.0% for AGIs $100k-200k, 13.1% for AGIs over 200k)
Profit/loss from business: +$11,679 (reported on 14.4% of returns)
Here:
+$11,679
State:
+$13,732
(% of AGI for various income ranges: 6.2% for AGIs below $25k, 1.9% for AGIs $25k-50k, 2.4% for AGIs $50k-75k, 1.9% for AGIs $75k-100k, 4.5% for AGIs $100k-200k, 9.3% for AGIs over 200k)
Taxable individual retirement arrangement distribution: $11,246 (reported on 5.8% of returns)
79072:
$11,246
Texas:
$19,511
(% of AGI for various income ranges: 1.1% for AGIs below $25k, 1.1% for AGIs $25k-50k, 1.6% for AGIs $50k-75k, 2.7% for AGIs $75k-100k, 3.2% for AGIs $100k-200k, 0.5% for AGIs over 200k)
Self-employment retirement plans: $20,233 (reported on 0.3% of returns)
79072:
$20,233
Texas:
$23,938
Total itemized deductions: $21,550 (19% of AGI, reported on 10.7% of returns)
Here:
$21,550
State:
$24,724
Here:
19.4% of AGI
State:
15.9% of AGI
(% of AGI for various income ranges: 3.7% for AGIs below $25k, 3.2% for AGIs $25k-50k, 5.6% for AGIs $50k-75k, 6.3% for AGIs $75k-100k, 10.3% for AGIs $100k-200k, 6.7% for AGIs over 200k)
Charity contributions: $9,477 (reported on 8.6% of returns)
Here:
$9,477
State:
$6,808
(% of AGI for various income ranges: 0.5% for AGIs below $25k, 0.7% for AGIs $25k-50k, 1.7% for AGIs $50k-75k, 2.5% for AGIs $75k-100k, 3.8% for AGIs $100k-200k, 3.7% for AGIs over 200k)
Taxes paid: $4,132 (reported on 10.4% of returns)
79072:
$4,132
State:
$6,921
(% of AGI for various income ranges: 0.6% for AGIs below $25k, 0.5% for AGIs $25k-50k, 0.9% for AGIs $50k-75k, 1.2% for AGIs $75k-100k, 2.0% for AGIs $100k-200k, 1.5% for AGIs over 200k)
Earned income credit: $2,596 (reported on 35.7% of returns)
Here:
$2,596
State:
$2,570
(% of AGI for various income ranges: 11.2% for AGIs below $25k, 2.5% for AGIs $25k-50k)
Percentage of individuals using paid preparers for their 2012 taxes: 57.4%
Here:
57%
State:
51%
(% for various income ranges: 54.1% for AGIs below $25k, 57.4% for AGIs $25k-50k, 59.4% for AGIs $50k-75k, 61.8% for AGIs $75k-100k, 69.2% for AGIs $100k-200k, 92.9% for AGIs over 200k)
Averages for the 2004 tax year for zip code 79072, filed in 2005:
Average Adjusted Gross Income (AGI) in 2004: $29,502 (Individual Income Tax Returns)
Here:
$29,502
State:
$47,881
Salary/wage: $26,336 (reported on 88.0% of returns)
Here:
$26,336
State:
$41,947
(% of AGI for various income ranges: 145.6% for AGIs below $10k, 87.9% for AGIs $10k-25k, 87.4% for AGIs $25k-50k, 77.5% for AGIs $50k-75k, 73.6% for AGIs $75k-100k, 46.6% for AGIs over 100k)
Taxable interest for individuals: $2,078 (reported on 22.8% of returns)
This zip code:
$2,078
Texas:
$2,255
(% of AGI for various income ranges: 4.8% for AGIs below $10k, 1.3% for AGIs $10k-25k, 1.0% for AGIs $25k-50k, 1.6% for AGIs $50k-75k, 1.6% for AGIs $75k-100k, 2.4% for AGIs over 100k)
Taxable dividends: $2,463 (reported on 13.7% of returns)
Here:
$2,463
State:
$4,261
(% of AGI for various income ranges: 2.6% for AGIs below $10k, 0.7% for AGIs $10k-25k, 0.6% for AGIs $25k-50k, 1.2% for AGIs $50k-75k, 1.0% for AGIs $75k-100k, 2.5% for AGIs over 100k)
Net capital gain/loss: +$5,287 (reported on 12.0% of returns)
Here:
+$5,287
State:
+$16,110
(% of AGI for various income ranges: 0.0% for AGIs below $10k, 0.2% for AGIs $10k-25k, 0.5% for AGIs $25k-50k, 1.3% for AGIs $50k-75k, 1.4% for AGIs $75k-100k, 9.2% for AGIs over 100k)
Profit/loss from business: +$8,718 (reported on 14.2% of returns)
Here:
+$8,718
State:
+$11,013
(% of AGI for various income ranges: 3.3% for AGIs below $10k, 3.0% for AGIs $10k-25k, 2.1% for AGIs $25k-50k, 3.3% for AGIs $50k-75k, 4.4% for AGIs $75k-100k, 10.2% for AGIs over 100k)
Profit/loss from farming: +$3,110 (reported on 3.1% of returns)
Here:
+$3,110
State:
-$9,403
(% of AGI for various income ranges: -18.0% for AGIs below $10k, 0.4% for AGIs $10k-25k, -0.3% for AGIs $25k-50k, 0.8% for AGIs $50k-75k, 2.8% for AGIs $75k-100k, 1.8% for AGIs over 100k)
IRA payment deduction: $3,266 (reported on 1.6% of returns)
79072:
$3,266
Texas:
$3,120
(% of AGI for various income ranges: 0.1% for AGIs $10k-25k, 0.1% for AGIs $25k-50k, 0.2% for AGIs $50k-75k, 0.3% for AGIs $75k-100k, 0.3% for AGIs over 100k)
Self-employed pension: $11,951 (reported on 0.4% of returns)
Here:
$11,951
Texas:
$16,401
Total itemized deductions: $16,127 (22% of AGI, reported on 11.2% of returns)
Here:
$16,127
State:
$19,631
Here:
21.6% of AGI
State:
18.9% of AGI
(% of AGI for various income ranges: 9.2% for AGIs below $10k, 3.1% for AGIs $10k-25k, 3.7% for AGIs $25k-50k, 7.9% for AGIs $50k-75k, 10.4% for AGIs $75k-100k, 8.8% for AGIs over 100k)
Charity contributions deductions: $5,961 (8% of AGI, reported on 9.8% of returns)
Here:
$5,961
State:
$4,753
Here:
7.7% of AGI
State:
4.2% of AGI
(% of AGI for various income ranges: 0.7% for AGIs below $10k, 0.7% for AGIs $10k-25k, 1.0% for AGIs $25k-50k, 2.5% for AGIs $50k-75k, 3.5% for AGIs $75k-100k, 3.9% for AGIs over 100k)
Total tax: $4,342 (reported on 57.0% of returns)
79072:
$4,342
State:
$9,058
(% of AGI for various income ranges: 4.2% for AGIs below $10k, 2.5% for AGIs $10k-25k, 5.1% for AGIs $25k-50k, 8.5% for AGIs $50k-75k, 11.5% for AGIs $75k-100k, 19.5% for AGIs over 100k)
Earned income credit: $2,015 (reported on 37.2% of returns)
Here:
$2,015
State:
$2,024
Percentage of individuals using paid preparers for their 2004 taxes: 65.8%
Here:
66%
State:
57%
(% for various income ranges: 60.0% for AGIs below $10k, 70.7% for AGIs $10k-25k, 66.0% for AGIs $25k-50k, 60.0% for AGIs $50k-75k, 64.5% for AGIs $75k-100k, 76.1% for AGIs over 100k)
Household received Food Stamps/SNAP in the past 12 months: 1,988 Household did not receive Food Stamps/SNAP in the past 12 months: 6,898
Women who had a birth in the past 12 months: 650 (136 now married, 495 unmarried) Women who did not have a birth in the past 12 months: 5,301 (2,452 now married, 2,844 unmarried)
Housing units in zip code 79072 with a mortgage: 2,054 (52 second mortgage, 36 both second mortgage and home equity loan) Houses without a mortgage: 1
Median monthly owner costs for units with a mortgage: $1,318 Median monthly owner costs for units without a mortgage: $411
Residents with income below the poverty level in 2022:
This zip code:
20.6%
Whole state:
14.0%
Residents with income below 50% of the poverty level in 2022:
This zip code:
11.2%
Whole state:
7.4%
Median number of rooms in houses and condos:
Here:
6.0
State:
6.3
Median number of rooms in apartments:
Here:
4.5
State:
4.0
Notable locations in this zip code not listed on our city pages
In group quarters: 2,293 (-1 institutionalized population)
Size of family households: 2,565 2-persons, 1,420 3-persons, 1,220 4-persons, 786 5-persons, 278 6-persons, 86 7-or-more-persons
Size of nonfamily households: 2,141 1-person, 312 2-persons, 14 7-or-more-persons
3,482 married couples with children.
2,745 single-parent households (702 men, 2,043 women).
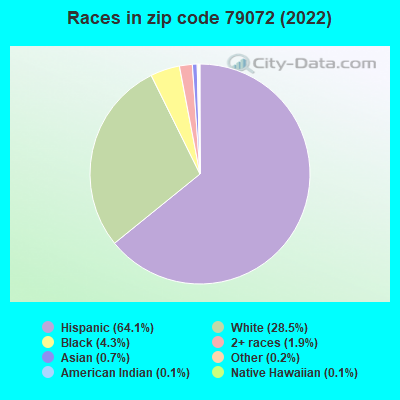
60.9% of residents of 79072 zip code speak English at home.
37.6% of residents speak Spanish at home (73% very well, 9% well, 10% not well, 7% not at all).
0.8% of residents speak other Indo-European language at home (73% very well, 15% well, 12% not well).
0.2% of residents speak Asian or Pacific Island language at home (53% very well, 47% well).
0.4% of residents speak other language at home (20% very well, 39% well, 40% not well).
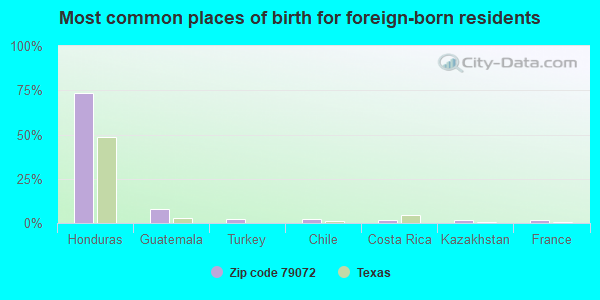
Foreign born population: 3,040 (11.5%) (33.7% of them are naturalized citizens)
This zip code:
11.5%
Whole state:
17.2%
73%Honduras
8%Guatemala
2%Turkey
2%Chile
2%Costa Rica
2%Kazakhstan
1%France
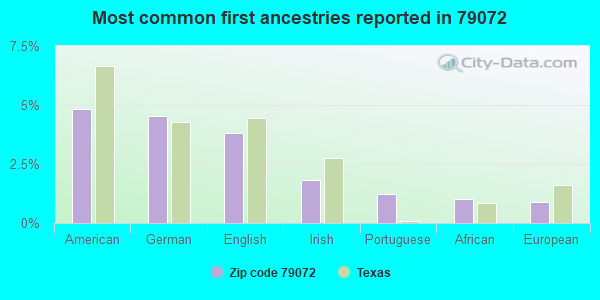
5%American
5%German
4%English
2%Irish
1%Portuguese
1%African
1%European
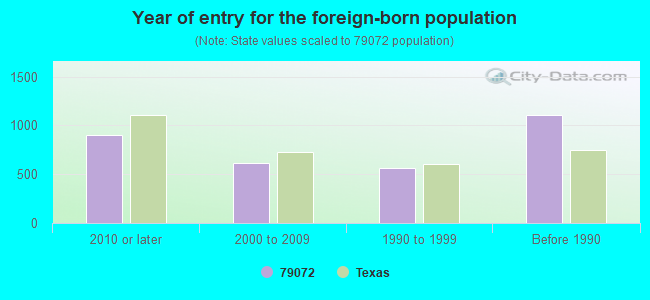
Year of entry for the foreign-born population
9012010 or later
6172000 to 2009
5621990 to 1999
1,107Before 1990
Facilities with environmental interests located in this zip code:
ASH 6TH GRADE LEARNING CENTER (908 ASH ST in PLAINVIEW, TX)
(National Center for Education Statistics) - STATE ID-095905101 Organizations: PLAINVIEW ISD (SCHOOL DISTRICT)
ADM (DIMMITT HWY 1.5 MI W OF in PLAINVIEW, TX)
(Resource Conservation and Recovery Act (tracking hazardous waste)) Business NAICS classification: FATS AND OILS REFINING AND BLENDING. Alternative names: ADM SOUTHERN COTTON OIL
ARCHER DANIELS MIDLAND MILLING COMPANY HARVEST QUEEN & ELEVATOR DIVISION (1208 NORTH COLUMBIA STREET in PLAINVIEW, TX)
COMPLIANCE ACTIVITY (Tracking inspections of insecticide, fungicide, and rodenticide, and toxic substances) TRI REPORTER (Tracking of toxic chemicals releasing facilities) Business SIC classification: FLOUR AND OTHER GRAIN MILL PRODUCTS Alternative names: ADM MILLING CO. HARVEST QUEEN & ELEVATOR DIV., HARVEST QUEEN MILL & ELEVATOR
ARMSTRONG OIL COMPANY BULK PLANT (2210 W 24TH ST in PLAINVIEW, TX)
(Resource Conservation and Recovery Act (tracking hazardous waste))
AZTECA MILLING PLAINVIEW PLANT (2 MI. S. OF PLAINVIEW, E. OF U in PLAINVIEW, TX)
AIR MAJOR (AIRS/AFS) CRITERIA AND HAZARDOUS AIR POLLUTANT INVENTORY (Inventory of air pollution sources) Business SIC classification: FLOUR AND OTHER GRAIN MILL PRODUCTS Alternative names: AZTECA MILLING, L.P.
Housing units lacking complete plumbing facilities: 6.0% Housing units lacking complete kitchen facilities: 8.7%
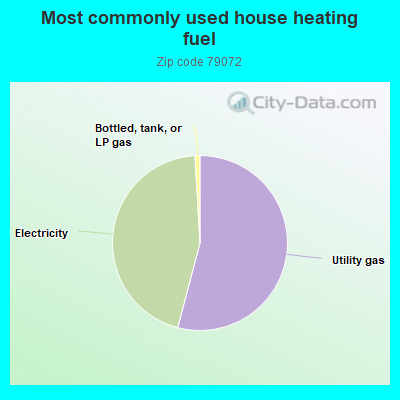
54.0%Utility gas
44.9%Electricity
0.9%Bottled, tank, or LP gas
Population in 1990: 27,037. Population change in the 1990s: +1,647 (+6.1%).
Place of birth for U.S.-born residents:
This state: 19,634
Northeast: 223
Midwest: 842
South: 1,075
West: 1,278
49% of the 79072 zip code residents lived in the same house 5 years ago. Out of people who lived in different houses, 61% lived in this county. Out of people who lived in different counties, 50% lived in Texas.
83% of the 79072 zip code residents lived in the same house 1 year ago. Out of people who lived in different houses, 39% moved from this county. Out of people who lived in different houses, 54% moved from different county within same state. Out of people who lived in different houses, 6% moved from different state. Out of people who lived in different houses, 0% moved from abroad.
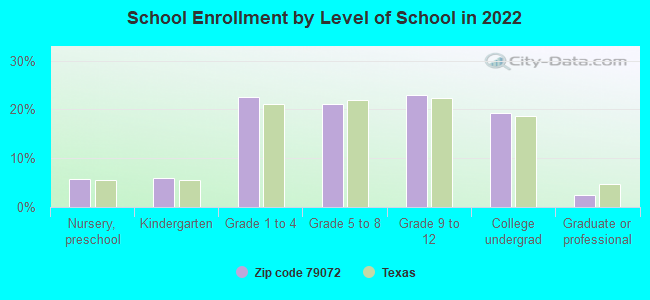
Private vs. public school enrollment:
Students in private schools in grades 1 to 8 (elementary and middle school): 119
Here:
3.7%
Texas:
8.8%
Students in private schools in grades 9 to 12 (high school): 178
Here:
10.4%
Texas:
8.0%
Students in private undergraduate colleges: 615
Here:
42.8%
Texas:
16.2%
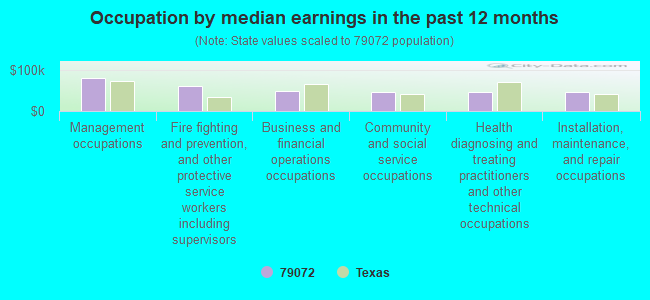
Occupation by median earnings in the past 12 months ($)
80,468Management occupations
59,145Fire fighting and prevention, and other protective service workers including supervisors
48,720Business and financial operations occupations
45,841Community and social service occupations
45,721Health diagnosing and treating practitioners and other technical occupations
44,941Installation, maintenance, and repair occupations
Companies with federal contracts located in this zip code:
WAYLAND BAPTIST UNIVERSITY INC (1900 W 7TH ST in PLAINVIEW, TX) : $719,603 in 21 contractsfrom 1999 to 2006
Contracts for Lease or Rental of Facilities -- Office Buildings, Tuition, Registration, and Membership Fees by Public Buildings Service, Air Force Signed by year:2000: $148,000; 2001: $148,000; 2002: $185,744; 2003: $199,859; 2004: $0; 2005: $0; 2006: $1,000.
Biggest contracts:
$37,643 with Public Buildings Service for Lease or Rental of Facilities -- Office Buildings. Signed on 2003-09-15. Completion date: 2003-09-15.
$37,643, same as above.Signed on 2003-06-15. Completion date: 2003-06-15.
$37,372, same as above.Signed on 2003-09-15. Completion date: 2003-09-15.
$37,372, same as above.Signed on 2002-12-15. Completion date: 2002-12-15.
CASTOR OIL INC (1898 ST HWY 194 in PLAINVIEW, TX; small business) : $12,750 in 2 contractsin 2005
$12,500 with Army for Seeds and Nursery Stock. Signed on 2005-07-13. Completion date: 2005-10-03.
$250, same as above.Signed on 2005-08-16. Completion date: 2005-10-03.
Top industries in this zip code by the number of employees in 2005:
Educational Services: Colleges, Universities, and Professional Schools (500-999 employees: 1 establishment)
Health Care and Social Assistance: General Medical and Surgical Hospitals (250-499: 1, 1-4: 1)
Health Care and Social Assistance: Nursing Care Facilities (100-249: 1, 50-99: 1, 20-49: 1, 1-4: 1)
Other Services (except Public Administration): Religious Organizations (20-49: 2, 10-19: 3, 5-9: 7, 1-4: 15)
People in group quarters in 2010:
1,937 people in state prisons
412 people in college/university student housing
195 people in nursing facilities/skilled-nursing facilities
160 people in local jails and other municipal confinement facilities
14 people in residential treatment centers for adults
10 people in residential treatment centers for juveniles (non-correctional)
6 people in group homes intended for adults
People in group quarters in 2000:
1,515 people in state prisons
385 people in college dormitories (includes college quarters off campus)
281 people in nursing homes
136 people in local jails and other confinement facilities (including police lockups)
21 people in hospitals or wards for drug/alcohol abuse
9 people in schools, hospitals, or wards for the intellectually disabled
9 people in homes or halfway houses for drug/alcohol abuse
2002 - 2018 National Fire Incident Reporting System (NFIRS) incidents
According to the data from the years 2002 - 2018 the average number of fire incidents per year is 122. The highest number of fires - 158 took place in 2011, and the least - 92 in 2002. The data has a growing trend.
When looking into fire subcategories, the most reports belonged to: Outside Fires (47.1%), and Structure Fires (27.6%).
Fire incident types reported to NFIRS in Zip Code 79072


+$3,110
-$9,403
(% of AGI for various income ranges: -18.0% for AGIs below $10k, 0.4% for AGIs $10k-25k, -0.3% for AGIs $25k-50k, 0.8% for AGIs $50k-75k, 2.8% for AGIs $75k-100k, 1.8% for AGIs over 100k) Nearest zip codes: 79052, 79041, 79032, 79250, 79311, 79021.
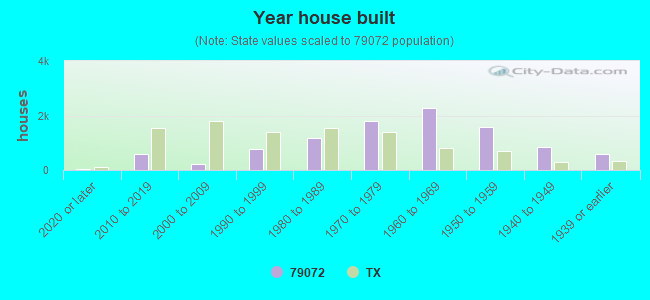


 According to the data from the years 2002 - 2018 the average number of fire incidents per year is 122. The highest number of fires - 158 took place in 2011, and the least - 92 in 2002. The data has a growing trend.
 When looking into fire subcategories, the most reports belonged to: Outside Fires (47.1%), and Structure Fires (27.6%).