Estimated zip code population in 2022: 1,988 Zip code population in 2010: 2,303 Zip code population in 2000: 2,808
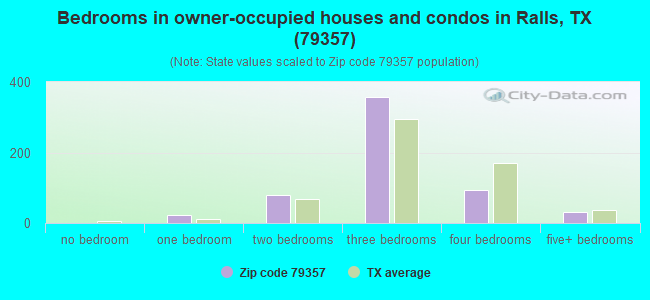
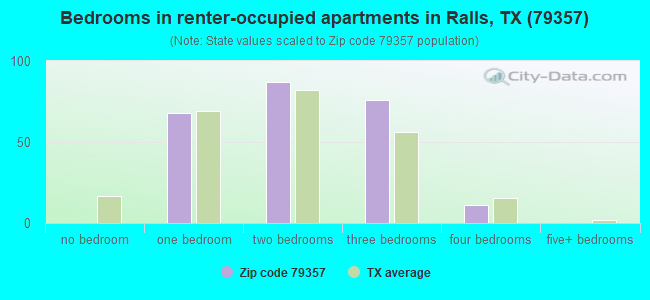
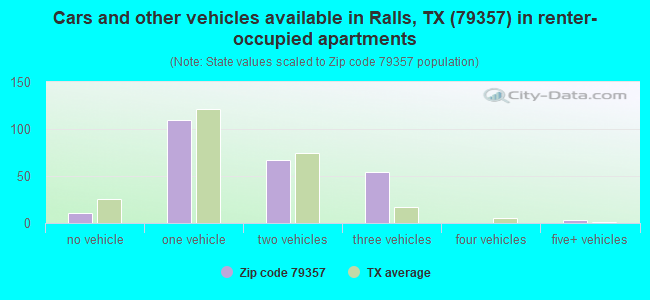
Houses and condos: 1,022 Renter-occupied apartments: 245
% of renters here:
30%
State:
38%
March 2022 cost of living index in zip code 79357: 77.2 (low, U.S. average is 100)
Land area: 218.2 sq. mi. Water area: 0.0 sq. mi.
Population density: 9 people per square mile
(very low).
OSM Map
General Map
Google Map
MSN Map
OSM Map
General Map
Google Map
MSN Map
OSM Map
General Map
Google Map
MSN Map
OSM Map
General Map
Google Map
MSN Map
Please wait while loading the map...
Real estate property taxes paid for housing units in 2022:
This zip code:
1.9% ($1,444)
Texas:
1.5% ($4,050)
Median real estate property taxes paid for housing units with mortgages in 2022: $2,005 (1.6%) Median real estate property taxes paid for housing units with no mortgage in 2022: $1,371 (2.0%)
Business Search- 14 Million verified businesses
Males: 988
(49.7%)
Females: 999
(50.3%)
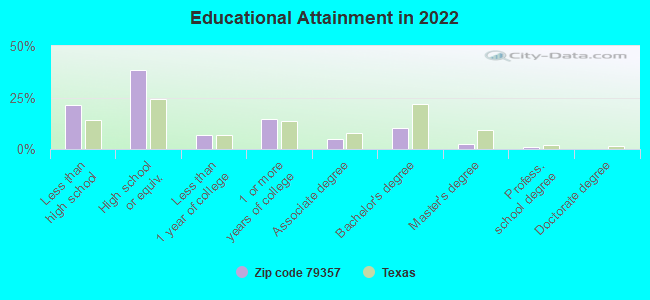
For population 25 years and over in 79357:
High school or higher: 75.9%
Bachelor's degree or higher: 13.6%
Graduate or professional degree: 3.6%
Unemployed: 4.1%
Mean travel time to work (commute): 26.5 minutes
For population 15 years and over in 79357:
Never married: 26.9%
Now married: 52.4%
Separated: 1.6%
Widowed: 5.2%
Divorced: 13.9%
Zip code 79357 compared to state average:
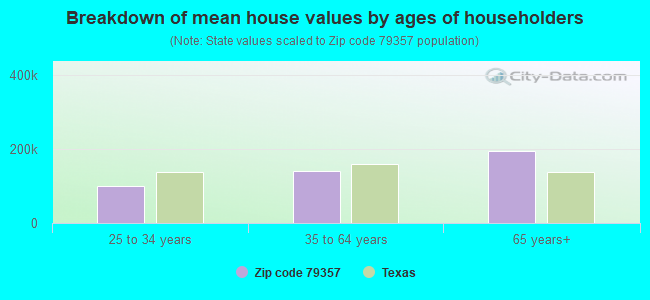
Median house value significantly below state average.
Black race population percentage below state average.
Median age above state average.
Foreign-born population percentage significantly below state average.
Length of stay since moving in significantly above state average.
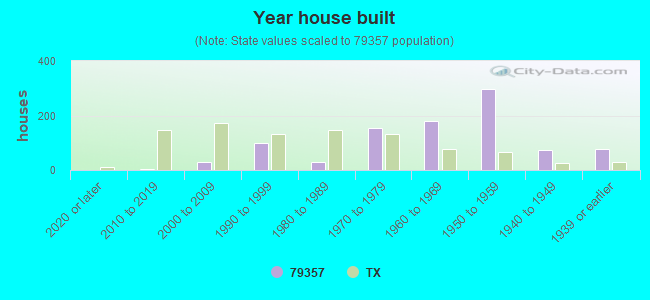
House age above state average.
Number of college students significantly below state average.
Percentage of population with a bachelor's degree or higher significantly below state average.
Averages for the 2020 tax year for zip code 79357, filed in 2021:
Average Adjusted Gross Income (AGI) in 2020: $43,278 (Individual Income Tax Returns)
Here:
$43,278
State:
$77,054
Salary/wage: $33,991 (reported on 86.5% of returns)
Here:
$33,991
State:
$62,766
(% of AGI for various income ranges: 1343.9% for AGIs below $25k, 3855.9% for AGIs $25k-50k, 7337.5% for AGIs $50k-75k, 8720.0% for AGIs $75k-100k, 20830.0% for AGIs $100k-200k)
Taxable interest for individuals: $1,088 (reported on 18.0% of returns)
This zip code:
$1,088
Texas:
$2,665
(% of AGI for various income ranges: 3.2% for AGIs below $25k, 3.6% for AGIs $25k-50k, 42.5% for AGIs $50k-75k, 610.0% for AGIs $100k-200k)
Ordinary dividends: $2,960 (reported on 5.6% of returns)
Here:
$2,960
State:
$10,044
(% of AGI for various income ranges: 18.8% for AGIs $50k-75k, 665.0% for AGIs $100k-200k)
Net capital gain/loss in AGI: +$10,850 (reported on 4.5% of returns)
Here:
+$10,850
State:
+$39,590
(% of AGI for various income ranges: 9.1% for AGIs $25k-50k, 1035.0% for AGIs $75k-100k)
Profit/loss from business: +$6,445 (reported on 12.4% of returns)
Here:
+$6,445
State:
+$10,888
(% of AGI for various income ranges: 117.1% for AGIs below $25k, 100.5% for AGIs $25k-50k, 312.5% for AGIs $75k-100k)
Taxable individual retirement arrangement distribution: $6,567 (reported on 3.4% of returns)
79357:
$6,567
Texas:
$24,740
(% of AGI for various income ranges: 63.5% for AGIs below $25k)
Earned income credit: $2,907 (reported on 31.5% of returns)
Here:
$2,907
State:
$2,584
(% of AGI for various income ranges: 178.4% for AGIs below $25k, 118.6% for AGIs $25k-50k)
Percentage of individuals using paid preparers for their 2020 taxes: 93.3%
Here:
93%
State:
92%
(% for various income ranges: 94.9% for AGIs below $25k, 92.6% for AGIs $25k-50k, 91.7% for AGIs $50k-75k, 100.0% for AGIs $75k-100k, 83.3% for AGIs $100k-200k)
Averages for the 2012 tax year for zip code 79357, filed in 2013:
Average Adjusted Gross Income (AGI) in 2012: $50,362 (Individual Income Tax Returns)
Here:
$50,362
State:
$65,384
Salary/wage: $28,570 (reported on 85.1% of returns)
Here:
$28,570
State:
$52,524
(% of AGI for various income ranges: 79.8% for AGIs below $25k, 89.2% for AGIs $25k-50k, 72.4% for AGIs $50k-75k, 75.5% for AGIs $75k-100k, 38.1% for AGIs $100k-200k)
Taxable interest for individuals: $2,172 (reported on 19.1% of returns)
This zip code:
$2,172
Texas:
$2,372
(% of AGI for various income ranges: 0.3% for AGIs below $25k, 0.4% for AGIs $25k-50k, 0.5% for AGIs $50k-75k, 0.5% for AGIs $75k-100k, 1.7% for AGIs $100k-200k, 1.2% for AGIs over 200k)
Ordinary dividends: $3,229 (reported on 7.4% of returns)
Here:
$3,229
State:
$9,721
Net capital gain/loss in AGI: +$175,180 (reported on 5.3% of returns)
Here:
+$175,180
State:
+$35,319
Profit/loss from business: +$11,564 (reported on 14.9% of returns)
Here:
+$11,564
State:
+$13,732
(% of AGI for various income ranges: 10.2% for AGIs below $25k, 1.9% for AGIs $25k-50k, 2.3% for AGIs $50k-75k, 12.1% for AGIs $100k-200k)
Taxable individual retirement arrangement distribution: $9,140 (reported on 5.3% of returns)
79357:
$9,140
Texas:
$19,511
Total itemized deductions: $30,356 (15% of AGI, reported on 9.6% of returns)
Here:
$30,356
State:
$24,724
Here:
15.4% of AGI
State:
15.9% of AGI
(% of AGI for various income ranges: 7.3% for AGIs below $25k, 7.4% for AGIs $50k-75k, 30.6% for AGIs $100k-200k)
Charity contributions: $17,700 (reported on 6.4% of returns)
Here:
$17,700
State:
$6,808
Taxes paid: $2,889 (reported on 9.6% of returns)
79357:
$2,889
State:
$6,921
(% of AGI for various income ranges: 0.6% for AGIs below $25k, 1.1% for AGIs $50k-75k, 2.5% for AGIs $100k-200k)
Earned income credit: $2,718 (reported on 36.2% of returns)
Here:
$2,718
State:
$2,570
(% of AGI for various income ranges: 11.7% for AGIs below $25k, 2.9% for AGIs $25k-50k)
Percentage of individuals using paid preparers for their 2012 taxes: 47.9%
Here:
48%
State:
51%
(% for various income ranges: 40.9% for AGIs below $25k, 44.4% for AGIs $25k-50k, 63.6% for AGIs $50k-75k, 60.0% for AGIs $75k-100k, 60.0% for AGIs $100k-200k, 100.0% for AGIs over 200k)
Averages for the 2004 tax year for zip code 79357, filed in 2005:
Average Adjusted Gross Income (AGI) in 2004: $28,373 (Individual Income Tax Returns)
Here:
$28,373
State:
$47,881
Salary/wage: $22,201 (reported on 83.9% of returns)
Here:
$22,201
State:
$41,947
(% of AGI for various income ranges: 87.8% for AGIs below $10k, 87.5% for AGIs $10k-25k, 80.6% for AGIs $25k-50k, 68.2% for AGIs $50k-75k, 45.2% for AGIs $75k-100k, 25.8% for AGIs over 100k)
Taxable interest for individuals: $2,467 (reported on 22.9% of returns)
This zip code:
$2,467
Texas:
$2,255
(% of AGI for various income ranges: 4.6% for AGIs below $10k, 0.8% for AGIs $10k-25k, 1.5% for AGIs $25k-50k, 1.9% for AGIs $50k-75k, 2.7% for AGIs $75k-100k, 3.2% for AGIs over 100k)
Taxable dividends: $1,930 (reported on 7.1% of returns)
Here:
$1,930
State:
$4,261
(% of AGI for various income ranges: 0.3% for AGIs below $10k, 0.2% for AGIs $25k-50k, 1.3% for AGIs $50k-75k, 0.9% for AGIs over 100k)
Net capital gain/loss: +$1,784 (reported on 7.4% of returns)
Here:
+$1,784
State:
+$16,110
(% of AGI for various income ranges: 0.1% for AGIs below $10k, 0.1% for AGIs $25k-50k, 2.5% for AGIs $50k-75k, 0.1% for AGIs over 100k)
Profit/loss from business: +$8,013 (reported on 15.1% of returns)
Here:
+$8,013
State:
+$11,013
(% of AGI for various income ranges: 9.7% for AGIs below $10k, 2.9% for AGIs $10k-25k, 3.3% for AGIs $25k-50k, 2.6% for AGIs $50k-75k, 8.1% for AGIs over 100k)
Profit/loss from farming: +$23,986 (reported on 7.4% of returns)
Here:
+$23,986
State:
-$9,403
(% of AGI for various income ranges: -18.4% for AGIs below $10k, -0.5% for AGIs $25k-50k, 1.9% for AGIs $50k-75k, 30.1% for AGIs over 100k)
IRA payment deduction: $4,000 (reported on 1.1% of returns)
79357:
$4,000
Texas:
$3,120
Total itemized deductions: $17,500 (24% of AGI, reported on 8.6% of returns)
Here:
$17,500
State:
$19,631
Here:
24.2% of AGI
State:
18.9% of AGI
(% of AGI for various income ranges: 3.9% for AGIs $10k-25k, 4.6% for AGIs $25k-50k, 7.5% for AGIs $50k-75k, 8.3% for AGIs over 100k)
Charity contributions deductions: $4,973 (7% of AGI, reported on 7.3% of returns)
Here:
$4,973
State:
$4,753
Here:
7.3% of AGI
State:
4.2% of AGI
(% of AGI for various income ranges: 0.6% for AGIs $10k-25k, 0.8% for AGIs $25k-50k, 1.6% for AGIs $50k-75k, 2.9% for AGIs over 100k)
Total tax: $4,955 (reported on 55.0% of returns)
79357:
$4,955
State:
$9,058
(% of AGI for various income ranges: 3.7% for AGIs below $10k, 2.6% for AGIs $10k-25k, 5.4% for AGIs $25k-50k, 9.9% for AGIs $50k-75k, 11.1% for AGIs $75k-100k, 22.0% for AGIs over 100k)
Earned income credit: $2,195 (reported on 36.9% of returns)
Here:
$2,195
State:
$2,024
Percentage of individuals using paid preparers for their 2004 taxes: 65.3%
Here:
65%
State:
57%
(% for various income ranges: 64.9% for AGIs below $10k, 69.7% for AGIs $10k-25k, 57.7% for AGIs $25k-50k, 50.6% for AGIs $50k-75k, 81.0% for AGIs $75k-100k, 87.8% for AGIs over 100k)
Household received Food Stamps/SNAP in the past 12 months: 188 Household did not receive Food Stamps/SNAP in the past 12 months: 648
Women who did not have a birth in the past 12 months: 464 (188 now married, 276 unmarried)
Housing units in zip code 79357 with a mortgage: 140 Median monthly owner costs for units with a mortgage: $1,189 Median monthly owner costs for units without a mortgage: $457
Residents with income below the poverty level in 2022:
This zip code:
18.0%
Whole state:
14.0%
Residents with income below 50% of the poverty level in 2022:
This zip code:
13.1%
Whole state:
7.4%
Median number of rooms in houses and condos:
Here:
6.2
State:
6.3
Median number of rooms in apartments:
Here:
4.6
State:
4.0
Notable locations in this zip code not listed on our city pages
In group quarters: 35 (-1 institutionalized population)
Size of family households: 221 2-persons, 145 3-persons, 163 4-persons, 62 5-persons, 19 6-persons, 20 7-or-more-persons
Size of nonfamily households: 163 1-person, 32 2-persons
244 married couples with children.
187 single-parent households (32 men, 155 women).
65.2% of residents of 79357 zip code speak English at home.
33.8% of residents speak Spanish at home (85% very well, 10% well, 5% not well, 1% not at all).
0.2% of residents speak other Indo-European language at home (100% very well).
1.0% of residents speak Asian or Pacific Island language at home (100% very well).
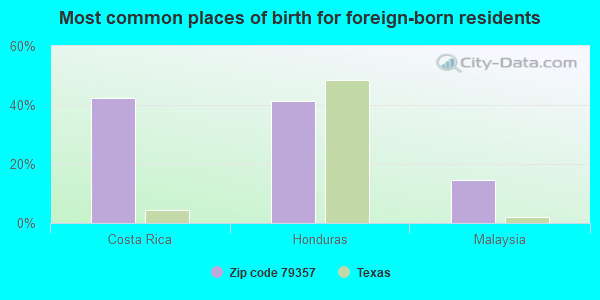
Foreign born population: 116 (5.9%) (46.4% of them are naturalized citizens)
This zip code:
5.9%
Whole state:
17.2%
42%Costa Rica
41%Honduras
15%Malaysia
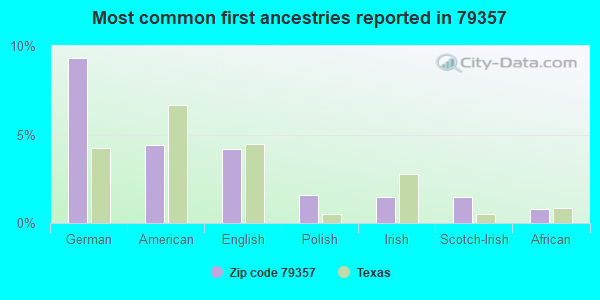
9%German
4%American
4%English
2%Polish
1%Irish
1%Scotch-Irish
1%African
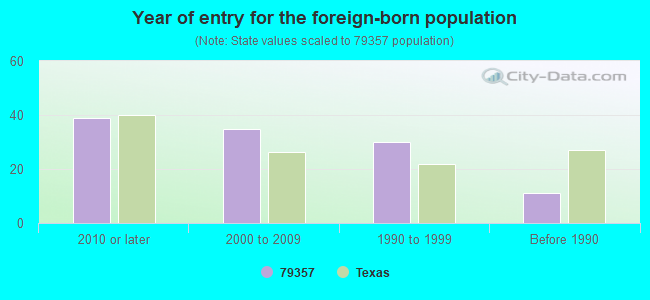
Year of entry for the foreign-born population
392010 or later
352000 to 2009
301990 to 1999
11Before 1990
Housing units lacking complete plumbing facilities: 11.3% Housing units lacking complete kitchen facilities: 11.2%
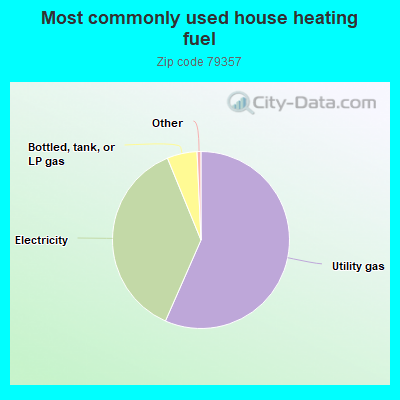
56.7%Utility gas
37.3%Electricity
5.5%Bottled, tank, or LP gas
Population in 1990: 2,840.
Place of birth for U.S.-born residents:
This state: 1,677
Northeast: 8
Midwest: 31
South: 69
West: 68
58% of the 79357 zip code residents lived in the same house 5 years ago. Out of people who lived in different houses, 66% lived in this county. Out of people who lived in different counties, 50% lived in Texas.
95% of the 79357 zip code residents lived in the same house 1 year ago. Out of people who lived in different houses, 18% moved from this county. Out of people who lived in different houses, 89% moved from different county within same state.
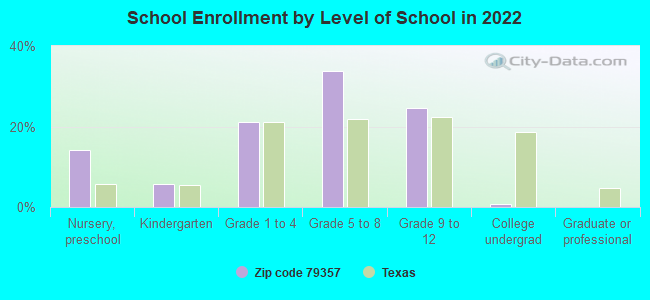
Private vs. public school enrollment:
Students in private schools in grades 1 to 8 (elementary and middle school): 27
Here:
10.3%
Texas:
8.8%
Students in private schools in grades 9 to 12 (high school): 6
Here:
5.5%
Texas:
8.0%
Students in private undergraduate colleges:
Here:
0.0%
Texas:
16.2%
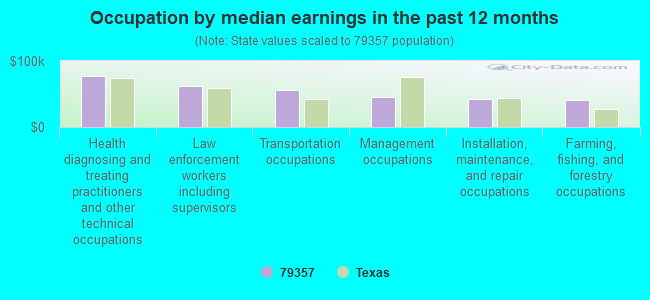
Occupation by median earnings in the past 12 months ($)
77,329Health diagnosing and treating practitioners and other technical occupations
61,913Law enforcement workers including supervisors
55,574Transportation occupations
45,482Management occupations
41,742Installation, maintenance, and repair occupations
40,700Farming, fishing, and forestry occupations
Top industries in this zip code by the number of employees in 2005:
Wholesale Trade: Grain and Field Bean Merchant Wholesalers (20-49 employees: 1 establishment)
Other Services (except Public Administration): Religious Organizations (5-9: 2, 1-4: 3)
Finance and Insurance: Insurance Agencies and Brokerages (5-9: 1, 1-4: 1)
Finance and Insurance: Commercial Banking (5-9: 1)
People in group quarters in 2010:
29 people in nursing facilities/skilled-nursing facilities
People in group quarters in 2000:
26 people in nursing homes
3 people in other noninstitutional group quarters
Fatal accident statistics in 2014:
Fatal accident count: 1
Vehicles involved in fatal accidents: 1
Fatal accidents caused by drunken drivers: 1
Fatalities: 1
Persons involved in fatal accidents: 1
Pedestrians involved in fatal accidents: 0
Fatal accident statistics in 2011:
Fatal accident count: 1
Vehicles involved in fatal accidents: 2
Fatal accidents caused by drunken drivers: 0
Fatalities: 1
Persons involved in fatal accidents: 3
Pedestrians involved in fatal accidents: 0
Most common first names in zip code 79357 among deceased individuals
Name
Count
Lived (average)
William
27
79.0 years
James
21
77.3 years
John
18
75.2 years
Mary
17
76.1 years
George
11
72.9 years
Joe
11
71.4 years
Robert
11
76.4 years
Willie
10
79.9 years
Ethel
9
85.8 years
Lee
9
77.0 years
Most common last names in zip code 79357 among deceased individuals
Last name
Count
Lived (average)
Williams
13
75.5 years
Reed
13
81.2 years
Reese
10
78.6 years
Martin
10
74.8 years
Smith
10
75.7 years
Moore
9
81.0 years
Adams
8
77.9 years
Jones
8
81.3 years
Davis
8
83.5 years
Anderson
8
77.6 years
Discuss Ralls, Texas (TX) on our hugely popular Texas forum.


+$23,986
-$9,403
(% of AGI for various income ranges: -18.4% for AGIs below $10k, -0.5% for AGIs $25k-50k, 1.9% for AGIs $50k-75k, 30.1% for AGIs over 100k) Nearest zip codes: 79343, 79322, 79364, 79329, 79366, 79250.