Estimated zip code population in 2022: 3,163 Zip code population in 2010: 3,469 Zip code population in 2000: 4,031
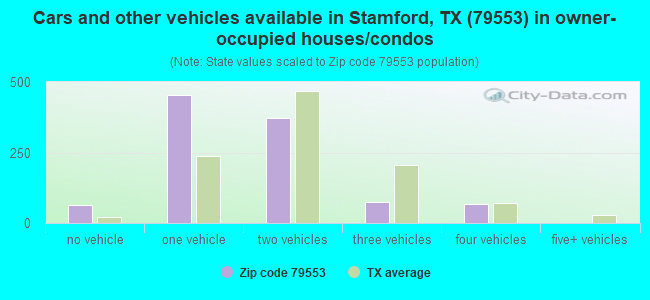
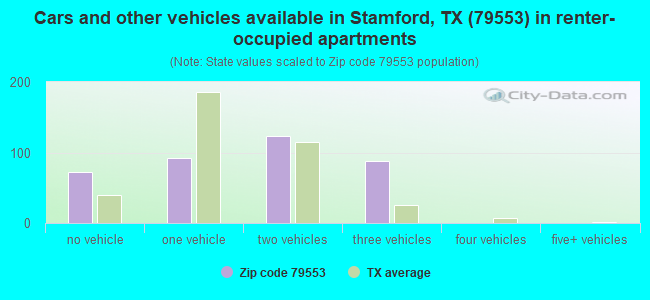
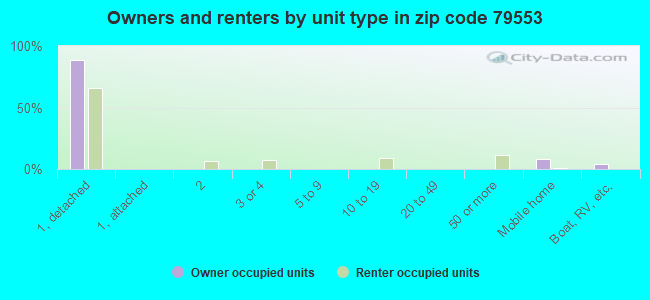
Houses and condos: 1,618 Renter-occupied apartments: 379
% of renters here:
27%
State:
38%
March 2022 cost of living index in zip code 79553: 81.3 (low, U.S. average is 100)
Land area: 166.2 sq. mi. Water area: 0.4 sq. mi.
Population density: 19 people per square mile
(very low).
OSM Map
General Map
Google Map
MSN Map
OSM Map
General Map
Google Map
MSN Map
OSM Map
General Map
Google Map
MSN Map
OSM Map
General Map
Google Map
MSN Map
Please wait while loading the map...
Real estate property taxes paid for housing units in 2022:
This zip code:
1.8% ($1,541)
Texas:
1.5% ($4,050)
Median real estate property taxes paid for housing units with mortgages in 2022: $1,714 (1.9%) Median real estate property taxes paid for housing units with no mortgage in 2022: $1,488 (2.1%)
Averages for the 2020 tax year for zip code 79553, filed in 2021:
Average Adjusted Gross Income (AGI) in 2020: $49,151 (Individual Income Tax Returns)
Here:
$49,151
State:
$77,054
Salary/wage: $40,128 (reported on 82.1% of returns)
Here:
$40,128
State:
$62,766
(% of AGI for various income ranges: 1243.9% for AGIs below $25k, 3410.7% for AGIs $25k-50k, 6293.8% for AGIs $50k-75k, 10573.3% for AGIs $75k-100k, 15563.3% for AGIs $100k-200k)
Taxable interest for individuals: $589 (reported on 20.1% of returns)
This zip code:
$589
Texas:
$2,665
(% of AGI for various income ranges: 9.8% for AGIs below $25k, 7.6% for AGIs $25k-50k, 10.0% for AGIs $50k-75k, 18.3% for AGIs $75k-100k, 116.7% for AGIs $100k-200k)
Ordinary dividends: $4,253 (reported on 14.2% of returns)
Here:
$4,253
State:
$10,044
(% of AGI for various income ranges: 25.2% for AGIs below $25k, 35.9% for AGIs $25k-50k, 50.0% for AGIs $50k-75k, 880.0% for AGIs $100k-200k)
Net capital gain/loss in AGI: +$11,629 (reported on 12.7% of returns)
Here:
+$11,629
State:
+$39,590
(% of AGI for various income ranges: 20.5% for AGIs below $25k, 22.1% for AGIs $25k-50k, 78.5% for AGIs $50k-75k, 2868.3% for AGIs $100k-200k)
Profit/loss from business: +$10,714 (reported on 16.4% of returns)
Here:
+$10,714
State:
+$10,888
(% of AGI for various income ranges: 88.9% for AGIs below $25k, 53.4% for AGIs $25k-50k, 297.7% for AGIs $50k-75k, 2381.7% for AGIs $100k-200k)
Taxable individual retirement arrangement distribution: $18,100 (reported on 6.7% of returns)
79553:
$18,100
Texas:
$24,740
(% of AGI for various income ranges: 67.3% for AGIs below $25k, 283.1% for AGIs $50k-75k, 1608.3% for AGIs $100k-200k)
Total itemized deductions: $31,450 (reported on 3.0% of returns)
Here:
$31,450
State:
$40,428
(% of AGI for various income ranges: 2096.7% for AGIs $100k-200k)
Charity contributions: $15,367 (reported on 2.2% of returns)
Here:
$15,367
State:
$18,201
(% of AGI for various income ranges: 768.3% for AGIs $75k-100k)
Taxes paid: $5,033 (reported on 2.2% of returns)
79553:
$5,033
State:
$7,821
(% of AGI for various income ranges: 251.7% for AGIs $100k-200k)
Earned income credit: $2,497 (reported on 28.4% of returns)
Here:
$2,497
State:
$2,584
(% of AGI for various income ranges: 146.6% for AGIs below $25k, 104.8% for AGIs $25k-50k)
Percentage of individuals using paid preparers for their 2020 taxes: 94.8%
Here:
95%
State:
92%
(% for various income ranges: 94.7% for AGIs below $25k, 97.1% for AGIs $25k-50k, 94.4% for AGIs $50k-75k, 80.0% for AGIs $75k-100k, 100.0% for AGIs $100k-200k, 100.0% for AGIs over 200k)
Averages for the 2012 tax year for zip code 79553, filed in 2013:
Average Adjusted Gross Income (AGI) in 2012: $42,531 (Individual Income Tax Returns)
Here:
$42,531
State:
$65,384
Salary/wage: $34,103 (reported on 85.4% of returns)
Here:
$34,103
State:
$52,524
(% of AGI for various income ranges: 80.8% for AGIs below $25k, 82.6% for AGIs $25k-50k, 75.9% for AGIs $50k-75k, 71.2% for AGIs $75k-100k, 93.3% for AGIs $100k-200k)
Taxable interest for individuals: $919 (reported on 23.4% of returns)
This zip code:
$919
Texas:
$2,372
(% of AGI for various income ranges: 1.0% for AGIs below $25k, 0.2% for AGIs $25k-50k, 0.3% for AGIs $50k-75k, 0.3% for AGIs $75k-100k, 1.1% for AGIs $100k-200k)
Ordinary dividends: $3,132 (reported on 16.1% of returns)
Here:
$3,132
State:
$9,721
(% of AGI for various income ranges: 1.0% for AGIs below $25k, 0.4% for AGIs $25k-50k, 0.7% for AGIs $50k-75k, 0.9% for AGIs $75k-100k, 3.6% for AGIs $100k-200k)
Net capital gain/loss in AGI: +$3,972 (reported on 13.1% of returns)
Here:
+$3,972
State:
+$35,319
(% of AGI for various income ranges: 0.3% for AGIs below $25k, 0.1% for AGIs $25k-50k, 1.2% for AGIs $50k-75k, 4.8% for AGIs $100k-200k)
Profit/loss from business: +$8,093 (reported on 19.7% of returns)
Here:
+$8,093
State:
+$13,732
(% of AGI for various income ranges: 6.7% for AGIs below $25k, 2.8% for AGIs $25k-50k, 3.8% for AGIs $50k-75k, 7.6% for AGIs $100k-200k)
Taxable individual retirement arrangement distribution: $10,618 (reported on 8.0% of returns)
79553:
$10,618
Texas:
$19,511
(% of AGI for various income ranges: 1.6% for AGIs below $25k, 1.8% for AGIs $25k-50k, 2.7% for AGIs $50k-75k, 4.7% for AGIs $100k-200k)
Total itemized deductions: $22,481 (19% of AGI, reported on 11.7% of returns)
Here:
$22,481
State:
$24,724
Here:
19.2% of AGI
State:
15.9% of AGI
(% of AGI for various income ranges: 9.0% for AGIs $25k-50k, 9.5% for AGIs $50k-75k, 14.0% for AGIs $100k-200k)
Charity contributions: $7,669 (reported on 9.5% of returns)
Here:
$7,669
State:
$6,808
(% of AGI for various income ranges: 1.3% for AGIs $25k-50k, 1.7% for AGIs $50k-75k, 5.8% for AGIs $100k-200k)
Taxes paid: $3,894 (reported on 11.7% of returns)
79553:
$3,894
State:
$6,921
(% of AGI for various income ranges: 0.9% for AGIs $25k-50k, 1.6% for AGIs $50k-75k, 3.1% for AGIs $100k-200k)
Earned income credit: $2,580 (reported on 32.1% of returns)
Here:
$2,580
State:
$2,570
(% of AGI for various income ranges: 10.2% for AGIs below $25k, 1.9% for AGIs $25k-50k)
Percentage of individuals using paid preparers for their 2012 taxes: 62.8%
Here:
63%
State:
51%
(% for various income ranges: 58.6% for AGIs below $25k, 59.4% for AGIs $25k-50k, 68.8% for AGIs $50k-75k, 75.0% for AGIs $75k-100k, 100.0% for AGIs $100k-200k)
Averages for the 2004 tax year for zip code 79553, filed in 2005:
Average Adjusted Gross Income (AGI) in 2004: $28,079 (Individual Income Tax Returns)
Here:
$28,079
State:
$47,881
Salary/wage: $24,305 (reported on 81.0% of returns)
Here:
$24,305
State:
$41,947
(% of AGI for various income ranges: 134.0% for AGIs below $10k, 79.9% for AGIs $10k-25k, 74.4% for AGIs $25k-50k, 70.3% for AGIs $50k-75k, 53.4% for AGIs $75k-100k, 51.3% for AGIs over 100k)
Taxable interest for individuals: $1,957 (reported on 32.2% of returns)
This zip code:
$1,957
Texas:
$2,255
(% of AGI for various income ranges: 8.8% for AGIs below $10k, 2.0% for AGIs $10k-25k, 2.7% for AGIs $25k-50k, 1.4% for AGIs $50k-75k, 3.2% for AGIs $75k-100k, 0.4% for AGIs over 100k)
Taxable dividends: $1,940 (reported on 19.8% of returns)
Here:
$1,940
State:
$4,261
(% of AGI for various income ranges: 5.2% for AGIs below $10k, 0.9% for AGIs $10k-25k, 0.5% for AGIs $25k-50k, 1.8% for AGIs $50k-75k, 2.4% for AGIs $75k-100k, 0.9% for AGIs over 100k)
Net capital gain/loss: +$1,375 (reported on 18.4% of returns)
Here:
+$1,375
State:
+$16,110
(% of AGI for various income ranges: -1.4% for AGIs below $10k, 0.6% for AGIs $10k-25k, 0.7% for AGIs $25k-50k, 1.0% for AGIs $50k-75k, 2.7% for AGIs $75k-100k, 0.2% for AGIs over 100k)
Profit/loss from business: +$6,787 (reported on 19.7% of returns)
Here:
+$6,787
State:
+$11,013
(% of AGI for various income ranges: 6.2% for AGIs below $10k, 3.5% for AGIs $10k-25k, 5.7% for AGIs $25k-50k, 5.3% for AGIs $50k-75k, 6.2% for AGIs $75k-100k, 2.1% for AGIs over 100k)
IRA payment deduction: $3,115 (reported on 1.8% of returns)
79553:
$3,115
Texas:
$3,120
Total itemized deductions: $14,809 (22% of AGI, reported on 9.5% of returns)
Here:
$14,809
State:
$19,631
Here:
21.9% of AGI
State:
18.9% of AGI
(% of AGI for various income ranges: 11.7% for AGIs below $10k, 2.0% for AGIs $10k-25k, 3.9% for AGIs $25k-50k, 5.8% for AGIs $50k-75k, 6.4% for AGIs $75k-100k, 7.2% for AGIs over 100k)
Charity contributions deductions: $5,159 (7% of AGI, reported on 7.9% of returns)
Here:
$5,159
State:
$4,753
Here:
7.0% of AGI
State:
4.2% of AGI
(% of AGI for various income ranges: 0.8% for AGIs $10k-25k, 0.5% for AGIs $25k-50k, 1.9% for AGIs $50k-75k, 2.2% for AGIs $75k-100k, 3.0% for AGIs over 100k)
Total tax: $4,283 (reported on 61.0% of returns)
79553:
$4,283
State:
$9,058
(% of AGI for various income ranges: 4.5% for AGIs below $10k, 3.4% for AGIs $10k-25k, 6.3% for AGIs $25k-50k, 9.3% for AGIs $50k-75k, 12.8% for AGIs $75k-100k, 20.7% for AGIs over 100k)
Earned income credit: $2,109 (reported on 31.8% of returns)
Here:
$2,109
State:
$2,024
Percentage of individuals using paid preparers for their 2004 taxes: 74.4%
Here:
74%
State:
57%
(% for various income ranges: 73.2% for AGIs below $10k, 74.9% for AGIs $10k-25k, 72.0% for AGIs $25k-50k, 75.2% for AGIs $50k-75k, 80.6% for AGIs $75k-100k, 87.5% for AGIs over 100k)
Likely homosexual households (counted as self-reported same-sex unmarried-partner households)
Lesbian couples: 0.0% of all households
Gay men: 0.9% of all households
Household received Food Stamps/SNAP in the past 12 months: 239 Household did not receive Food Stamps/SNAP in the past 12 months: 1,168
Women who had a birth in the past 12 months: 94 (12 now married, 78 unmarried) Women who did not have a birth in the past 12 months: 585 (322 now married, 261 unmarried)
Housing units in zip code 79553 with a mortgage: 227 Median monthly owner costs for units with a mortgage: $1,053 Median monthly owner costs for units without a mortgage: $531
Residents with income below the poverty level in 2022:
This zip code:
23.7%
Whole state:
14.0%
Residents with income below 50% of the poverty level in 2022:
This zip code:
12.1%
Whole state:
7.4%
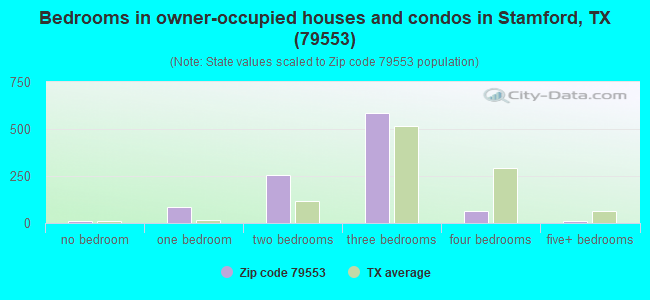
Median number of rooms in houses and condos:
Here:
5.9
State:
6.3
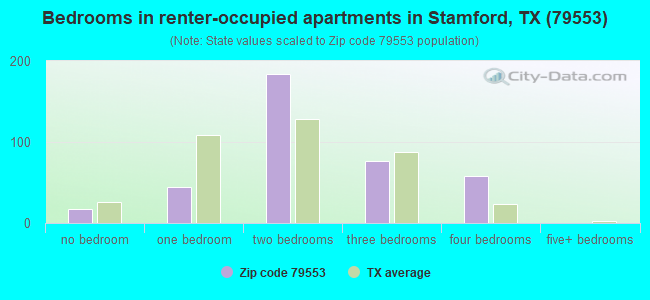
Median number of rooms in apartments:
Here:
4.7
State:
4.0
Notable locations in this zip code not listed on our city pages
Notable locations in zip code 79553: Stamford Country Club (A), Texas Cowboy Reunion Grounds (B), J P Astin House (C), Stamford Fire Department (D), Stamford Emergency Medical Service (E), Doctor E P Bunkley House and Garage (F), Buena Vista Hotel (G), A J Jackson House (H), A J Swenson House (I), Old Penick-Hughes Company Building (J), Old West Texas Utilities Company (K), Old H O Wooten Grocery (L), Old Bryant-Link Building (M), Cowboy Country Museum (N), Swenson Building (O), Stamford City Hall (P). Display/hide their locations on the map
Churches in zip code 79553 include: Saint Anns Church (A), Saint Johns Church (B), Trinity Church (C), Tuxedo Church (D), Saint Johns Methodist Church (E), First Baptist Church (F), Calvary Church (G), Central Church (H), Fairview Church (I). Display/hide their locations on the map
Creeks: Turkey Paint Creek (A), Thompson Creek (B), Skinout Creek (C), Redmud Creek (D), Red Paint Creek (E), Dudleys Creek (F), Willow Creek (G). Display/hide their locations on the map
In group quarters: 147 (-1 institutionalized population)
Size of family households: 313 2-persons, 247 3-persons, 160 4-persons, 54 5-persons, 56 6-persons, 17 7-or-more-persons
Size of nonfamily households: 518 1-person, 15 2-persons, 23 4-persons
398 married couples with children.
250 single-parent households (74 men, 176 women).
81.5% of residents of 79553 zip code speak English at home.
15.9% of residents speak Spanish at home (61% very well, 30% well, 8% not well).
2.5% of residents speak other Indo-European language at home (100% very well).
0.5% of residents speak Asian or Pacific Island language at home (100% very well).
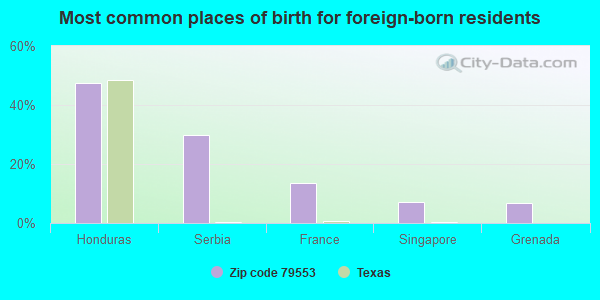
Foreign born population: 219 (6.9%) (34.6% of them are naturalized citizens)
This zip code:
6.9%
Whole state:
17.2%
48%Honduras
30%Serbia
14%France
7%Singapore
7%Grenada
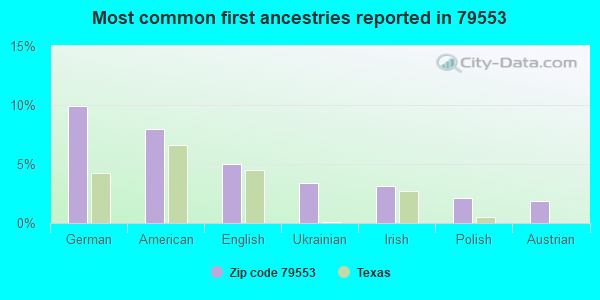
10%German
8%American
5%English
3%Ukrainian
3%Irish
2%Polish
2%Austrian
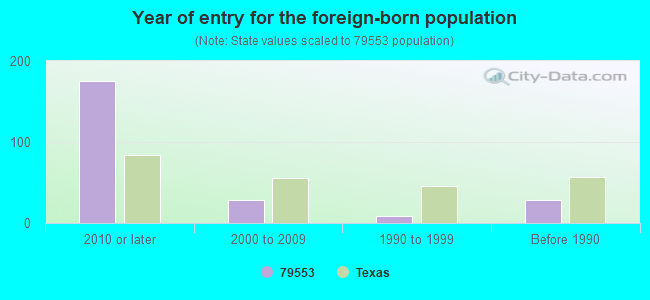
Year of entry for the foreign-born population
1752010 or later
292000 to 2009
91990 to 1999
29Before 1990
Facilities with environmental interests located in this zip code:
AEP TEXAS NORTH COMPANY (102 E REYNOLDS ST in STAMFORD, TX)
(Resource Conservation and Recovery Act (tracking hazardous waste)) Business NAICS classification: ELECTRIC POWER DISTRIBUTION. Alternative names: STAMFORD SERVICE CENTER
AMERICAN TELEPHONE AND TELEGRAPH COMPANY (5.5 MI S SW L435190 in STAMFORD, TX)
(Resource Conservation and Recovery Act (tracking hazardous waste)) Alternative names: AMERICAN TEL & TEL CO LONG LINES
AFCO NO 10110 (911 E HAMILTON in STAMFORD, TX)
Conditionally Exempt Small Quantity Generators, less than 100 kg/month of hazardous waste (Resource Conservation and Recovery Act (tracking hazardous waste)) - notification Organizations: MICOR ENERGY LLC DBA AFCO (CONTACT/OWNER)
Housing units lacking complete plumbing facilities: 9.5% Housing units lacking complete kitchen facilities: 13.9%
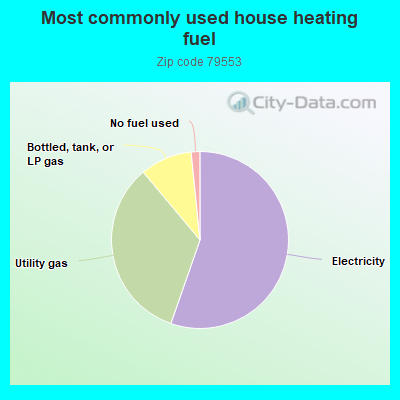
55.4%Electricity
33.6%Utility gas
9.5%Bottled, tank, or LP gas
1.6%No fuel used
Population in 1990: 4,338.
Place of birth for U.S.-born residents:
This state: 2,552
Northeast: 93
Midwest: 121
South: 75
West: 71
58% of the 79553 zip code residents lived in the same house 5 years ago. Out of people who lived in different houses, 50% lived in this county. Out of people who lived in different counties, 50% lived in Texas.
91% of the 79553 zip code residents lived in the same house 1 year ago. Out of people who lived in different houses, 51% moved from this county. Out of people who lived in different houses, 48% moved from different county within same state.
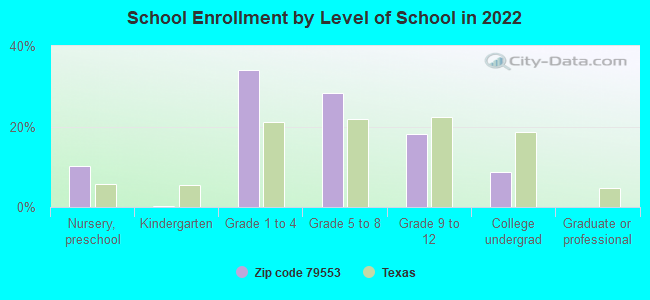
Private vs. public school enrollment:
Students in private schools in grades 1 to 8 (elementary and middle school): 6
Here:
1.5%
Texas:
8.8%
Students in private schools in grades 9 to 12 (high school):
Here:
0.0%
Texas:
8.0%
Students in private undergraduate colleges:
Here:
0.0%
Texas:
16.2%
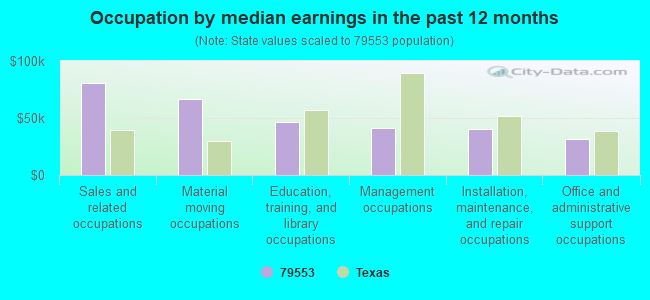
Occupation by median earnings in the past 12 months ($)
80,632Sales and related occupations
66,294Material moving occupations
46,586Education, training, and library occupations
41,043Management occupations
39,937Installation, maintenance, and repair occupations
31,242Office and administrative support occupations
Companies with federal contracts located in this zip code:
DUNCAN DISPOSAL, INC (501 W MCHARG in STAMFORD, TX; small business)
$14,409 with Army for Trash/Garbage Collection Services - Including Portable Sanitation Services. Signed on 2005-01-31. Completion date: 2006-03-31.
Top industries in this zip code by the number of employees in 2005:
Health Care and Social Assistance: General Medical and Surgical Hospitals (100-249 employees: 1 establishment)
Health Care and Social Assistance: Residential Mental Retardation Facilities (50-99: 1, 20-49: 1)
Health Care and Social Assistance: Nursing Care Facilities (50-99: 1)
Accommodation and Food Services: Full-Service Restaurants (20-49: 1, 10-19: 2)
Mining: Support Activities for Oil and Gas Operations (20-49: 1, 10-19: 1)
Mining: Drilling Oil and Gas Wells (20-49: 1)
People in group quarters in 2010:
68 people in nursing facilities/skilled-nursing facilities
61 people in residential treatment centers for adults
People in group quarters in 2000:
89 people in nursing homes
69 people in homes for the mentally retarded
Fatal accident statistics in 2014:
Fatal accident count: 1
Vehicles involved in fatal accidents: 1
Fatal accidents caused by drunken drivers: 1
Fatalities: 1
Persons involved in fatal accidents: 1
Pedestrians involved in fatal accidents: 0
Fatal accident statistics in 2013:
Fatal accident count: 1
Vehicles involved in fatal accidents: 1
Fatal accidents caused by drunken drivers: 0
Fatalities: 1
Persons involved in fatal accidents: 1
Pedestrians involved in fatal accidents: 0
2002 - 2010 National Fire Incident Reporting System (NFIRS) incidents
According to the data from the years 2002 - 2010 the average number of fire incidents per year is 70. The highest number of fire incidents - 116 took place in 2008, and the least - 42 in 2002. The data has a growing trend.
When looking into fire subcategories, the most incidents belonged to: Outside Fires (67.7%), and Structure Fires (18.9%).
Fire incident types reported to NFIRS in Zip Code 79553


 Nearest zip codes: 79548, 79503, 79501, 79547, 79521, 79520.
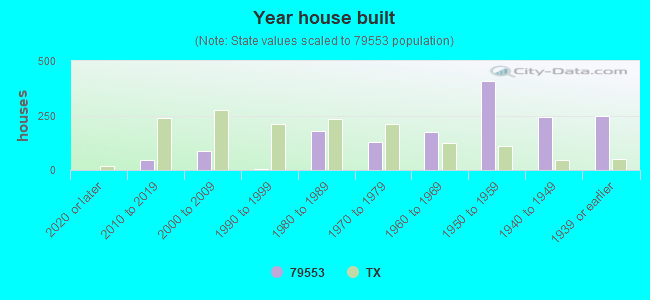


 According to the data from the years 2002 - 2010 the average number of fire incidents per year is 70. The highest number of fire incidents - 116 took place in 2008, and the least - 42 in 2002. The data has a growing trend.
 When looking into fire subcategories, the most incidents belonged to: Outside Fires (67.7%), and Structure Fires (18.9%).