Estimated zip code population in 2022: 33,165 Zip code population in 2010: 33,640 Zip code population in 2000: 32,200
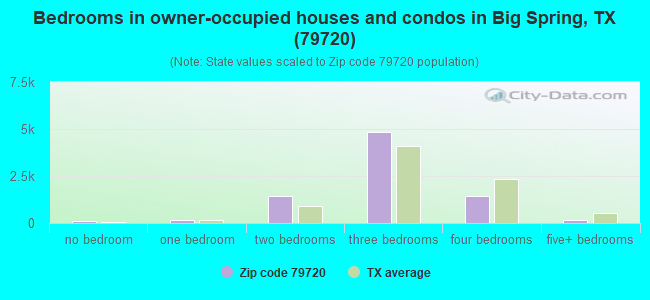
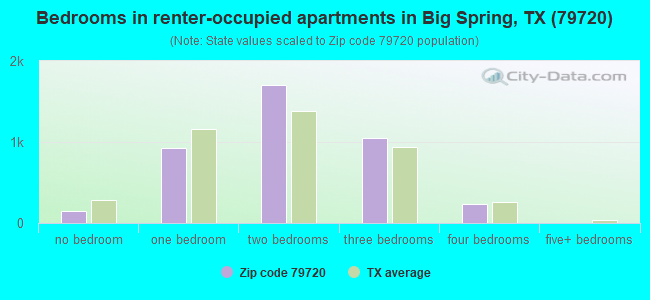
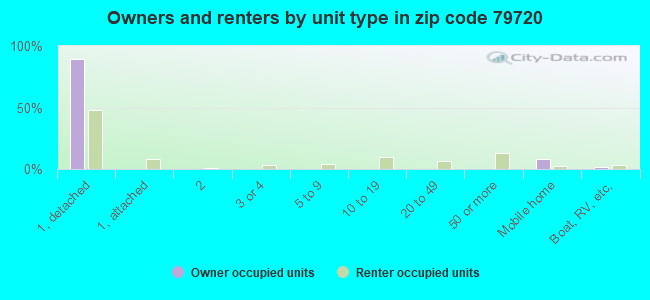
Houses and condos: 13,957 Renter-occupied apartments: 4,088
% of renters here:
34%
State:
38%
March 2022 cost of living index in zip code 79720: 77.9 (low, U.S. average is 100)
Land area: 911.0 sq. mi. Water area: 3.1 sq. mi.
Population density: 36 people per square mile
(very low).
OSM Map
General Map
Google Map
MSN Map
OSM Map
General Map
Google Map
MSN Map
OSM Map
General Map
Google Map
MSN Map
OSM Map
General Map
Google Map
MSN Map
Please wait while loading the map...
Real estate property taxes paid for housing units in 2022:
This zip code:
1.1% ($1,730)
Texas:
1.5% ($4,050)
Median real estate property taxes paid for housing units with mortgages in 2022: $2,245 (1.1%) Median real estate property taxes paid for housing units with no mortgage in 2022: $1,421 (1.2%)
Averages for the 2020 tax year for zip code 79720, filed in 2021:
Average Adjusted Gross Income (AGI) in 2020: $64,372 (Individual Income Tax Returns)
Here:
$64,372
State:
$77,054
Salary/wage: $50,928 (reported on 84.3% of returns)
Here:
$50,928
State:
$62,766
(% of AGI for various income ranges: 1208.2% for AGIs below $25k, 3559.6% for AGIs $25k-50k, 6274.2% for AGIs $50k-75k, 9346.9% for AGIs $75k-100k, 16645.7% for AGIs $100k-200k, 51898.2% for AGIs over 200k)
Taxable interest for individuals: $1,544 (reported on 22.3% of returns)
This zip code:
$1,544
Texas:
$2,665
(% of AGI for various income ranges: 9.1% for AGIs below $25k, 9.6% for AGIs $25k-50k, 18.5% for AGIs $50k-75k, 44.3% for AGIs $75k-100k, 67.8% for AGIs $100k-200k, 2078.2% for AGIs over 200k)
Ordinary dividends: $6,082 (reported on 9.3% of returns)
Here:
$6,082
State:
$10,044
(% of AGI for various income ranges: 8.3% for AGIs below $25k, 10.2% for AGIs $25k-50k, 38.8% for AGIs $50k-75k, 47.3% for AGIs $75k-100k, 133.5% for AGIs $100k-200k, 3592.7% for AGIs over 200k)
Net capital gain/loss in AGI: +$18,460 (reported on 8.9% of returns)
Here:
+$18,460
State:
+$39,590
(% of AGI for various income ranges: 4.7% for AGIs below $25k, 14.4% for AGIs $25k-50k, 30.8% for AGIs $50k-75k, 45.6% for AGIs $75k-100k, 312.8% for AGIs $100k-200k, 13651.8% for AGIs over 200k)
Profit/loss from business: +$7,129 (reported on 12.7% of returns)
Here:
+$7,129
State:
+$10,888
(% of AGI for various income ranges: 55.2% for AGIs below $25k, 39.9% for AGIs $25k-50k, 64.9% for AGIs $50k-75k, 191.7% for AGIs $75k-100k, 237.9% for AGIs $100k-200k, 3035.5% for AGIs over 200k)
Taxable individual retirement arrangement distribution: $20,487 (reported on 5.1% of returns)
79720:
$20,487
Texas:
$24,740
(% of AGI for various income ranges: 22.1% for AGIs below $25k, 41.3% for AGIs $25k-50k, 121.1% for AGIs $50k-75k, 127.7% for AGIs $75k-100k, 475.9% for AGIs $100k-200k, 2900.9% for AGIs over 200k)
Total itemized deductions: $41,878 (reported on 3.5% of returns)
Here:
$41,878
State:
$40,428
(% of AGI for various income ranges: 51.1% for AGIs $25k-50k, 138.0% for AGIs $50k-75k, 182.2% for AGIs $75k-100k, 420.0% for AGIs $100k-200k, 7611.8% for AGIs over 200k)
Charity contributions: $23,716 (reported on 2.7% of returns)
Here:
$23,716
State:
$18,201
(% of AGI for various income ranges: 7.6% for AGIs $25k-50k, 22.7% for AGIs $50k-75k, 60.3% for AGIs $75k-100k, 191.8% for AGIs $100k-200k, 4296.4% for AGIs over 200k)
Taxes paid: $5,341 (reported on 3.3% of returns)
79720:
$5,341
State:
$7,821
(% of AGI for various income ranges: 7.4% for AGIs $25k-50k, 15.6% for AGIs $50k-75k, 30.6% for AGIs $75k-100k, 63.9% for AGIs $100k-200k, 735.5% for AGIs over 200k)
Earned income credit: $2,516 (reported on 21.7% of returns)
Here:
$2,516
State:
$2,584
(% of AGI for various income ranges: 136.7% for AGIs below $25k, 90.2% for AGIs $25k-50k, 1.7% for AGIs $50k-75k)
Percentage of individuals using paid preparers for their 2020 taxes: 92.5%
Here:
92%
State:
92%
(% for various income ranges: 88.1% for AGIs below $25k, 94.4% for AGIs $25k-50k, 95.1% for AGIs $50k-75k, 94.2% for AGIs $75k-100k, 95.3% for AGIs $100k-200k, 95.3% for AGIs over 200k)
Averages for the 2012 tax year for zip code 79720, filed in 2013:
Average Adjusted Gross Income (AGI) in 2012: $55,612 (Individual Income Tax Returns)
Here:
$55,612
State:
$65,384
Salary/wage: $42,493 (reported on 87.3% of returns)
Here:
$42,493
State:
$52,524
(% of AGI for various income ranges: 80.5% for AGIs below $25k, 85.5% for AGIs $25k-50k, 85.3% for AGIs $50k-75k, 81.9% for AGIs $75k-100k, 71.8% for AGIs $100k-200k, 22.8% for AGIs over 200k)
Taxable interest for individuals: $1,302 (reported on 22.3% of returns)
This zip code:
$1,302
Texas:
$2,372
(% of AGI for various income ranges: 0.5% for AGIs below $25k, 0.3% for AGIs $25k-50k, 0.2% for AGIs $50k-75k, 0.3% for AGIs $75k-100k, 0.5% for AGIs $100k-200k, 1.0% for AGIs over 200k)
Ordinary dividends: $4,422 (reported on 9.7% of returns)
Here:
$4,422
State:
$9,721
(% of AGI for various income ranges: 0.8% for AGIs below $25k, 0.4% for AGIs $25k-50k, 0.3% for AGIs $50k-75k, 0.3% for AGIs $75k-100k, 0.8% for AGIs $100k-200k, 1.6% for AGIs over 200k)
Net capital gain/loss in AGI: +$18,276 (reported on 7.7% of returns)
Here:
+$18,276
State:
+$35,319
(% of AGI for various income ranges: 0.2% for AGIs $25k-50k, 0.2% for AGIs $50k-75k, 0.3% for AGIs $75k-100k, 1.3% for AGIs $100k-200k, 9.0% for AGIs over 200k)
Profit/loss from business: +$12,983 (reported on 12.1% of returns)
Here:
+$12,983
State:
+$13,732
(% of AGI for various income ranges: 4.8% for AGIs below $25k, 1.5% for AGIs $25k-50k, 1.0% for AGIs $50k-75k, 2.3% for AGIs $75k-100k, 3.3% for AGIs $100k-200k, 4.1% for AGIs over 200k)
Taxable individual retirement arrangement distribution: $12,495 (reported on 6.4% of returns)
79720:
$12,495
Texas:
$19,511
(% of AGI for various income ranges: 1.2% for AGIs below $25k, 1.3% for AGIs $25k-50k, 1.4% for AGIs $50k-75k, 1.7% for AGIs $75k-100k, 2.4% for AGIs $100k-200k, 0.7% for AGIs over 200k)
Self-employment retirement plans: $21,967 (reported on 0.3% of returns)
79720:
$21,967
Texas:
$23,938
Total itemized deductions: $25,565 (16% of AGI, reported on 11.3% of returns)
Here:
$25,565
State:
$24,724
Here:
15.7% of AGI
State:
15.9% of AGI
(% of AGI for various income ranges: 2.7% for AGIs below $25k, 2.9% for AGIs $25k-50k, 4.3% for AGIs $50k-75k, 4.7% for AGIs $75k-100k, 6.0% for AGIs $100k-200k, 8.0% for AGIs over 200k)
Charity contributions: $9,246 (reported on 8.2% of returns)
Here:
$9,246
State:
$6,808
(% of AGI for various income ranges: 0.3% for AGIs below $25k, 0.5% for AGIs $25k-50k, 0.8% for AGIs $50k-75k, 1.1% for AGIs $75k-100k, 1.9% for AGIs $100k-200k, 2.4% for AGIs over 200k)
Taxes paid: $4,163 (reported on 10.7% of returns)
79720:
$4,163
State:
$6,921
(% of AGI for various income ranges: 0.3% for AGIs below $25k, 0.4% for AGIs $25k-50k, 0.7% for AGIs $50k-75k, 0.8% for AGIs $75k-100k, 1.3% for AGIs $100k-200k, 0.9% for AGIs over 200k)
Earned income credit: $2,377 (reported on 23.9% of returns)
Here:
$2,377
State:
$2,570
(% of AGI for various income ranges: 8.6% for AGIs below $25k, 1.5% for AGIs $25k-50k)
Percentage of individuals using paid preparers for their 2012 taxes: 55.7%
Here:
56%
State:
51%
(% for various income ranges: 52.2% for AGIs below $25k, 54.2% for AGIs $25k-50k, 55.6% for AGIs $50k-75k, 56.0% for AGIs $75k-100k, 67.0% for AGIs $100k-200k, 86.7% for AGIs over 200k)
Averages for the 2004 tax year for zip code 79720, filed in 2005:
Average Adjusted Gross Income (AGI) in 2004: $34,348 (Individual Income Tax Returns)
Here:
$34,348
State:
$47,881
Salary/wage: $30,687 (reported on 84.7% of returns)
Here:
$30,687
State:
$41,947
(% of AGI for various income ranges: 101.2% for AGIs below $10k, 79.0% for AGIs $10k-25k, 81.1% for AGIs $25k-50k, 79.0% for AGIs $50k-75k, 78.5% for AGIs $75k-100k, 57.3% for AGIs over 100k)
Taxable interest for individuals: $1,820 (reported on 30.9% of returns)
This zip code:
$1,820
Texas:
$2,255
(% of AGI for various income ranges: 6.1% for AGIs below $10k, 1.6% for AGIs $10k-25k, 1.2% for AGIs $25k-50k, 1.1% for AGIs $50k-75k, 1.1% for AGIs $75k-100k, 2.5% for AGIs over 100k)
Taxable dividends: $2,175 (reported on 13.6% of returns)
Here:
$2,175
State:
$4,261
(% of AGI for various income ranges: 1.4% for AGIs below $10k, 0.7% for AGIs $10k-25k, 0.6% for AGIs $25k-50k, 0.5% for AGIs $50k-75k, 0.7% for AGIs $75k-100k, 1.8% for AGIs over 100k)
Net capital gain/loss: +$3,577 (reported on 11.2% of returns)
Here:
+$3,577
State:
+$16,110
(% of AGI for various income ranges: -1.0% for AGIs below $10k, 0.2% for AGIs $10k-25k, 0.5% for AGIs $25k-50k, 0.3% for AGIs $50k-75k, 0.8% for AGIs $75k-100k, 4.1% for AGIs over 100k)
Profit/loss from business: +$8,763 (reported on 12.6% of returns)
Here:
+$8,763
State:
+$11,013
(% of AGI for various income ranges: 0.7% for AGIs below $10k, 2.9% for AGIs $10k-25k, 2.1% for AGIs $25k-50k, 1.7% for AGIs $50k-75k, 2.1% for AGIs $75k-100k, 7.7% for AGIs over 100k)
IRA payment deduction: $2,775 (reported on 1.7% of returns)
79720:
$2,775
Texas:
$3,120
(% of AGI for various income ranges: 0.1% for AGIs $10k-25k, 0.2% for AGIs $25k-50k, 0.2% for AGIs $50k-75k, 0.2% for AGIs $75k-100k, 0.1% for AGIs over 100k)
Self-employed pension: $20,200 (reported on 0.3% of returns)
Here:
$20,200
Texas:
$16,401
Total itemized deductions: $16,760 (21% of AGI, reported on 10.2% of returns)
Here:
$16,760
State:
$19,631
Here:
21.2% of AGI
State:
18.9% of AGI
(% of AGI for various income ranges: 3.9% for AGIs below $10k, 2.9% for AGIs $10k-25k, 3.4% for AGIs $25k-50k, 5.0% for AGIs $50k-75k, 6.7% for AGIs $75k-100k, 7.4% for AGIs over 100k)
Charity contributions deductions: $5,673 (7% of AGI, reported on 8.4% of returns)
Here:
$5,673
State:
$4,753
Here:
6.7% of AGI
State:
4.2% of AGI
(% of AGI for various income ranges: 0.3% for AGIs below $10k, 0.5% for AGIs $10k-25k, 0.7% for AGIs $25k-50k, 1.1% for AGIs $50k-75k, 2.0% for AGIs $75k-100k, 2.9% for AGIs over 100k)
Total tax: $5,105 (reported on 65.1% of returns)
79720:
$5,105
State:
$9,058
(% of AGI for various income ranges: 2.2% for AGIs below $10k, 3.1% for AGIs $10k-25k, 6.2% for AGIs $25k-50k, 9.0% for AGIs $50k-75k, 11.4% for AGIs $75k-100k, 19.3% for AGIs over 100k)
Earned income credit: $1,970 (reported on 28.0% of returns)
Here:
$1,970
State:
$2,024
Percentage of individuals using paid preparers for their 2004 taxes: 62.6%
Here:
63%
State:
57%
(% for various income ranges: 58.5% for AGIs below $10k, 65.0% for AGIs $10k-25k, 62.8% for AGIs $25k-50k, 61.8% for AGIs $50k-75k, 59.9% for AGIs $75k-100k, 71.7% for AGIs over 100k)
Household received Food Stamps/SNAP in the past 12 months: 1,311 Household did not receive Food Stamps/SNAP in the past 12 months: 10,877
Women who had a birth in the past 12 months: 656 (329 now married, 319 unmarried) Women who did not have a birth in the past 12 months: 6,253 (2,939 now married, 3,307 unmarried)
Housing units in zip code 79720 with a mortgage: 3,636 (21 second mortgage, 12 both second mortgage and home equity loan) Houses without a mortgage: 39
Median monthly owner costs for units with a mortgage: $1,363 Median monthly owner costs for units without a mortgage: $467
Residents with income below the poverty level in 2022:
This zip code:
14.5%
Whole state:
14.0%
Residents with income below 50% of the poverty level in 2022:
This zip code:
7.6%
Whole state:
7.4%
Median number of rooms in houses and condos:
Here:
5.9
State:
6.3
Median number of rooms in apartments:
Here:
4.2
State:
4.0
Notable locations in this zip code not listed on our city pages
Notable locations in zip code 79720: Garden City Pumping Station (A), Morgan Creek Pumping Station (B), Brushy Windmill (C), Foster Ranch (D), Hall Ranch (E), Hilltop Ranch (F), Lucian Wells Ranch (G), McDowell Ranch (H), North Cauble Windmill (I), North Windmill (J), Panther Windmill (K), Polecat Windmill (L), Sand Windmill (M), School Bus Windmill (N), Shafer Ranch (O), Shell Windmill (P), South Windmill (Q), West Field Windmill (R), Windmill Number One (S), Windmill Number Two (T). Display/hide their locations on the map
Churches in zip code 79720 include: Prairie View Church (A), Saint Paul Church (B), Salem Church (C), Trinity Baptist Church (D), Primitive Baptist Church (E), Northside Baptist Church (F), New Mount Zion Baptist Church (G), Iglesia Bautista Central Church (H), Hillcrest Baptist Church (I). Display/hide their locations on the map
Lakes and reservoirs: Natural Dam Lake (A), Roberts Lake (B), Onemile Lake (C), Salt Lake (D), Fourmile Lake (E), Threemile Lake (F), Salt Lake (G), Wolf Tank (H). Display/hide their locations on the map
Creeks: Rattlesnake Creek (A), Powell Creek (B), Polecat Creek (C), Panther Creek (D), Moss Creek (E), Wolf Creek (F), Glen Creek (G), Devils Creek (H), Chimney Creek (I). Display/hide their locations on the map
Parks in zip code 79720 include: Roy Andrews Park (1), Comanche Trail City Park (2), ABC Park (3), Big Spring State Park (4), Birdwell Park (5). Display/hide their locations on the map
3,915 married couples with children.
2,326 single-parent households (767 men, 1,559 women).
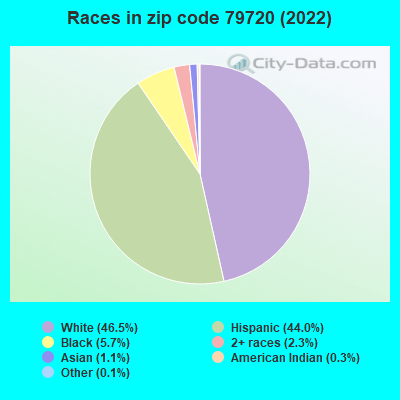
72.9% of residents of 79720 zip code speak English at home.
25.5% of residents speak Spanish at home (68% very well, 13% well, 12% not well, 7% not at all).
0.9% of residents speak other Indo-European language at home (66% very well, 9% well, 25% not well).
0.5% of residents speak Asian or Pacific Island language at home (98% very well, 2% well).
0.3% of residents speak other language at home (79% very well, 9% well, 12% not well).
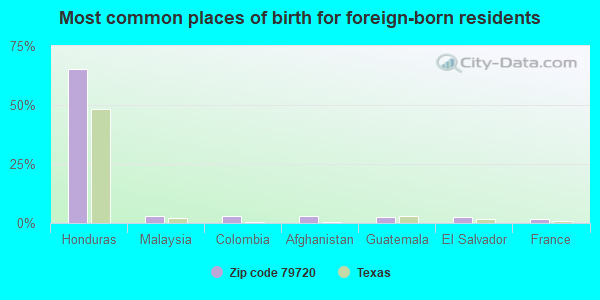
Foreign born population: 2,924 (8.8%) (25.8% of them are naturalized citizens)
This zip code:
8.8%
Whole state:
17.2%
65%Honduras
3%Malaysia
3%Colombia
3%Afghanistan
3%Guatemala
2%El Salvador
2%France
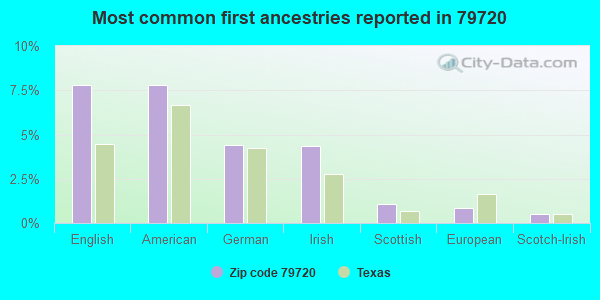
8%English
8%American
4%German
4%Irish
1%Scottish
1%European
1%Scotch-Irish
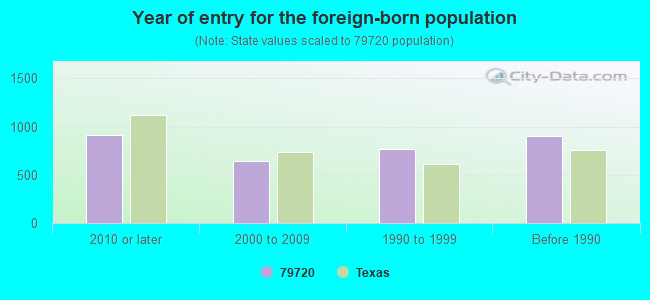
Year of entry for the foreign-born population
9112010 or later
6432000 to 2009
7731990 to 1999
905Before 1990
Facilities with environmental interests located in this zip code:
ANDERSON KIND CTR (708 E 11TH PL in BIG SPRING, TX)
(National Center for Education Statistics) - STATE ID-114901101 Organizations: BIG SPRING ISD (SCHOOL DISTRICT)
ANADARKO PTETROLEUM CORP - SUSIE B. SNYDER WELL (IN HOWARD COUNTY in BIG SPRING, TX)
(Integrated Compliance Information System) - ICIS-06-2000-1171, FORMAL ENFORCEMENT ACTION Business SIC classification: CRUDE PETROLEUM AND NATURAL GAS
APACHE CORPORATION, PL FULLER LEASE (13 MILES NORTH OF SNYDER in SCURRY COUNTY, TX)
A & A AIRCRAFT REFINISHERS (1700 W AIRPARK DR BLDG 1101 in BIG SPRING, TX)
(Resource Conservation and Recovery Act (tracking hazardous waste)) Business NAICS classification: AIRCRAFT MANUFACTURING.
AMERICAN TELEPHONE AND TELEGRAPH COMPANY (HWY 1205 2.5 MI W RR in VINCENT, TX)
(Resource Conservation and Recovery Act (tracking hazardous waste)) Alternative names: AMERICAN TEL & TEL CO LONG LINES
BANKS DRUM SITE (CHERRY & 8TH STREET in BIG SPRING, TX)
(Resource Conservation and Recovery Act (tracking hazardous waste)) Alternative names: HOSEA BANKS DRUM STORAGE SITE
Housing units lacking complete plumbing facilities: 4.3% Housing units lacking complete kitchen facilities: 5.7%
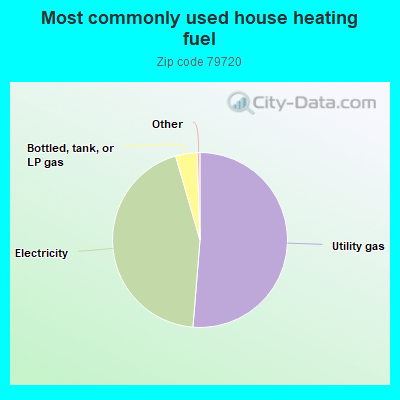
51.3%Utility gas
44.2%Electricity
4.0%Bottled, tank, or LP gas
Population in 1990: 29,733. Population change in the 1990s: +2,467 (+8.3%).
Place of birth for U.S.-born residents:
This state: 24,141
Northeast: 442
Midwest: 1,141
South: 1,579
West: 2,463
54% of the 79720 zip code residents lived in the same house 5 years ago. Out of people who lived in different houses, 43% lived in this county. Out of people who lived in different counties, 50% lived in Texas.
88% of the 79720 zip code residents lived in the same house 1 year ago. Out of people who lived in different houses, 28% moved from this county. Out of people who lived in different houses, 51% moved from different county within same state. Out of people who lived in different houses, 22% moved from different state. Out of people who lived in different houses, 2% moved from abroad.
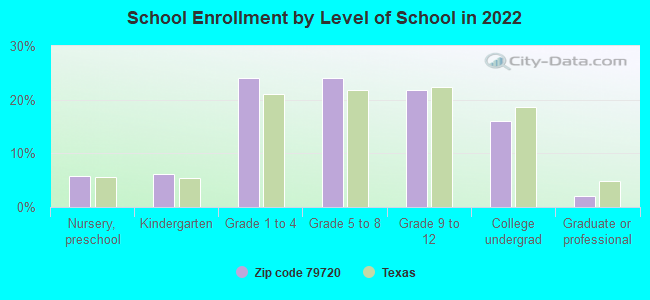
Private vs. public school enrollment:
Students in private schools in grades 1 to 8 (elementary and middle school): 476
Here:
14.0%
Texas:
8.8%
Students in private schools in grades 9 to 12 (high school): 302
Here:
19.5%
Texas:
8.0%
Students in private undergraduate colleges: 137
Here:
12.1%
Texas:
16.2%
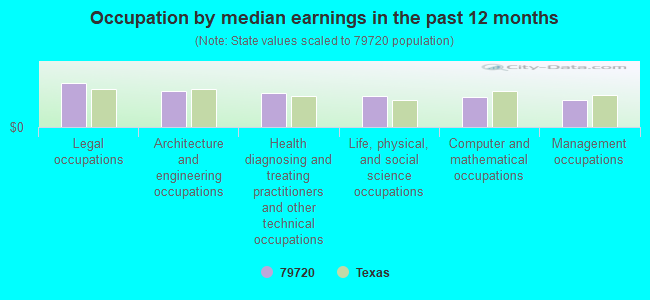
Occupation by median earnings in the past 12 months ($)
124,728Legal occupations
100,711Architecture and engineering occupations
95,272Health diagnosing and treating practitioners and other technical occupations
88,192Life, physical, and social science occupations
84,309Computer and mathematical occupations
75,861Management occupations
Companies with federal contracts located in this zip code:
ARFF PROFESSIONALS INC (2907 STONEHAVEN DR in BIG SPRING, TX; small business)
$66,567 with Air Force for Maintenance, Repair and Rebuilding of Equipment -- Vehicular Equipment Components. Taking place in HI. Signed on 2005-05-03. Completion date: 2005-06-23.
TIM BLACKSHEAR CO INC (101 WOOTEN RD in BIG SPRING, TX; small business) 8 employees, $818464 revenue. : $11,000 in 3 contractsin 2001
$6,000 with Agricultural Research Service (disused code) for Maintenance, Repair or Alteration of Real Property -- Highways, Roads, Streets, Bridges, and Railways (includes resurfacing). Signed on 2001-03-15. Completion date: 2001-05-15.
$4,000, same as above.Signed on 2001-07-15. Completion date: 2001-08-15.
$1,000, same as above.Signed on 2001-09-15. Completion date: 2001-11-15.
crim & bradshaw engineering (805 E. 3rd. St. in Big Spring, TX; small business) : $1,575 in 2 contractsin 2005
$1,500 with Bureau of Prisoners/Federal Prison System for Land Surveys, Cadastral Services (non-construction). Signed on 2005-03-21. Completion date: 2005-03-31.
$75, same as above.Signed on 2005-01-31. Completion date: 2005-02-11.
Cathy construction (2727 E. 25th ST. in BIG SPRING, TX; small business)
$1,500 with Bureau of Prisoners/Federal Prison System for Equipment and Materials Testing -- Miscellaneous. Signed on 2005-05-20. Completion date: 2005-06-10.
marvin watson (306 HOLLEY ROAD in BIG SPRING, TX; small business)
$40 with Bureau of Prisoners/Federal Prison System for Insect and Rodent Control Services. Signed on 2005-03-30. Completion date: 2005-03-30.
BUREAU OF PRISONS (1900 SIMLER AVE in BIG SPRING, TX)
-$84,383 with Air Force for Miscellaneous Electric Power and Distribution Equipment. Signed on 2000-07-12. Completion date: 2000-07-14.
Top industries in this zip code by the number of employees in 2005:
Health Care and Social Assistance: Psychiatric and Substance Abuse Hospitals (500-999 employees: 1 establishment)
Health Care and Social Assistance: General Medical and Surgical Hospitals (250-499: 2)
Administrative and Support and Waste Management and Remediation Services: Facilities Support Services (100-249: 2, 50-99: 2)
Other Services (except Public Administration): Religious Organizations (20-49: 3, 10-19: 2, 5-9: 4, 1-4: 11)
People in group quarters in 2010:
2,940 people in federal detention centers
2,288 people in federal prisons
280 people in nursing facilities/skilled-nursing facilities
264 people in college/university student housing
192 people in mental (psychiatric) hospitals and psychiatric units in other hospitals
68 people in local jails and other municipal confinement facilities
19 people in group homes intended for adults
15 people in emergency and transitional shelters (with sleeping facilities) for people experiencing homelessness
14 people in other noninstitutional facilities
People in group quarters in 2000:
2,620 people in other types of correctional institutions
1,294 people in federal prisons and detention centers
244 people in college dormitories (includes college quarters off campus)
208 people in mental (psychiatric) hospitals or wards
147 people in nursing homes
136 people in other noninstitutional group quarters
78 people in wards in general hospitals for patients who have no usual home elsewhere
45 people in local jails and other confinement facilities (including police lockups)
13 people in homes for the mentally retarded
2 people in other nonhousehold living situations
Fatal accident statistics in 2014:
Fatal accident count: 5
Vehicles involved in fatal accidents: 7
Fatal accidents caused by drunken drivers: 1
Fatalities: 5
Persons involved in fatal accidents: 12
Pedestrians involved in fatal accidents: 0
Fatal accident statistics in 2013:
Fatal accident count: 9
Vehicles involved in fatal accidents: 15
Fatal accidents caused by drunken drivers: 2
Fatalities: 12
Persons involved in fatal accidents: 21
Pedestrians involved in fatal accidents: 1
2003 - 2018 National Fire Incident Reporting System (NFIRS) incidents
Based on the data from the years 2003 - 2018 the average number of fires per year is 117. The highest number of fire incidents - 178 took place in 2009, and the least - 0 in 2005. The data has a dropping trend.
When looking into fire subcategories, the most reports belonged to: Outside Fires (50.0%), and Structure Fires (25.7%).
Fire incident types reported to NFIRS in Zip Code 79720

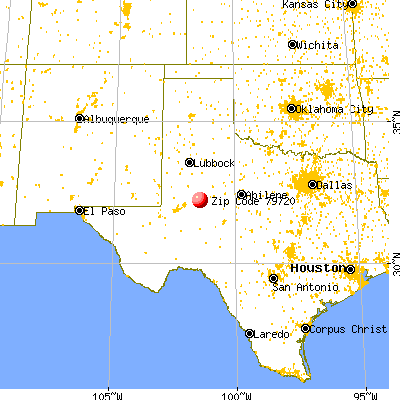


 Nearest zip codes: 79733, 79748, 79511, 79713, 79782, 79749.
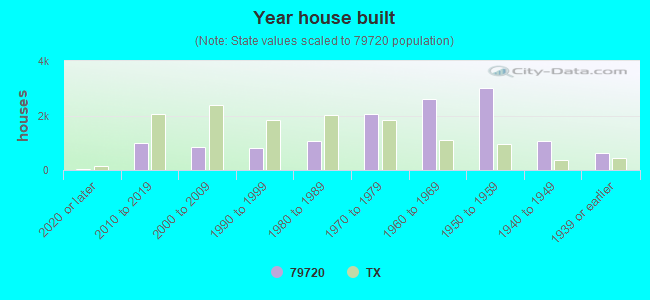


 Based on the data from the years 2003 - 2018 the average number of fires per year is 117. The highest number of fire incidents - 178 took place in 2009, and the least - 0 in 2005. The data has a dropping trend.
 When looking into fire subcategories, the most reports belonged to: Outside Fires (50.0%), and Structure Fires (25.7%).