Estimated zip code population in 2022: 25,201 Zip code population in 2010: 21,521 Zip code population in 2000: 20,372
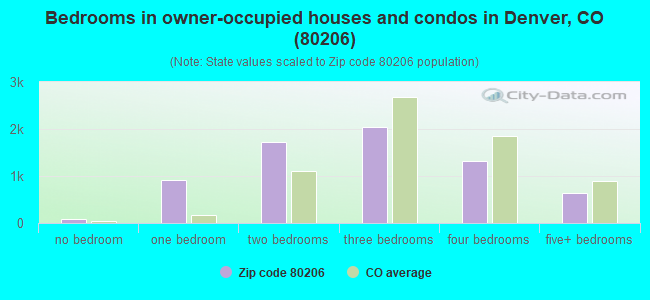
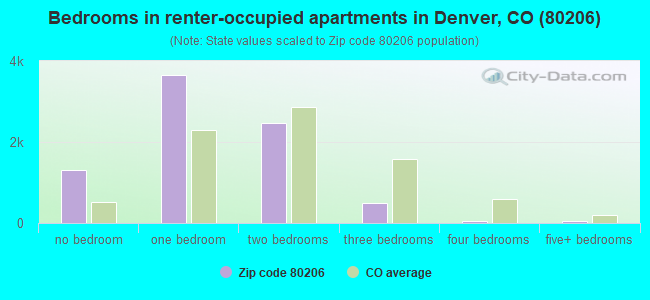
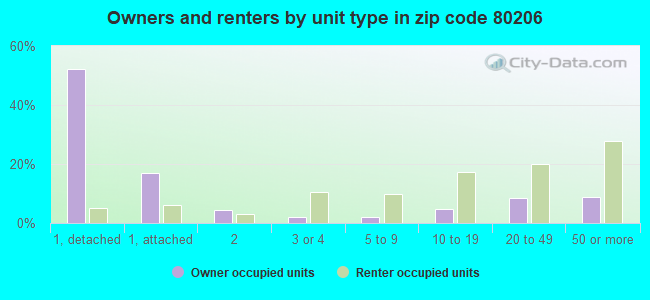
Houses and condos: 16,268 Renter-occupied apartments: 7,975
% of renters here:
54%
State:
34%
March 2022 cost of living index in zip code 80206: 112.8 (more than average, U.S. average is 100)
Land area: 2.5 sq. mi. Water area: 0.0 sq. mi.
Population density: 10,260 people per square mile
(high).
OSM Map
General Map
Google Map
MSN Map
OSM Map
General Map
Google Map
MSN Map
OSM Map
General Map
Google Map
MSN Map
OSM Map
General Map
Google Map
MSN Map
Please wait while loading the map...
Real estate property taxes paid for housing units in 2022:
This zip code:
0.4% ($3,996)
Colorado:
0.5% ($2,422)
Median real estate property taxes paid for housing units with mortgages in 2022: $3,881 (0.4%) Median real estate property taxes paid for housing units with no mortgage in 2022: $4,305 (0.5%)
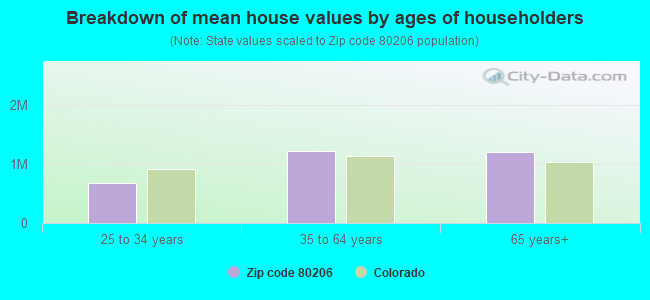
Estimated median house/condo value in 2022: $929,738
80206:
$929,738
Colorado:
$531,100
According to our research of Colorado and other state lists, there were 35 registered sex offenders living in 80206 zip code as of April 27, 2024. The ratio of all residents to sex offenders in zip code 80206 is 681 to 1. The ratio of registered sex offenders to all residents in this zip code is lower than the state average.
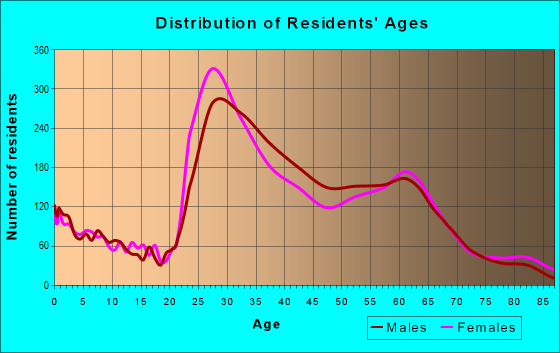
Median resident age:
This zip code:
37.8 years
Colorado median age:
37.7 years
Average household size:
This zip code:
1.7 people
Colorado:
2.4 people
Averages for the 2020 tax year for zip code 80206, filed in 2021:
Average Adjusted Gross Income (AGI) in 2020: $198,508 (Individual Income Tax Returns)
Here:
$198,508
State:
$89,260
Salary/wage: $137,822 (reported on 82.0% of returns)
Here:
$137,822
State:
$70,330
(% of AGI for various income ranges: 1217.0% for AGIs below $25k, 3835.7% for AGIs $25k-50k, 7038.9% for AGIs $50k-75k, 10706.9% for AGIs $75k-100k, 19038.4% for AGIs $100k-200k, 183738.7% for AGIs over 200k)
Taxable interest for individuals: $6,972 (reported on 42.0% of returns)
This zip code:
$6,972
Colorado:
$2,176
(% of AGI for various income ranges: 32.0% for AGIs below $25k, 27.2% for AGIs $25k-50k, 36.6% for AGIs $50k-75k, 161.5% for AGIs $75k-100k, 361.8% for AGIs $100k-200k, 5877.0% for AGIs over 200k)
Ordinary dividends: $25,560 (reported on 39.2% of returns)
Here:
$25,560
State:
$8,820
(% of AGI for various income ranges: 73.3% for AGIs below $25k, 97.8% for AGIs $25k-50k, 138.6% for AGIs $50k-75k, 500.3% for AGIs $75k-100k, 1359.7% for AGIs $100k-200k, 20000.8% for AGIs over 200k)
Net capital gain/loss in AGI: +$87,435 (reported on 37.3% of returns)
Here:
+$87,435
State:
+$37,276
(% of AGI for various income ranges: 68.8% for AGIs below $25k, 107.2% for AGIs $25k-50k, 125.8% for AGIs $50k-75k, 430.1% for AGIs $75k-100k, 1791.4% for AGIs $100k-200k, 74010.3% for AGIs over 200k)
Profit/loss from business: +$30,948 (reported on 20.1% of returns)
Here:
+$30,948
State:
+$15,295
(% of AGI for various income ranges: 168.1% for AGIs below $25k, 269.5% for AGIs $25k-50k, 311.7% for AGIs $50k-75k, 587.6% for AGIs $75k-100k, 1239.6% for AGIs $100k-200k, 9447.0% for AGIs over 200k)
Taxable individual retirement arrangement distribution: $40,306 (reported on 9.0% of returns)
80206:
$40,306
Colorado:
$23,785
(% of AGI for various income ranges: 46.3% for AGIs below $25k, 81.3% for AGIs $25k-50k, 146.2% for AGIs $50k-75k, 447.8% for AGIs $75k-100k, 1192.7% for AGIs $100k-200k, 5019.8% for AGIs over 200k)
Self-employed (Keogh) retirement plans: $30,497 (reported on 2.3% of returns)
80206:
$30,497
Colorado:
$23,633
(% of AGI for various income ranges: 12.8% for AGIs $25k-50k, 30.3% for AGIs $75k-100k, 106.9% for AGIs $100k-200k, 1400.8% for AGIs over 200k)
Total itemized deductions: $54,734 (reported on 19.9% of returns)
Here:
$54,734
State:
$35,141
(% of AGI for various income ranges: 105.8% for AGIs below $25k, 135.6% for AGIs $25k-50k, 260.3% for AGIs $50k-75k, 773.8% for AGIs $75k-100k, 2095.9% for AGIs $100k-200k, 19789.5% for AGIs over 200k)
Charity contributions: $29,670 (reported on 16.8% of returns)
Here:
$29,670
State:
$12,103
(% of AGI for various income ranges: 8.2% for AGIs below $25k, 19.4% for AGIs $25k-50k, 21.1% for AGIs $50k-75k, 103.6% for AGIs $75k-100k, 361.2% for AGIs $100k-200k, 11072.1% for AGIs over 200k)
Taxes paid: $8,587 (reported on 19.9% of returns)
80206:
$8,587
State:
$7,710
(% of AGI for various income ranges: 18.8% for AGIs below $25k, 27.0% for AGIs $25k-50k, 61.3% for AGIs $50k-75k, 199.0% for AGIs $75k-100k, 580.3% for AGIs $100k-200k, 2424.1% for AGIs over 200k)
Earned income credit: $833 (reported on 5.2% of returns)
Here:
$833
State:
$2,053
(% of AGI for various income ranges: 23.8% for AGIs below $25k, 7.2% for AGIs $25k-50k)
Percentage of individuals using paid preparers for their 2020 taxes: 94.0%
Here:
94%
State:
93%
(% for various income ranges: 90.8% for AGIs below $25k, 94.9% for AGIs $25k-50k, 95.6% for AGIs $50k-75k, 93.8% for AGIs $75k-100k, 94.6% for AGIs $100k-200k, 94.7% for AGIs over 200k)
Averages for the 2012 tax year for zip code 80206, filed in 2013:
Average Adjusted Gross Income (AGI) in 2012: $139,081 (Individual Income Tax Returns)
Here:
$139,081
State:
$69,103
Salary/wage: $83,852 (reported on 83.9% of returns)
Here:
$83,852
State:
$54,794
(% of AGI for various income ranges: 78.1% for AGIs below $25k, 85.3% for AGIs $25k-50k, 80.4% for AGIs $50k-75k, 73.4% for AGIs $75k-100k, 70.8% for AGIs $100k-200k, 37.5% for AGIs over 200k)
Taxable interest for individuals: $6,216 (reported on 40.6% of returns)
This zip code:
$6,216
Colorado:
$1,971
(% of AGI for various income ranges: 1.1% for AGIs below $25k, 0.7% for AGIs $25k-50k, 0.7% for AGIs $50k-75k, 0.7% for AGIs $75k-100k, 1.0% for AGIs $100k-200k, 2.3% for AGIs over 200k)
Ordinary dividends: $26,246 (reported on 33.9% of returns)
Here:
$26,246
State:
$7,140
(% of AGI for various income ranges: 3.8% for AGIs below $25k, 1.8% for AGIs $25k-50k, 2.4% for AGIs $50k-75k, 3.3% for AGIs $75k-100k, 3.7% for AGIs $100k-200k, 8.1% for AGIs over 200k)
Net capital gain/loss in AGI: +$99,368 (reported on 30.8% of returns)
Here:
+$99,368
State:
+$23,009
(% of AGI for various income ranges: 0.7% for AGIs below $25k, 0.8% for AGIs $25k-50k, 1.1% for AGIs $50k-75k, 1.8% for AGIs $75k-100k, 3.2% for AGIs $100k-200k, 32.2% for AGIs over 200k)
Profit/loss from business: +$28,222 (reported on 19.7% of returns)
Here:
+$28,222
State:
+$13,514
(% of AGI for various income ranges: 9.1% for AGIs below $25k, 4.7% for AGIs $25k-50k, 4.3% for AGIs $50k-75k, 5.6% for AGIs $75k-100k, 6.5% for AGIs $100k-200k, 3.1% for AGIs over 200k)
Taxable individual retirement arrangement distribution: $38,886 (reported on 9.7% of returns)
80206:
$38,886
Colorado:
$17,927
(% of AGI for various income ranges: 3.1% for AGIs below $25k, 1.6% for AGIs $25k-50k, 2.2% for AGIs $50k-75k, 3.6% for AGIs $75k-100k, 3.7% for AGIs $100k-200k, 2.6% for AGIs over 200k)
Self-employment retirement plans: $24,503 (reported on 2.4% of returns)
80206:
$24,503
Colorado:
$19,483
(% of AGI for various income ranges: 0.3% for AGIs $25k-50k, 0.4% for AGIs $75k-100k, 0.7% for AGIs $100k-200k, 0.4% for AGIs over 200k)
Total itemized deductions: $46,135 (15% of AGI, reported on 38.8% of returns)
Here:
$46,135
State:
$24,621
Here:
15.3% of AGI
State:
18.5% of AGI
(% of AGI for various income ranges: 11.3% for AGIs below $25k, 7.3% for AGIs $25k-50k, 10.8% for AGIs $50k-75k, 15.1% for AGIs $75k-100k, 15.4% for AGIs $100k-200k, 13.0% for AGIs over 200k)
Charity contributions: $14,082 (reported on 33.0% of returns)
Here:
$14,082
State:
$4,449
(% of AGI for various income ranges: 0.7% for AGIs below $25k, 0.6% for AGIs $25k-50k, 1.0% for AGIs $50k-75k, 1.6% for AGIs $75k-100k, 1.8% for AGIs $100k-200k, 4.4% for AGIs over 200k)
Taxes paid: $16,553 (reported on 38.6% of returns)
80206:
$16,553
State:
$7,641
(% of AGI for various income ranges: 1.9% for AGIs below $25k, 1.4% for AGIs $25k-50k, 2.8% for AGIs $50k-75k, 4.1% for AGIs $75k-100k, 5.3% for AGIs $100k-200k, 5.1% for AGIs over 200k)
Earned income credit: $909 (reported on 7.8% of returns)
Here:
$909
State:
$2,095
(% of AGI for various income ranges: 1.5% for AGIs below $25k, 0.1% for AGIs $25k-50k)
Percentage of individuals using paid preparers for their 2012 taxes: 45.8%
Here:
46%
State:
49%
(% for various income ranges: 36.7% for AGIs below $25k, 34.5% for AGIs $25k-50k, 41.6% for AGIs $50k-75k, 50.9% for AGIs $75k-100k, 59.5% for AGIs $100k-200k, 80.1% for AGIs over 200k)
Averages for the 2004 tax year for zip code 80206, filed in 2005:
Average Adjusted Gross Income (AGI) in 2004: $98,090 (Individual Income Tax Returns)
Here:
$98,090
State:
$55,014
Salary/wage: $65,458 (reported on 82.3% of returns)
Here:
$65,458
State:
$46,010
(% of AGI for various income ranges: 12475.0% for AGIs below $10k, 81.2% for AGIs $10k-25k, 85.2% for AGIs $25k-50k, 77.6% for AGIs $50k-75k, 75.7% for AGIs $75k-100k, 44.9% for AGIs over 100k)
Taxable interest for individuals: $6,647 (reported on 48.9% of returns)
This zip code:
$6,647
Colorado:
$2,127
(% of AGI for various income ranges: 2118.8% for AGIs below $10k, 1.9% for AGIs $10k-25k, 1.5% for AGIs $25k-50k, 1.8% for AGIs $50k-75k, 2.0% for AGIs $75k-100k, 3.7% for AGIs over 100k)
Taxable dividends: $10,027 (reported on 36.9% of returns)
Here:
$10,027
State:
$3,782
(% of AGI for various income ranges: 1348.4% for AGIs below $10k, 2.4% for AGIs $10k-25k, 1.7% for AGIs $25k-50k, 3.0% for AGIs $50k-75k, 2.3% for AGIs $75k-100k, 4.2% for AGIs over 100k)
Net capital gain/loss: +$45,497 (reported on 33.7% of returns)
Here:
+$45,497
State:
+$17,882
(% of AGI for various income ranges: 1081.2% for AGIs below $10k, 0.5% for AGIs $10k-25k, 1.2% for AGIs $25k-50k, 2.3% for AGIs $50k-75k, 3.0% for AGIs $75k-100k, 20.5% for AGIs over 100k)
Profit/loss from business: +$19,005 (reported on 20.1% of returns)
Here:
+$19,005
State:
+$11,247
(% of AGI for various income ranges: 1057.8% for AGIs below $10k, 7.7% for AGIs $10k-25k, 4.7% for AGIs $25k-50k, 5.3% for AGIs $50k-75k, 6.3% for AGIs $75k-100k, 3.2% for AGIs over 100k)
IRA payment deduction: $3,041 (reported on 3.3% of returns)
80206:
$3,041
Colorado:
$2,947
(% of AGI for various income ranges: 0.4% for AGIs $10k-25k, 0.3% for AGIs $25k-50k, 0.2% for AGIs $50k-75k, 0.2% for AGIs $75k-100k, 0.0% for AGIs over 100k)
Self-employed pension: $19,158 (reported on 3.1% of returns)
Here:
$19,158
Colorado:
$13,653
(% of AGI for various income ranges: 0.2% for AGIs $10k-25k, 0.2% for AGIs $25k-50k, 0.3% for AGIs $50k-75k, 0.7% for AGIs $75k-100k, 0.7% for AGIs over 100k)
Total itemized deductions: $36,147 (18% of AGI, reported on 41.7% of returns)
Here:
$36,147
State:
$20,560
Here:
18.1% of AGI
State:
21.4% of AGI
(% of AGI for various income ranges: 2690.6% for AGIs below $10k, 10.3% for AGIs $10k-25k, 12.1% for AGIs $25k-50k, 17.4% for AGIs $50k-75k, 19.3% for AGIs $75k-100k, 15.3% for AGIs over 100k)
Charity contributions deductions: $9,968 (5% of AGI, reported on 37.2% of returns)
Here:
$9,968
State:
$3,518
Here:
4.7% of AGI
State:
3.4% of AGI
(% of AGI for various income ranges: 140.6% for AGIs below $10k, 1.0% for AGIs $10k-25k, 1.1% for AGIs $25k-50k, 1.8% for AGIs $50k-75k, 2.1% for AGIs $75k-100k, 4.6% for AGIs over 100k)
Total tax: $22,007 (reported on 84.6% of returns)
80206:
$22,007
State:
$9,173
(% of AGI for various income ranges: 571.9% for AGIs below $10k, 6.0% for AGIs $10k-25k, 9.8% for AGIs $25k-50k, 12.4% for AGIs $50k-75k, 13.2% for AGIs $75k-100k, 21.9% for AGIs over 100k)
Earned income credit: $820 (reported on 8.0% of returns)
Here:
$820
State:
$1,595
Percentage of individuals using paid preparers for their 2004 taxes: 52.3%
Here:
52%
State:
55%
(% for various income ranges: 48.0% for AGIs below $10k, 46.6% for AGIs $10k-25k, 42.0% for AGIs $25k-50k, 54.6% for AGIs $50k-75k, 59.5% for AGIs $75k-100k, 73.4% for AGIs over 100k)
Likely homosexual households (counted as self-reported same-sex unmarried-partner households)
Lesbian couples: 0.1% of all households
Gay men: 1.4% of all households
Household received Food Stamps/SNAP in the past 12 months: 811 Household did not receive Food Stamps/SNAP in the past 12 months: 13,835
Women who had a birth in the past 12 months: 241 (210 now married, 33 unmarried) Women who did not have a birth in the past 12 months: 7,240 (2,335 now married, 4,931 unmarried)
Housing units in zip code 80206 with a mortgage: 4,864 (460 second mortgage, 20 home equity loan, 438 both second mortgage and home equity loan) Houses without a mortgage: 29
Median monthly owner costs for units with a mortgage: $2,772 Median monthly owner costs for units without a mortgage: $838
Residents with income below the poverty level in 2022:
This zip code:
7.4%
Whole state:
9.4%
Residents with income below 50% of the poverty level in 2022:
This zip code:
3.3%
Whole state:
4.6%
Median number of rooms in houses and condos:
Here:
6.7
State:
6.8
Median number of rooms in apartments:
Here:
3.2
State:
4.0
Notable locations in this zip code not listed on our city pages
Notable locations in zip code 80206: East High School Football Stadium (A), Denver Public Library Ross - Cherry Creek Branch (B), The Bluebird Theater (C), Weicker Depository (D), Denver Museum of Miniatures, Dolls and Toys (E), Boettcher Conservatory (F), Boettcher Memorial Center (G), Tucker Medical Library (H), Helen Fowler Library (I), Denver Fire Department Station 15 (J). Display/hide their locations on the map
Churches in zip code 80206 include: Saint Barnabas Episcopal Church (A), Church of the Good Shepherd (B), Church in the City - Beth Abraham (C), Capitol Heights Presbyterian Church (D), Sixth Avenue United Church of Christ (E). Display/hide their locations on the map
Tourist attractions (not listed on the city page) : Gray Line Worldwide (1835 Gaylord Street), Changes in Latitude (1343 Vine Denver), Colorado Cinemas Cherry Creek 8 (Arcades & Amusements; 3000 East 1st Avenue), Altamira Tours (Tours & Charters; 860 Detroit Street), Chateaux Bike Tour (Tours & Charters; 335 Steele Street), A Private Guide (Tours & Charters; 2940 East Colfax Avenue), Cherry Creek North Business District (Tours & Charters; 3003 E 3rd Ave).
2,068 married couples with children.
544 single-parent households (90 men, 454 women).
91.7% of residents of 80206 zip code speak English at home.
4.6% of residents speak Spanish at home (82% very well, 12% well, 5% not well).
2.2% of residents speak other Indo-European language at home (100% very well).
1.2% of residents speak Asian or Pacific Island language at home (70% very well, 22% well, 7% not well, 2% not at all).
0.5% of residents speak other language at home (100% very well).
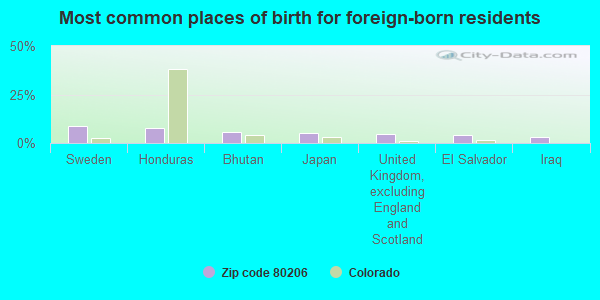
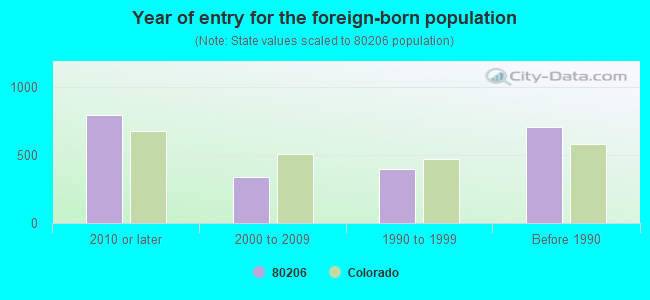
Foreign born population: 1,671 (6.6%) (59.0% of them are naturalized citizens)
Major facilities with environmental interests located in this zip code:
GALAXIE AUTO BODY (3520 E COLFAX AVE in DENVER, CO)
AIR MINOR (AIRS/AFS) STATE MASTER (Colorado database) - RCRAINFO-COD114051758, SQG CRITERIA AND HAZARDOUS AIR POLLUTANT INVENTORY (Inventory of air pollution sources) Conditionally Exempt Small Quantity Generators, less than 100 kg/month of hazardous waste (Resource Conservation and Recovery Act (tracking hazardous waste)) - notification Business SIC classification: TOP, BODY, AND UPHOLSTERY REPAIR SHOPS AND PAINT SHOPS Business NAICS classification: AUTOMOTIVE BODY, PAINT, AND INTERIOR REPAIR AND MAINTENANCE. Organizations: ROBERT G. DAY (CONTACT/OWNER)
BROMWELL ELEMENTARY SCHOOL (2500 EAST FOURTH AVENUE in DENVER, CO)
AIR MINOR (AIRS/AFS) (Geographic Names Information System) (National Center for Education Statistics) - STATE ID-1056 Conditionally Exempt Small Quantity Generators, less than 100 kg/month of hazardous waste (Resource Conservation and Recovery Act (tracking hazardous waste)) - notification Business SIC classification: ELEMENTARY AND SECONDARY SCHOOLS Organizations: DENVER PUBLIC SCHOOLS (CONTACT/OWNER)
, DENVER COUNTY 1 (SCHOOL DISTRICT)
Alternative names: DENVER PUBLIC SCHOOLS, DPS BROMWELL
CHERRY CREEK AUTO (1701 YORK STREET in DENVER, CO)
AIR MINOR (AIRS/AFS) STATE MASTER (Colorado database) - RCRAINFO-CO0000971242, SQG CRITERIA AND HAZARDOUS AIR POLLUTANT INVENTORY (Inventory of air pollution sources) Small Quantity Generators, between 100 kg and 1000 kg of hazardous waste/month (Resource Conservation and Recovery Act (tracking hazardous waste)) - notification Business SIC classification: SANITARY SERVICES; GENERAL AUTOMOTIVE REPAIR SHOPS Organizations: CHERRY CREEK AUTO SERVICE (CONTACT/OPERATOR)
, GLADE B HILL (CONTACT/OWNER)
Alternative names: CHERRY CREEK AUTO SERVICE
ALPHA PHOTO LAB (201 UNIVERSITY STE 103 in DENVER, CO)
STATE MASTER (Colorado database) - RCRAINFO-COD980960736, SQG (Resource Conservation and Recovery Act (tracking hazardous waste))
BEST WAY PRINTING (220 CLAYTON ST in DENVER, CO)
AIR MINOR (AIRS/AFS) CRITERIA AND HAZARDOUS AIR POLLUTANT INVENTORY (Inventory of air pollution sources) Business SIC classification: COMMERCIAL PRINTING, LITHOGRAPHIC Alternative names: BEST WAY INSTANT PRINTING (SEE 0311261)
GIGANTIC CLNRS NO 2 (3405 EAST 1ST AVENUE in DENVER, CO)
AIR MINOR (AIRS/AFS) CRITERIA AND HAZARDOUS AIR POLLUTANT INVENTORY (Inventory of air pollution sources) Conditionally Exempt Small Quantity Generators, less than 100 kg/month of hazardous waste (Resource Conservation and Recovery Act (tracking hazardous waste)) - notification Business SIC classification: DRYCLEANING PLANTS, EXCEPT RUG CLEANING Business NAICS classification: DRYCLEANING AND LAUNDRY SERVICES (EXCEPT COIN-OPERATED). Organizations: RON TRIMAN (CONTACT/OWNER)
, ZELCO INC (CONTACT/OWNER)
Alternative names: GIGANTIC CLEANERS #2
ALIYA LLC (2604 EAST 12TH AVENUE in DENVER, CO)
AIR MINOR (AIRS/AFS) CRITERIA AND HAZARDOUS AIR POLLUTANT INVENTORY (Inventory of air pollution sources) Conditionally Exempt Small Quantity Generators, less than 100 kg/month of hazardous waste (Resource Conservation and Recovery Act (tracking hazardous waste)) - notification Business SIC classification: DRYCLEANING PLANTS, EXCEPT RUG CLEANING Business NAICS classification: DRYCLEANING AND LAUNDRY SERVICES (EXCEPT COIN-OPERATED). Alternative names: KLEAN RITE CLEANERS #1, KLEAN RITE CLNRS
CHERRY CREEK CLEANERS (75 ADAMS in DENVER, CO)
AIR MINOR (AIRS/AFS) CRITERIA AND HAZARDOUS AIR POLLUTANT INVENTORY (Inventory of air pollution sources) Conditionally Exempt Small Quantity Generators, less than 100 kg/month of hazardous waste (Resource Conservation and Recovery Act (tracking hazardous waste)) - notification Business SIC classification: DRYCLEANING PLANTS, EXCEPT RUG CLEANING Organizations: RAY ALIZADEH (CONTACT/OWNER)
BRINKER INTERNATIONAL MACARONI GRILL (2500 E 1ST AVE B101 in DENVER, CO)
AIR MINOR (AIRS/AFS) AIR SYNTHETIC MINOR (AIRS/AFS) CRITERIA AND HAZARDOUS AIR POLLUTANT INVENTORY (Inventory of air pollution sources) Business SIC classification: EATING PLACES
(Resource Conservation and Recovery Act (tracking hazardous waste)) Organizations: 7TH AND COLO CONOCO INC (CONTACT/OWNER)
AMOCO CAR WASH (100 STEELE ST in DENVER, CO)
(Resource Conservation and Recovery Act (tracking hazardous waste)) Organizations: CUSTER LEONARD G. (CONTACT/OWNER)
ARCHDIOCESE OF DENVER (SAINT LOUIS SCHOOL) (200 JOSEPHINE STREET in DENVER, CO)
COMPLIANCE ACTIVITY (Tracking inspections of insecticide, fungicide, and rodenticide, and toxic substances) Alternative names: ARCHDIOCESE OF DENVER (ST LOUIS SCHOOL), ARCHDIOCESE OF DENVER(ST MARY'S SCHOOL), ARCHDIOCESE OF DENVER(ST PETER AND PAUL), ARCHDIOCESE OF DENVER (ST. STEPHEN ELEM)
Housing units lacking complete plumbing facilities: 0.3% Housing units lacking complete kitchen facilities: 0.4%
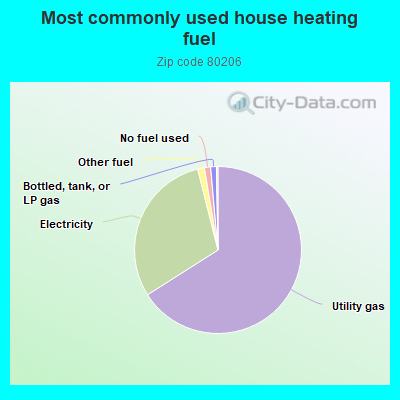
66.0%Utility gas
30.1%Electricity
1.3%Other fuel
1.2%No fuel used
1.1%Bottled, tank, or LP gas
Population in 1990: 19,145. Population change in the 1990s: +1,227 (+6.4%).
Place of birth for U.S.-born residents:
This state: 6,307
Northeast: 3,623
Midwest: 5,734
South: 3,835
West: 3,544
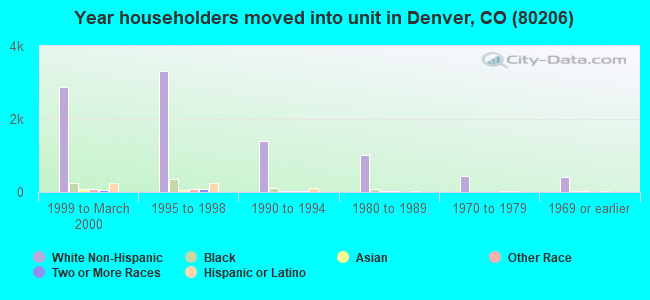
38% of the 80206 zip code residents lived in the same house 5 years ago. Out of people who lived in different houses, 43% lived in this county. Out of people who lived in different counties, 50% lived in Colorado.
78% of the 80206 zip code residents lived in the same house 1 year ago. Out of people who lived in different houses, 39% moved from this county. Out of people who lived in different houses, 18% moved from different county within same state. Out of people who lived in different houses, 34% moved from different state. Out of people who lived in different houses, 5% moved from abroad.
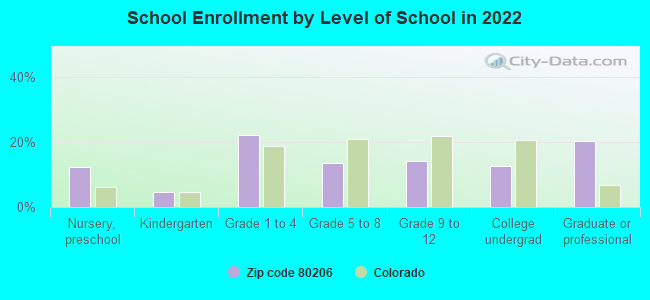
Private vs. public school enrollment:
Students in private schools in grades 1 to 8 (elementary and middle school): 259
Here:
21.7%
Colorado:
11.4%
Students in private schools in grades 9 to 12 (high school): 116
Here:
24.7%
Colorado:
8.5%
Students in private undergraduate colleges: 87
Here:
20.9%
Colorado:
14.0%
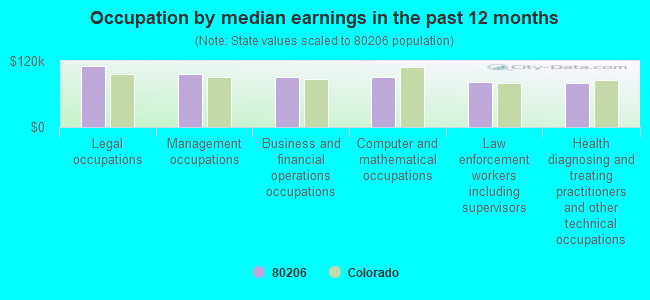
Occupation by median earnings in the past 12 months ($)
110,134Legal occupations
95,705Management occupations
90,219Business and financial operations occupations
90,204Computer and mathematical occupations
82,716Law enforcement workers including supervisors
79,499Health diagnosing and treating practitioners and other technical occupations
Companies with federal contracts located in this zip code (DENVER, CO):
BRAD ADAMS WALKER ARCHITECTURE (201 FILLMORE ST , SUITE 20) : $5,518,112 in 64 contractsfrom 1999 to 2006
Contracts for Architect - Engineer Services (including landscaping, interior layout, and designing) by Army, Air Force, U.S. Army Corps of Engineers - civil program financing only Signed by year:2000: $188,162; 2001: $262,194; 2002: $1,805,242; 2003: $462,125; 2004: $1,049,961; 2005: $594,207; 2006: $60,421.
Biggest contracts:
$1,683,563 with Army for Architect - Engineer Services (including landscaping, interior layout, and designing). Signed on 2002-01-25. Completion date: 2002-11-29.
$996,274, same as above.Signed on 1999-11-08. Completion date: 2000-06-30.
$249,995 with Air Force for Architect - Engineer Services (including landscaping, interior layout, and designing). Signed on 2004-08-27. Completion date: 2005-02-21.
$173,216, same as above.Signed on 2001-03-23. Completion date: 2001-07-30.
ICON SOLUTIONS LLC (231 MILWAUKEE STREET; small business)
$329,980 with Air Force for Installation of Equipment -- Alarm, Signal, and Security Detection Systems. Signed on 2005-09-23. Completion date: 2006-01-06.
THE COLORADO EXPRESS (1055 FILLMORE STREET; small business) : $96,393 in 6 contractsfrom 2004 to 2006
Contracts for Clothing, Special Purpose, Safety and Rescue Equipment, Medical and Surgical Instruments, Equipment, and Supplies by Air Force, Army Signed by year:2000: $0; 2001: $0; 2002: $0; 2003: $0; 2004: $45,728; 2005: $45,085; 2006: $5,580.
Biggest contracts:
$41,208 with Air Force for Clothing, Special Purpose. Signed on 2004-03-08. Completion date: 2004-04-30.
$30,500 with Army for Safety and Rescue Equipment. Signed on 2005-09-27. Completion date: 2005-11-11.
$11,300, same as above.Signed on 2005-02-03. Completion date: 2005-02-10.
$5,580 with Army for Medical and Surgical Instruments, Equipment, and Supplies. Signed on 2006-05-23. Completion date: 2006-05-31.
OMNITRAX INC (252 N CLAYTON ST 4TH FL)
$9,600 with Army for Lease or Rental of Equipment -- Railway Equipment. Signed on 2003-01-23. Completion date: 2003-07-27.
TAM O'NEILL FINE ARTS (311 DETROIT STREET; small business)
$6,500 with Army for Collectors. and/or Historical Items. Signed on 2004-08-10. Completion date: 2004-09-30.
SPACELOGIC, INCORPORATED (780 COLORADO BLVD; small business) : $6,084 in 2 contractsin 2005
$5,706 with Navy for Maintenance, Repair and Rebuilding of Equipment -- Office Machines, Text Processing Systems and Visible Record Equipment. Signed on 2005-06-13. Completion date: 2005-08-05.
$378, same as above.Signed on 2005-08-30. Completion date: 2005-08-05.
Top industries in this zip code by the number of employees in 2005:
2002 - 2018 National Fire Incident Reporting System (NFIRS) incidents
Based on the data from the years 2002 - 2018 the average number of fire incidents per year is 66. The highest number of reported fire incidents - 106 took place in 2005, and the least - 16 in 2018. The data has a decreasing trend.
When looking into fire subcategories, the most reports belonged to: Outside Fires (43.2%), and Structure Fires (39.4%).
Fire incident types reported to NFIRS in Zip Code 80206
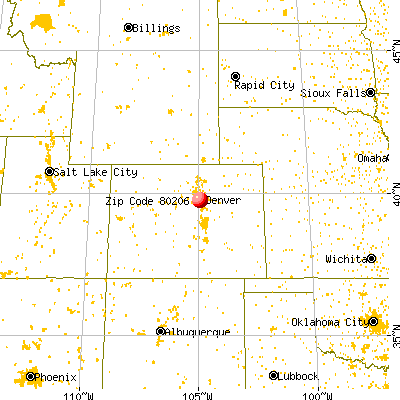


 Nearest zip codes: 80218, 80209, 80203, 80205, 80246, 80264.
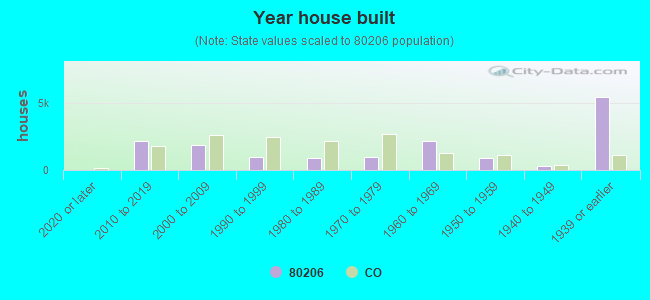


 Based on the data from the years 2002 - 2018 the average number of fire incidents per year is 66. The highest number of reported fire incidents - 106 took place in 2005, and the least - 16 in 2018. The data has a decreasing trend.
 When looking into fire subcategories, the most reports belonged to: Outside Fires (43.2%), and Structure Fires (39.4%).