Estimated zip code population in 2022: 2,190 Zip code population in 2010: 1,637 Zip code population in 2000: 2,132
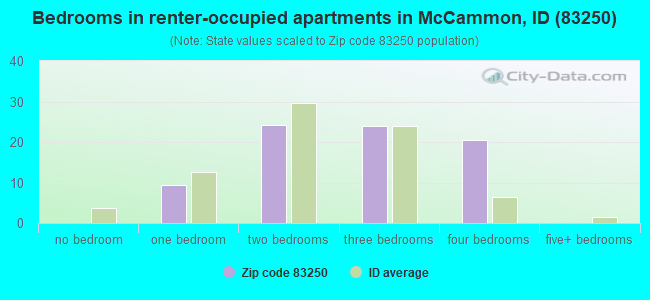
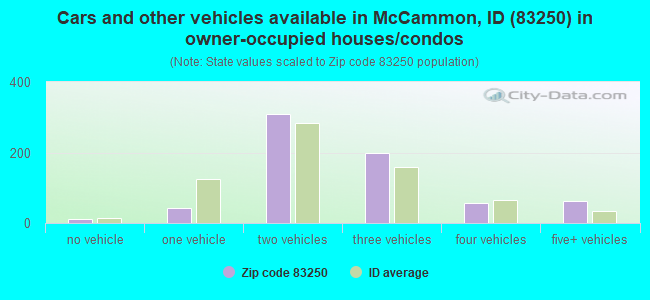
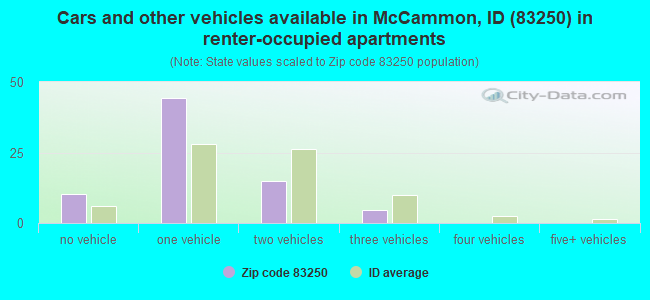
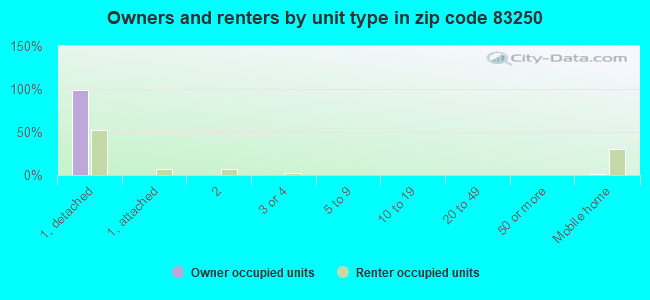
Houses and condos: 823 Renter-occupied apartments: 75
% of renters here:
10%
State:
28%
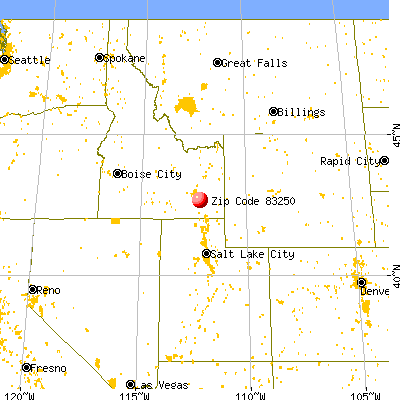
March 2022 cost of living index in zip code 83250: 86.9 (less than average, U.S. average is 100)
Land area: 76.5 sq. mi. Water area: 0.2 sq. mi.
Population density: 29 people per square mile
(very low).
OSM Map
General Map
Google Map
MSN Map
OSM Map
General Map
Google Map
MSN Map
OSM Map
General Map
Google Map
MSN Map
OSM Map
General Map
Google Map
MSN Map
Please wait while loading the map...
Real estate property taxes paid for housing units in 2022:
This zip code:
0.4% ($1,270)
Idaho:
0.5% ($1,995)
Median real estate property taxes paid for housing units with mortgages in 2022: $1,475 (0.5%) Median real estate property taxes paid for housing units with no mortgage in 2022: $1,042 (0.3%)
Business Search- 14 Million verified businesses
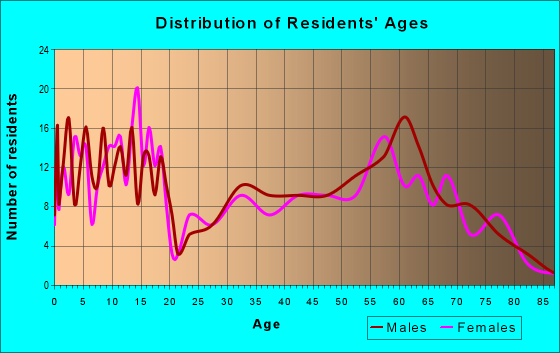
Males: 1,149
(52.5%)
Females: 1,041
(47.5%)
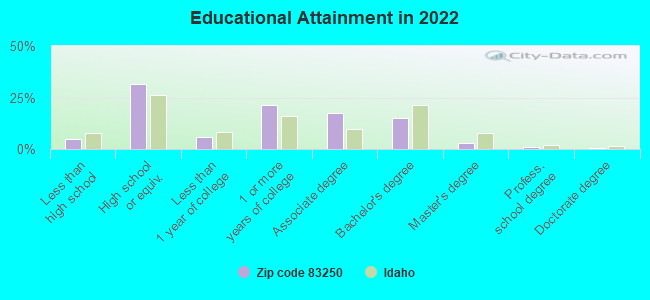
For population 25 years and over in 83250:
High school or higher: 93.8%
Bachelor's degree or higher: 19.0%
Graduate or professional degree: 4.4%
Unemployed: 4.3%
Mean travel time to work (commute): 33.7 minutes
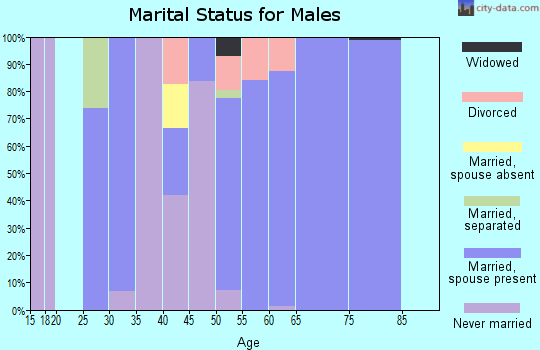
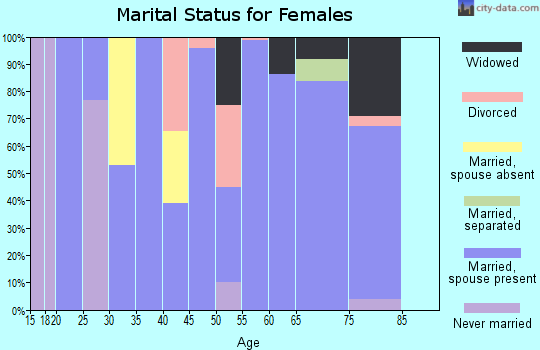
For population 15 years and over in 83250:
Never married: 16.4%
Now married: 72.5%
Separated: 0.1%
Widowed: 3.7%
Divorced: 7.4%
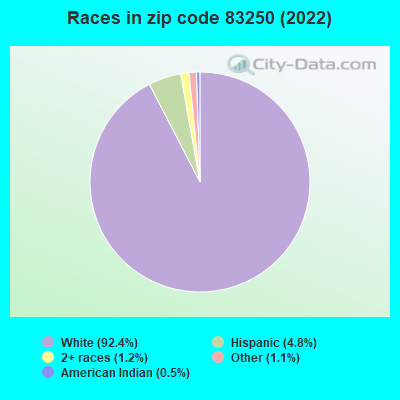
Zip code 83250 compared to state average:
Black race population percentage significantly below state average.
Hispanic race population percentage below state average.
Median age above state average.
Foreign-born population percentage significantly below state average.
Renting percentage significantly below state average.
Length of stay since moving in significantly above state average.
Number of college students below state average.
Percentage of population with a bachelor's degree or higher below state average.
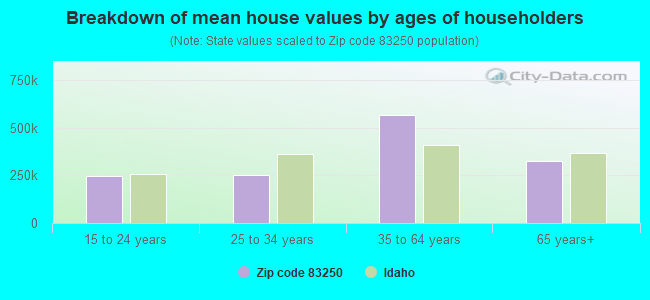
Estimated median house/condo value in 2022: $343,939
83250:
$343,939
Idaho:
$432,500
Median resident age:
This zip code:
44.2 years
Idaho median age:
37.5 years
Average household size:
This zip code:
2.9 people
Idaho:
2.6 people
Averages for the 2020 tax year for zip code 83250, filed in 2021:
Average Adjusted Gross Income (AGI) in 2020: $59,322 (Individual Income Tax Returns)
Here:
$59,322
State:
$73,627
Salary/wage: $51,886 (reported on 77.8% of returns)
Here:
$51,886
State:
$55,245
(% of AGI for various income ranges: 1151.9% for AGIs below $25k, 3080.0% for AGIs $25k-50k, 6846.7% for AGIs $50k-75k, 9401.7% for AGIs $75k-100k, 20036.7% for AGIs $100k-200k)
Taxable interest for individuals: $1,009 (reported on 31.9% of returns)
This zip code:
$1,009
Idaho:
$2,230
(% of AGI for various income ranges: 25.6% for AGIs below $25k, 47.3% for AGIs $25k-50k, 40.0% for AGIs $50k-75k, 5.0% for AGIs $75k-100k, 166.7% for AGIs $100k-200k)
Ordinary dividends: $1,288 (reported on 11.1% of returns)
Here:
$1,288
State:
$7,088
(% of AGI for various income ranges: 15.0% for AGIs below $25k, 18.9% for AGIs $50k-75k, 103.3% for AGIs $100k-200k)
Net capital gain/loss in AGI: +$16,680 (reported on 13.9% of returns)
Here:
+$16,680
State:
+$37,284
(% of AGI for various income ranges: 27.5% for AGIs below $25k, 45.6% for AGIs $50k-75k, 2638.3% for AGIs $100k-200k)
Profit/loss from business: +$3,886 (reported on 19.4% of returns)
Here:
+$3,886
State:
+$12,955
(% of AGI for various income ranges: 83.1% for AGIs below $25k, 297.3% for AGIs $25k-50k, 213.3% for AGIs $50k-75k)
Taxable individual retirement arrangement distribution: $13,483 (reported on 8.3% of returns)
83250:
$13,483
Idaho:
$20,110
(% of AGI for various income ranges: 136.2% for AGIs below $25k, 656.7% for AGIs $50k-75k)
Total itemized deductions: $34,250 (reported on 5.6% of returns)
Here:
$34,250
State:
$38,402
(% of AGI for various income ranges: 2283.3% for AGIs $100k-200k)
Charity contributions: $16,800 (reported on 4.2% of returns)
Here:
$16,800
State:
$18,314
(% of AGI for various income ranges: 840.0% for AGIs $100k-200k)
Taxes paid: $8,200 (reported on 5.6% of returns)
83250:
$8,200
State:
$7,596
(% of AGI for various income ranges: 546.7% for AGIs $100k-200k)
Earned income credit: $2,345 (reported on 15.3% of returns)
Here:
$2,345
State:
$2,195
(% of AGI for various income ranges: 99.4% for AGIs below $25k, 90.0% for AGIs $25k-50k)
Percentage of individuals using paid preparers for their 2020 taxes: 95.8%
Here:
96%
State:
94%
(% for various income ranges: 95.7% for AGIs below $25k, 93.3% for AGIs $25k-50k, 92.9% for AGIs $50k-75k, 100.0% for AGIs $75k-100k, 100.0% for AGIs $100k-200k)
Averages for the 2012 tax year for zip code 83250, filed in 2013:
Average Adjusted Gross Income (AGI) in 2012: $44,839 (Individual Income Tax Returns)
Here:
$44,839
State:
$52,536
Salary/wage: $39,700 (reported on 81.8% of returns)
Here:
$39,700
State:
$41,938
(% of AGI for various income ranges: 72.0% for AGIs below $25k, 68.5% for AGIs $25k-50k, 76.8% for AGIs $50k-75k, 84.9% for AGIs $75k-100k, 62.9% for AGIs $100k-200k)
Taxable interest for individuals: $718 (reported on 33.3% of returns)
This zip code:
$718
Idaho:
$1,874
(% of AGI for various income ranges: 0.6% for AGIs below $25k, 0.7% for AGIs $25k-50k, 0.4% for AGIs $50k-75k, 0.1% for AGIs $75k-100k, 0.8% for AGIs $100k-200k)
Ordinary dividends: $629 (reported on 10.6% of returns)
Here:
$629
State:
$5,706
Net capital gain/loss in AGI: +$4,571 (reported on 10.6% of returns)
Here:
+$4,571
State:
+$14,571
Profit/loss from business: +$2,821 (reported on 21.2% of returns)
Here:
+$2,821
State:
+$10,113
(% of AGI for various income ranges: 6.9% for AGIs below $25k, 1.4% for AGIs $25k-50k, 1.8% for AGIs $50k-75k)
Taxable individual retirement arrangement distribution: $8,380 (reported on 7.6% of returns)
83250:
$8,380
Idaho:
$14,642
Total itemized deductions: $19,423 (26% of AGI, reported on 33.3% of returns)
Here:
$19,423
State:
$22,697
Here:
26.2% of AGI
State:
22.0% of AGI
(% of AGI for various income ranges: 13.8% for AGIs below $25k, 11.2% for AGIs $25k-50k, 14.7% for AGIs $50k-75k, 17.3% for AGIs $75k-100k, 14.7% for AGIs $100k-200k)
Charity contributions: $5,328 (reported on 27.3% of returns)
Here:
$5,328
State:
$5,246
(% of AGI for various income ranges: 2.2% for AGIs below $25k, 2.5% for AGIs $25k-50k, 3.9% for AGIs $50k-75k, 3.0% for AGIs $75k-100k, 3.7% for AGIs $100k-200k)
Taxes paid: $4,500 (reported on 33.3% of returns)
83250:
$4,500
State:
$7,139
(% of AGI for various income ranges: 1.7% for AGIs below $25k, 1.5% for AGIs $25k-50k, 3.1% for AGIs $50k-75k, 3.9% for AGIs $75k-100k, 5.1% for AGIs $100k-200k)
Earned income credit: $2,200 (reported on 21.2% of returns)
Here:
$2,200
State:
$2,213
(% of AGI for various income ranges: 7.4% for AGIs below $25k, 1.4% for AGIs $25k-50k)
Percentage of individuals using paid preparers for their 2012 taxes: 56.1%
Here:
56%
State:
52%
(% for various income ranges: 44.4% for AGIs below $25k, 60.0% for AGIs $25k-50k, 66.7% for AGIs $50k-75k, 83.3% for AGIs $75k-100k, 50.0% for AGIs $100k-200k)
Averages for the 2004 tax year for zip code 83250, filed in 2005:
Average Adjusted Gross Income (AGI) in 2004: $35,024 (Individual Income Tax Returns)
Here:
$35,024
State:
$42,679
Salary/wage: $33,739 (reported on 82.5% of returns)
Here:
$33,739
State:
$35,636
(% of AGI for various income ranges: 138.1% for AGIs below $10k, 68.2% for AGIs $10k-25k, 79.4% for AGIs $25k-50k, 87.0% for AGIs $50k-75k, 79.6% for AGIs $75k-100k, 62.4% for AGIs over 100k)
Taxable interest for individuals: $620 (reported on 47.0% of returns)
This zip code:
$620
Idaho:
$2,024
(% of AGI for various income ranges: 8.3% for AGIs below $10k, 2.3% for AGIs $10k-25k, 0.5% for AGIs $25k-50k, 0.4% for AGIs $50k-75k, 0.6% for AGIs $75k-100k, 0.2% for AGIs over 100k)
Taxable dividends: $704 (reported on 11.3% of returns)
Here:
$704
State:
$2,917
Net capital gain/loss: +$1,021 (reported on 15.2% of returns)
Here:
+$1,021
State:
+$13,146
(% of AGI for various income ranges: 1.1% for AGIs $10k-25k, 0.3% for AGIs $25k-50k, 0.5% for AGIs $50k-75k, 0.4% for AGIs $75k-100k)
Profit/loss from business: +$2,937 (reported on 20.3% of returns)
Here:
+$2,937
State:
+$8,765
(% of AGI for various income ranges: 4.3% for AGIs below $10k, 1.6% for AGIs $10k-25k, 5.6% for AGIs $25k-50k, 0.8% for AGIs $50k-75k, -1.9% for AGIs $75k-100k)
IRA payment deduction: $1,400 (reported on 1.6% of returns)
83250:
$1,400
Idaho:
$3,020
Total itemized deductions: $16,423 (28% of AGI, reported on 34.0% of returns)
Here:
$16,423
State:
$18,385
Here:
28.0% of AGI
State:
23.1% of AGI
(% of AGI for various income ranges: 15.9% for AGIs $10k-25k, 16.4% for AGIs $25k-50k, 15.4% for AGIs $50k-75k, 16.9% for AGIs $75k-100k, 17.0% for AGIs over 100k)
Charity contributions deductions: $3,699 (6% of AGI, reported on 29.2% of returns)
Here:
$3,699
State:
$3,875
Here:
6.4% of AGI
State:
4.6% of AGI
(% of AGI for various income ranges: 2.0% for AGIs $10k-25k, 3.5% for AGIs $25k-50k, 3.4% for AGIs $50k-75k, 3.4% for AGIs $75k-100k, 2.4% for AGIs over 100k)
Total tax: $3,463 (reported on 69.5% of returns)
83250:
$3,463
State:
$6,282
(% of AGI for various income ranges: 2.4% for AGIs below $10k, 3.3% for AGIs $10k-25k, 5.3% for AGIs $25k-50k, 7.3% for AGIs $50k-75k, 9.8% for AGIs $75k-100k, 9.5% for AGIs over 100k)
Earned income credit: $1,444 (reported on 17.2% of returns)
Here:
$1,444
State:
$1,660
Percentage of individuals using paid preparers for their 2004 taxes: 60.8%
Here:
61%
State:
59%
(% for various income ranges: 57.1% for AGIs below $10k, 52.1% for AGIs $10k-25k, 66.7% for AGIs $25k-50k, 65.3% for AGIs $50k-75k, 67.9% for AGIs $75k-100k, 68.8% for AGIs over 100k)
Household received Food Stamps/SNAP in the past 12 months: 57 Household did not receive Food Stamps/SNAP in the past 12 months: 697
Women who had a birth in the past 12 months: 17 (16 now married, 0 unmarried) Women who did not have a birth in the past 12 months: 364 (258 now married, 108 unmarried)
Housing units in zip code 83250 with a mortgage: 304 (53 second mortgage, 35 both second mortgage and home equity loan) Houses without a mortgage: 13
Median monthly owner costs for units with a mortgage: $1,241 Median monthly owner costs for units without a mortgage: $414
Residents with income below the poverty level in 2022:
This zip code:
4.1%
Whole state:
10.7%
Residents with income below 50% of the poverty level in 2022:
This zip code:
1.4%
Whole state:
6.1%
Median number of rooms in houses and condos:
Here:
6.9
State:
6.5
Median number of rooms in apartments:
Here:
5.7
State:
4.4
Notable locations in this zip code not listed on our city pages
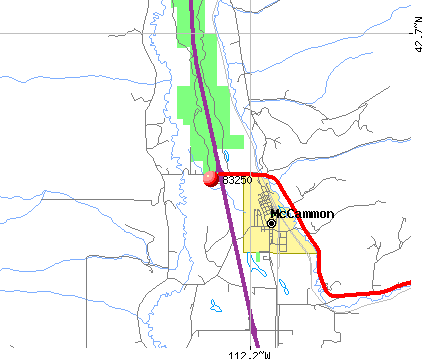
Creeks: Birch Creek (A), Bell Marsh Creek (B), Robbers Roost Creek (C), Rowe Creek (D), Twomile Creek (E), Walker Creek (F), Lost Creek (G), Harkness Creek (H), Goodenough Creek (I). Display/hide their locations on the map
In group quarters: 7 (-1 institutionalized population)
Size of family households: 325 2-persons, 112 3-persons, 142 4-persons, 35 5-persons, 31 6-persons, 4 7-or-more-persons
Size of nonfamily households: 98 1-person, 2 2-persons, 2 3-persons
463 married couples with children.
73 single-parent households (45 men, 28 women).
98.3% of residents of 83250 zip code speak English at home.
1.9% of residents speak Spanish at home (100% very well).
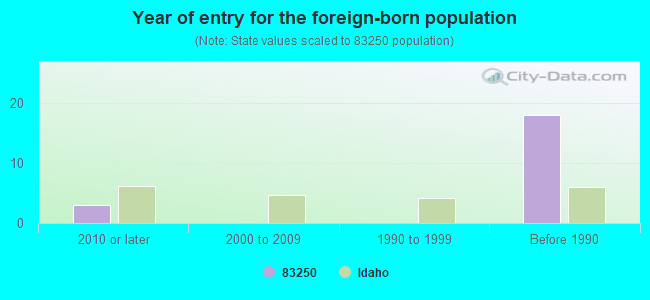
Foreign born population: 14 (0.7%) (100.0% of them are naturalized citizens)
This zip code:
0.7%
Whole state:
6.0%
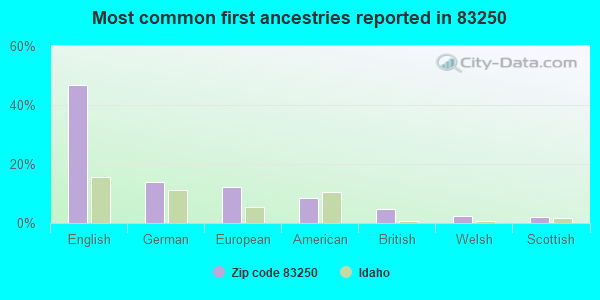
47%English
14%German
12%European
8%American
5%British
3%Welsh
2%Scottish
Year of entry for the foreign-born population
32010 or later
02000 to 2009
01990 to 1999
18Before 1990
Facilities with environmental interests located in this zip code:
DIAMOND T RANCH (1 MILE WEST OF SHRIVES RD & MARSH RD INTERSECTION in MCCAMMON, ID)
ENFORCEMENT/COMPLIANCE ACTIVITY (Integrated Compliance Information System) - ICIS-10-2003-0110, FORMAL ENFORCEMENT ACTION, ICIS-10-2004-0156, (Integrated Compliance Information System) - ICIS-10-2003-0110, FORMAL ENFORCEMENT ACTION, ICIS-10-2004-0156, Business SIC classification: HEAVY CONSTRUCTION
MOUNTAIN VIEW ELEMENTARY SCH (714 CENTER STREET in MC CAMMON, ID)
(Geographic Names Information System) (National Center for Education Statistics) - STATE ID-021 105 Organizations: MARSH VALLEY JOINT SCHOOL DISTRICT 21 (SCHOOL DISTRICT)
UNION PACIFIC RAILROAD MCCAMMON (500 FRONT STREET in MCCAMMON, ID)
Conditionally Exempt Small Quantity Generators, less than 100 kg/month of hazardous waste (Resource Conservation and Recovery Act (tracking hazardous waste)) - notification
MAVERICK COUNTRY STORES, INC. #251 (10 E. 2ND STREET SO. in SODA SPRINGS, ID)
ENFORCEMENT/COMPLIANCE ACTIVITY (Integrated Compliance Information System)
SODA POINT IDOT (1616 POWER PLANT ROAD in SODA SPRINGS, ID)
ENFORCEMENT/COMPLIANCE ACTIVITY (Integrated Compliance Information System)
Housing units lacking complete plumbing facilities: 0.3% Housing units lacking complete kitchen facilities: 0.2%
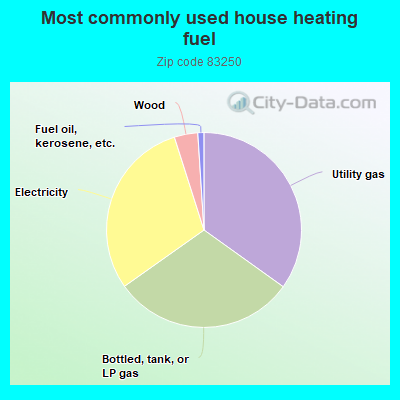
34.8%Utility gas
30.2%Bottled, tank, or LP gas
29.8%Electricity
3.9%Wood
1.0%Fuel oil, kerosene, etc.
Population in 1990: 2,603.
Place of birth for U.S.-born residents:
This state: 1,372
Northeast: 43
Midwest: 164
South: 127
West: 426
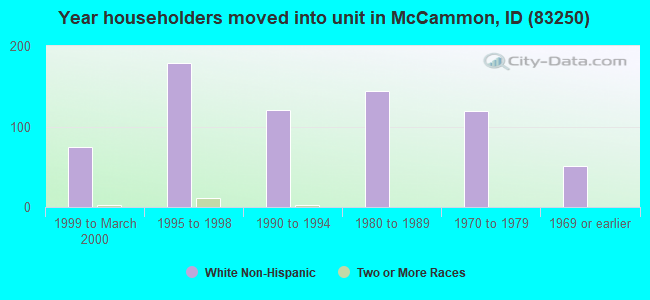
68% of the 83250 zip code residents lived in the same house 5 years ago. Out of people who lived in different houses, 67% lived in this county. Out of people who lived in different counties, 50% lived in Idaho.
91% of the 83250 zip code residents lived in the same house 1 year ago. Out of people who lived in different houses, 70% moved from this county. Out of people who lived in different houses, 12% moved from different county within same state. Out of people who lived in different houses, 15% moved from different state. Out of people who lived in different houses, 2% moved from abroad.
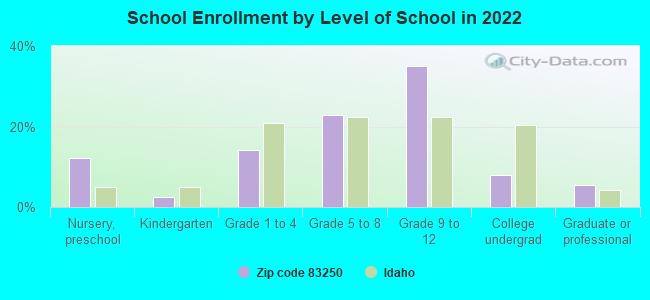
Private vs. public school enrollment:
Students in private schools in grades 1 to 8 (elementary and middle school): 40
Here:
23.9%
Idaho:
13.5%
Students in private schools in grades 9 to 12 (high school): 11
Here:
7.0%
Idaho:
8.5%
Students in private undergraduate colleges: 6
Here:
18.1%
Idaho:
30.0%
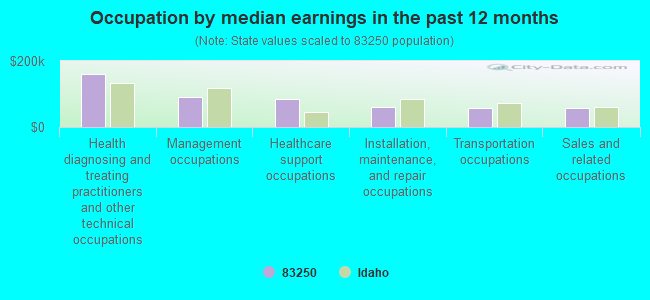
Occupation by median earnings in the past 12 months ($)
161,796Health diagnosing and treating practitioners and other technical occupations
90,457Management occupations
84,136Healthcare support occupations
60,289Installation, maintenance, and repair occupations
58,934Transportation occupations
57,188Sales and related occupations
Top industries in this zip code by the number of employees in 2005:
Construction: All Other Specialty Trade Contractors (5-9 employees: 1 establishment)
Construction: Masonry Contractors (5-9: 1)
Real Estate and Rental and Leasing: Offices of Real Estate Agents and Brokers (1-4: 1)
Construction: Poured Concrete Foundation and Structure Contractors (1-4: 1)
Professional, Scientific, and Technical Services: Tax Preparation Services (1-4: 1)
People in group quarters in 2010:
9 people in group homes intended for adults
People in group quarters in 2000:
6 people in homes for the mentally retarded
Fatal accident statistics in 2014:
Fatal accident count: 1
Vehicles involved in fatal accidents: 1
Fatal accidents caused by drunken drivers: 1
Fatalities: 1
Persons involved in fatal accidents: 1
Pedestrians involved in fatal accidents: 0
Fatal accident statistics in 2012:
Fatal accident count: 1
Vehicles involved in fatal accidents: 1
Fatal accidents caused by drunken drivers: 1
Fatalities: 1
Persons involved in fatal accidents: 1
Pedestrians involved in fatal accidents: 0
Home Mortgage Disclosure Act Aggregated Statistics For Year 2009 (Based on 6 partial tracts)
A) FHA, FSA/RHS & VA Home Purchase Loans
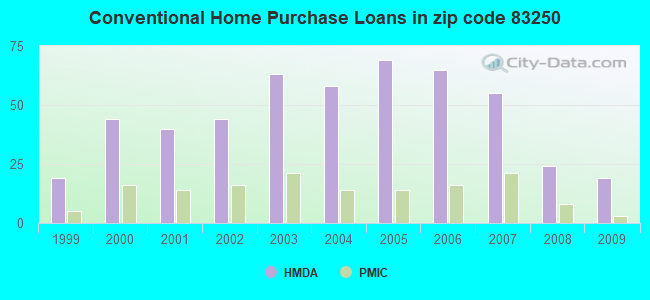
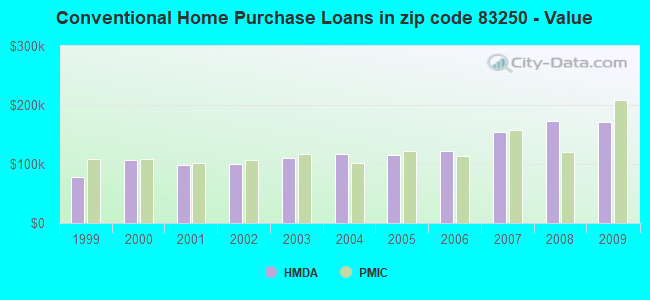
B) Conventional Home Purchase Loans
C) Refinancings
D) Home Improvement Loans
F) Non-occupant Loans on < 5 Family Dwellings (A B C & D)
G) Loans On Manufactured Home Dwelling (A B C & D)
Number
Average Value
Number
Average Value
Number
Average Value
Number
Average Value
Number
Average Value
Number
Average Value
LOANS ORIGINATED
22
$138,106
19
$170,754
133
$165,892
4
$114,488
9
$121,687
6
$93,445
APPLICATIONS APPROVED, NOT ACCEPTED
2
$157,675
2
$228,840
20
$149,502
0
$0
1
$203,850
3
$83,510
APPLICATIONS DENIED
6
$151,563
5
$125,570
48
$191,778
6
$93,015
6
$194,818
6
$100,812
APPLICATIONS WITHDRAWN
1
$161,460
2
$146,040
20
$172,043
3
$96,623
2
$156,635
1
$116,690
FILES CLOSED FOR INCOMPLETENESS
0
$0
1
$174,090
3
$184,257
0
$0
0
$0
0
$0
Aggregated Statistics For Year 2008 (Based on 6 partial tracts)
A) FHA, FSA/RHS & VA Home Purchase Loans
B) Conventional Home Purchase Loans
C) Refinancings
D) Home Improvement Loans
F) Non-occupant Loans on < 5 Family Dwellings (A B C & D)
G) Loans On Manufactured Home Dwelling (A B C & D)
Number
Average Value
Number
Average Value
Number
Average Value
Number
Average Value
Number
Average Value
Number
Average Value
LOANS ORIGINATED
10
$164,352
24
$172,407
78
$177,559
15
$54,159
11
$205,084
7
$94,227
APPLICATIONS APPROVED, NOT ACCEPTED
1
$115,460
4
$163,742
15
$129,907
2
$61,975
2
$82,315
1
$45,920
APPLICATIONS DENIED
4
$147,552
4
$130,100
56
$162,943
10
$101,175
3
$99,127
9
$111,358
APPLICATIONS WITHDRAWN
1
$222,340
3
$221,187
17
$167,834
2
$129,890
2
$151,085
3
$130,080
FILES CLOSED FOR INCOMPLETENESS
0
$0
2
$46,800
7
$251,296
1
$77,100
0
$0
0
$0
Aggregated Statistics For Year 2007 (Based on 6 partial tracts)
A) FHA, FSA/RHS & VA Home Purchase Loans
B) Conventional Home Purchase Loans
C) Refinancings
D) Home Improvement Loans
F) Non-occupant Loans on < 5 Family Dwellings (A B C & D)
G) Loans On Manufactured Home Dwelling (A B C & D)
Number
Average Value
Number
Average Value
Number
Average Value
Number
Average Value
Number
Average Value
Number
Average Value
LOANS ORIGINATED
3
$138,680
55
$154,900
81
$149,360
17
$68,729
18
$147,005
13
$116,558
APPLICATIONS APPROVED, NOT ACCEPTED
1
$115,130
9
$141,768
16
$144,543
2
$49,775
3
$77,477
1
$211,820
APPLICATIONS DENIED
1
$73,960
16
$167,513
52
$150,096
9
$86,718
8
$160,858
8
$94,545
APPLICATIONS WITHDRAWN
0
$0
2
$112,355
26
$149,892
2
$80,205
2
$113,115
3
$104,330
FILES CLOSED FOR INCOMPLETENESS
0
$0
0
$0
4
$157,742
0
$0
0
$0
0
$0
Aggregated Statistics For Year 2006 (Based on 6 partial tracts)
A) FHA, FSA/RHS & VA Home Purchase Loans
B) Conventional Home Purchase Loans
C) Refinancings
D) Home Improvement Loans
F) Non-occupant Loans on < 5 Family Dwellings (A B C & D)
G) Loans On Manufactured Home Dwelling (A B C & D)
Number
Average Value
Number
Average Value
Number
Average Value
Number
Average Value
Number
Average Value
Number
Average Value
LOANS ORIGINATED
5
$109,872
65
$122,168
75
$122,922
10
$69,847
14
$130,844
8
$84,644
APPLICATIONS APPROVED, NOT ACCEPTED
0
$0
7
$165,303
16
$195,912
2
$103,800
1
$641,430
1
$131,070
APPLICATIONS DENIED
0
$0
14
$116,535
54
$113,105
8
$86,238
4
$88,920
8
$97,931
APPLICATIONS WITHDRAWN
0
$0
3
$133,707
36
$111,994
2
$32,850
1
$54,570
3
$95,817
FILES CLOSED FOR INCOMPLETENESS
0
$0
2
$126,265
6
$128,497
2
$79,625
0
$0
0
$0
Aggregated Statistics For Year 2005 (Based on 6 partial tracts)
A) FHA, FSA/RHS & VA Home Purchase Loans
B) Conventional Home Purchase Loans
C) Refinancings
D) Home Improvement Loans
F) Non-occupant Loans on < 5 Family Dwellings (A B C & D)
G) Loans On Manufactured Home Dwelling (A B C & D)
Number
Average Value
Number
Average Value
Number
Average Value
Number
Average Value
Number
Average Value
Number
Average Value
LOANS ORIGINATED
3
$86,240
69
$115,621
74
$114,006
11
$46,919
15
$101,135
8
$89,509
APPLICATIONS APPROVED, NOT ACCEPTED
1
$110,950
8
$106,730
21
$114,131
2
$59,065
2
$70,015
3
$71,197
APPLICATIONS DENIED
2
$80,280
18
$125,091
76
$106,343
18
$61,348
6
$186,923
11
$88,138
APPLICATIONS WITHDRAWN
0
$0
7
$111,597
29
$139,126
5
$81,452
3
$68,010
1
$96,130
FILES CLOSED FOR INCOMPLETENESS
0
$0
4
$93,770
11
$126,841
1
$101,760
0
$0
2
$85,915
Aggregated Statistics For Year 2004 (Based on 6 partial tracts)
A) FHA, FSA/RHS & VA Home Purchase Loans
B) Conventional Home Purchase Loans
C) Refinancings
D) Home Improvement Loans
F) Non-occupant Loans on < 5 Family Dwellings (A B C & D)
G) Loans On Manufactured Home Dwelling (A B C & D)
Number
Average Value
Number
Average Value
Number
Average Value
Number
Average Value
Number
Average Value
Number
Average Value
LOANS ORIGINATED
3
$71,217
58
$116,120
81
$103,273
11
$53,416
12
$97,038
7
$55,874
APPLICATIONS APPROVED, NOT ACCEPTED
0
$0
12
$103,189
16
$94,163
2
$14,690
1
$101,930
2
$85,700
APPLICATIONS DENIED
2
$126,220
18
$84,718
57
$126,962
6
$60,697
5
$93,596
6
$69,257
APPLICATIONS WITHDRAWN
0
$0
7
$126,913
37
$112,593
1
$73,850
2
$103,030
2
$86,570
FILES CLOSED FOR INCOMPLETENESS
0
$0
2
$136,960
8
$97,759
1
$244,460
1
$98,100
0
$0
Aggregated Statistics For Year 2003 (Based on 6 partial tracts)
A) FHA, FSA/RHS & VA Home Purchase Loans
B) Conventional Home Purchase Loans
C) Refinancings
D) Home Improvement Loans
F) Non-occupant Loans on < 5 Family Dwellings (A B C & D)
Number
Average Value
Number
Average Value
Number
Average Value
Number
Average Value
Number
Average Value
LOANS ORIGINATED
6
$89,398
63
$110,025
172
$107,695
8
$32,339
16
$97,117
APPLICATIONS APPROVED, NOT ACCEPTED
1
$76,220
8
$96,148
25
$93,726
1
$70,170
1
$96,270
APPLICATIONS DENIED
2
$91,350
13
$71,288
78
$117,428
4
$15,068
0
$0
APPLICATIONS WITHDRAWN
0
$0
5
$121,164
44
$106,082
1
$38,320
3
$87,890
FILES CLOSED FOR INCOMPLETENESS
0
$0
4
$119,025
4
$115,815
1
$60,860
3
$106,023
Aggregated Statistics For Year 2002 (Based on 6 partial tracts)
A) FHA, FSA/RHS & VA Home Purchase Loans
B) Conventional Home Purchase Loans
C) Refinancings
D) Home Improvement Loans
E) Loans on Dwellings For 5+ Families
F) Non-occupant Loans on < 5 Family Dwellings (A B C & D)
Number
Average Value
Number
Average Value
Number
Average Value
Number
Average Value
Number
Average Value
Number
Average Value
LOANS ORIGINATED
8
$83,356
44
$100,485
138
$110,789
3
$26,627
1
$45,100
11
$99,899
APPLICATIONS APPROVED, NOT ACCEPTED
1
$110,070
6
$104,493
29
$116,927
1
$4,940
0
$0
0
$0
APPLICATIONS DENIED
0
$0
8
$74,638
42
$117,934
9
$24,966
0
$0
2
$77,570
APPLICATIONS WITHDRAWN
0
$0
3
$113,973
50
$103,711
3
$33,007
0
$0
1
$140,710
FILES CLOSED FOR INCOMPLETENESS
0
$0
2
$89,315
5
$93,708
1
$64,470
0
$0
0
$0
Aggregated Statistics For Year 2001 (Based on 6 partial tracts)
A) FHA, FSA/RHS & VA Home Purchase Loans
B) Conventional Home Purchase Loans
C) Refinancings
D) Home Improvement Loans
F) Non-occupant Loans on < 5 Family Dwellings (A B C & D)
Number
Average Value
Number
Average Value
Number
Average Value
Number
Average Value
Number
Average Value
LOANS ORIGINATED
7
$89,670
40
$98,020
110
$97,382
14
$20,336
5
$51,364
APPLICATIONS APPROVED, NOT ACCEPTED
0
$0
7
$71,410
11
$115,653
2
$14,045
0
$0
APPLICATIONS DENIED
2
$98,305
11
$66,747
43
$89,195
5
$23,662
2
$21,450
APPLICATIONS WITHDRAWN
1
$95,770
4
$84,720
36
$95,120
3
$28,013
1
$116,780
FILES CLOSED FOR INCOMPLETENESS
0
$0
1
$95,800
7
$152,420
0
$0
0
$0
Aggregated Statistics For Year 2000 (Based on 6 partial tracts)
A) FHA, FSA/RHS & VA Home Purchase Loans
B) Conventional Home Purchase Loans
C) Refinancings
D) Home Improvement Loans
F) Non-occupant Loans on < 5 Family Dwellings (A B C & D)
Number
Average Value
Number
Average Value
Number
Average Value
Number
Average Value
Number
Average Value
LOANS ORIGINATED
7
$84,457
44
$106,099
36
$93,247
9
$14,547
6
$69,908
APPLICATIONS APPROVED, NOT ACCEPTED
2
$45,020
4
$63,615
11
$85,896
1
$18,040
2
$33,910
APPLICATIONS DENIED
2
$84,110
19
$69,803
29
$68,847
4
$27,340
1
$70,360
APPLICATIONS WITHDRAWN
0
$0
6
$99,565
9
$70,343
2
$46,165
0
$0
FILES CLOSED FOR INCOMPLETENESS
0
$0
2
$68,780
5
$84,562
0
$0
0
$0
Aggregated Statistics For Year 1999 (Based on 3 partial tracts)
A) FHA, FSA/RHS & VA Home Purchase Loans
B) Conventional Home Purchase Loans
C) Refinancings
D) Home Improvement Loans
F) Non-occupant Loans on < 5 Family Dwellings (A B C & D)


 Nearest zip codes: 83245, 83214, 83246, 83202, 83234, 83217.