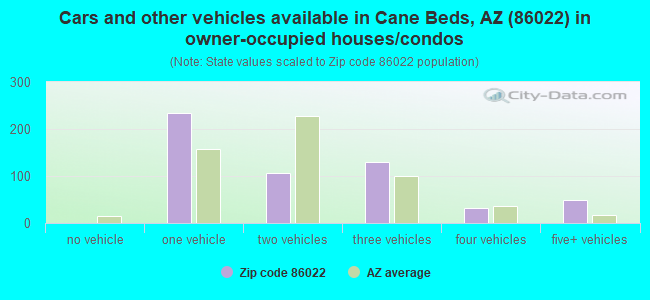
Estimated zip code population in 2022: 1,702 Zip code population in 2010: 2,210 Zip code population in 2000: 1,800
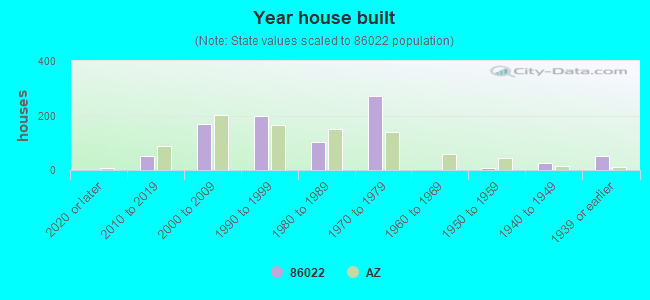
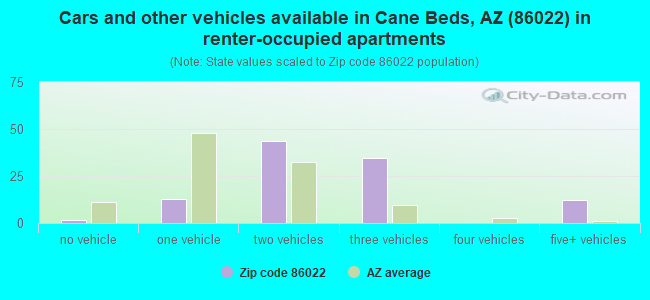
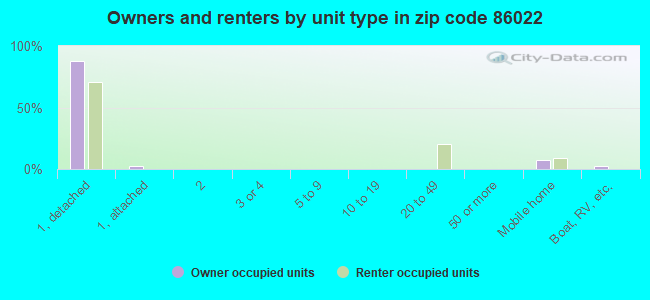
Houses and condos: 908 Renter-occupied apartments: 100
% of renters here:
15%
State:
33%
March 2022 cost of living index in zip code 86022: 85.8 (less than average, U.S. average is 100)
Land area: 560.6 sq. mi. Water area: 0.1 sq. mi.
Population density: 3 people per square mile
(very low).
OSM Map
General Map
Google Map
MSN Map
OSM Map
General Map
Google Map
MSN Map
OSM Map
General Map
Google Map
MSN Map
OSM Map
General Map
Google Map
MSN Map
Please wait while loading the map...
Real estate property taxes paid for housing units in 2022:
This zip code:
0.3% ($763)
Arizona:
0.4% ($1,786)
Median real estate property taxes paid for housing units with mortgages in 2022: $678 (0.3%) Median real estate property taxes paid for housing units with no mortgage in 2022: $813 (0.3%)
Business Search- 14 Million verified businesses
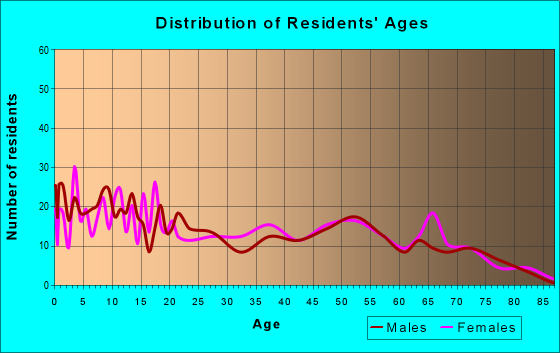
Males: 793
(46.6%)
Females: 908
(53.4%)
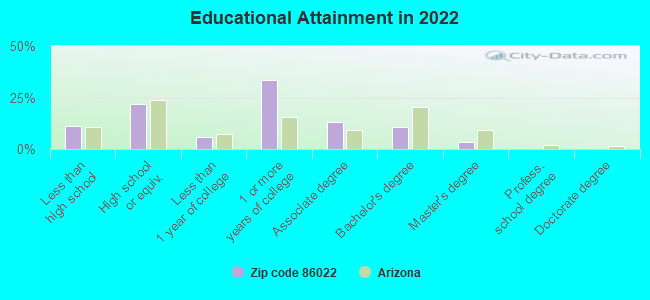
For population 25 years and over in 86022:
High school or higher: 86.6%
Bachelor's degree or higher: 13.8%
Graduate or professional degree: 3.6%
Unemployed: 3.1%
Mean travel time to work (commute): 26.5 minutes
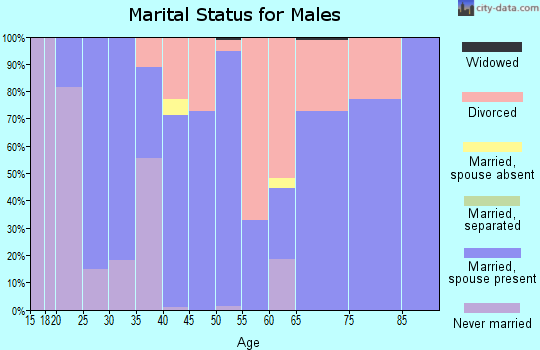
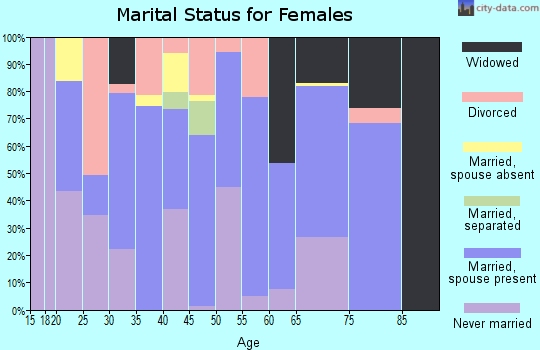
For population 15 years and over in 86022:
Never married: 31.1%
Now married: 47.1%
Separated: 0.3%
Widowed: 9.6%
Divorced: 11.8%
Zip code 86022 compared to state average:
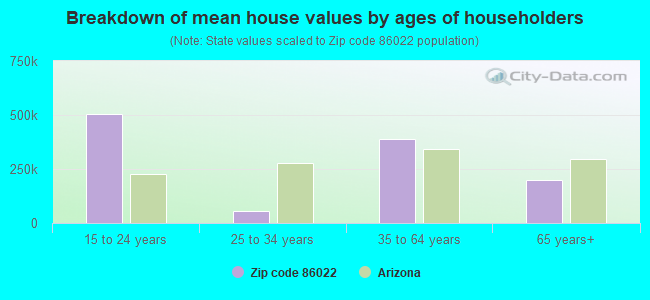
Median house value below state average.
Black race population percentage significantly below state average.
Hispanic race population percentage below state average.
Foreign-born population percentage significantly below state average.
Renting percentage below state average.
Length of stay since moving in significantly above state average.
Number of rooms per house below state average.
Number of college students significantly below state average.
Percentage of population with a bachelor's degree or higher below state average.
Averages for the 2020 tax year for zip code 86022, filed in 2021:
Average Adjusted Gross Income (AGI) in 2020: $39,398 (Individual Income Tax Returns)
Here:
$39,398
State:
$73,499
Salary/wage: $33,825 (reported on 82.1% of returns)
Here:
$33,825
State:
$59,499
(% of AGI for various income ranges: 1118.4% for AGIs below $25k, 3694.0% for AGIs $25k-50k, 6618.8% for AGIs $50k-75k, 7796.0% for AGIs $75k-100k)
Taxable interest for individuals: $800 (reported on 17.9% of returns)
This zip code:
$800
Arizona:
$2,325
(% of AGI for various income ranges: 4.8% for AGIs below $25k, 15.0% for AGIs $25k-50k, 83.8% for AGIs $50k-75k, 22.0% for AGIs $75k-100k)
Ordinary dividends: $1,767 (reported on 3.6% of returns)
Here:
$1,767
State:
$8,711
(% of AGI for various income ranges: 26.5% for AGIs $25k-50k)
Net capital gain/loss in AGI: +$3,425 (reported on 4.8% of returns)
Here:
+$3,425
State:
+$31,332
(% of AGI for various income ranges: 68.5% for AGIs $25k-50k)
Profit/loss from business: +$7,575 (reported on 14.3% of returns)
Here:
+$7,575
State:
+$13,214
(% of AGI for various income ranges: 112.0% for AGIs below $25k, 83.5% for AGIs $25k-50k, 577.5% for AGIs $50k-75k)
Taxable individual retirement arrangement distribution: $8,600 (reported on 3.6% of returns)
86022:
$8,600
Arizona:
$23,364
(% of AGI for various income ranges: 129.0% for AGIs $25k-50k)
Earned income credit: $2,385 (reported on 23.8% of returns)
Here:
$2,385
State:
$2,383
(% of AGI for various income ranges: 102.0% for AGIs below $25k, 111.0% for AGIs $25k-50k)
Percentage of individuals using paid preparers for their 2020 taxes: 91.7%
Here:
92%
State:
93%
(% for various income ranges: 91.4% for AGIs below $25k, 92.3% for AGIs $25k-50k, 91.7% for AGIs $50k-75k, 100.0% for AGIs $75k-100k, 80.0% for AGIs $100k-200k)
Averages for the 2012 tax year for zip code 86022, filed in 2013:
Average Adjusted Gross Income (AGI) in 2012: $31,568 (Individual Income Tax Returns)
Here:
$31,568
State:
$57,644
Salary/wage: $28,336 (reported on 85.3% of returns)
Here:
$28,336
State:
$47,932
(% of AGI for various income ranges: 75.8% for AGIs below $25k, 73.8% for AGIs $25k-50k, 79.4% for AGIs $50k-75k, 77.3% for AGIs $75k-100k)
Taxable interest for individuals: $889 (reported on 25.3% of returns)
This zip code:
$889
Arizona:
$2,064
(% of AGI for various income ranges: 0.7% for AGIs below $25k, 1.4% for AGIs $25k-50k, 0.5% for AGIs $50k-75k)
Ordinary dividends: $875 (reported on 5.3% of returns)
Here:
$875
State:
$7,268
Profit/loss from business: +$2,510 (reported on 13.3% of returns)
Here:
+$2,510
State:
+$12,323
(% of AGI for various income ranges: 3.5% for AGIs below $25k, 0.2% for AGIs $25k-50k, 1.0% for AGIs $50k-75k)
Taxable individual retirement arrangement distribution: $5,775 (reported on 5.3% of returns)
86022:
$5,775
Arizona:
$18,280
Total itemized deductions: $17,850 (30% of AGI, reported on 13.3% of returns)
Here:
$17,850
State:
$23,651
Here:
29.7% of AGI
State:
20.6% of AGI
(% of AGI for various income ranges: 8.2% for AGIs $25k-50k, 10.6% for AGIs $50k-75k, 9.4% for AGIs $75k-100k)
Charity contributions: $5,850 (reported on 10.7% of returns)
Here:
$5,850
State:
$4,114
Taxes paid: $3,100 (reported on 13.3% of returns)
86022:
$3,100
State:
$6,509
(% of AGI for various income ranges: 1.3% for AGIs $25k-50k, 1.8% for AGIs $50k-75k, 1.9% for AGIs $75k-100k)
Earned income credit: $2,368 (reported on 25.3% of returns)
Here:
$2,368
State:
$2,432
(% of AGI for various income ranges: 7.2% for AGIs below $25k, 1.6% for AGIs $25k-50k)
Percentage of individuals using paid preparers for their 2012 taxes: 64.0%
Here:
64%
State:
52%
(% for various income ranges: 60.5% for AGIs below $25k, 70.0% for AGIs $25k-50k, 66.7% for AGIs $50k-75k, 60.0% for AGIs $75k-100k)
Averages for the 2004 tax year for zip code 86022, filed in 2005:
Average Adjusted Gross Income (AGI) in 2004: $26,332 (Individual Income Tax Returns)
Here:
$26,332
State:
$50,097
Salary/wage: $24,796 (reported on 86.4% of returns)
Here:
$24,796
State:
$42,146
(% of AGI for various income ranges: 130.3% for AGIs below $10k, 81.1% for AGIs $10k-25k, 83.6% for AGIs $25k-50k, 76.3% for AGIs $50k-75k, 74.0% for AGIs $75k-100k)
Taxable interest for individuals: $930 (reported on 30.0% of returns)
This zip code:
$930
Arizona:
$2,374
(% of AGI for various income ranges: 5.8% for AGIs below $10k, 0.5% for AGIs $10k-25k, 1.6% for AGIs $25k-50k, 0.7% for AGIs $50k-75k, 0.2% for AGIs $75k-100k)
Taxable dividends: $342 (reported on 5.3% of returns)
Here:
$342
State:
$3,888
Net capital gain/loss: +$1,667 (reported on 6.8% of returns)
Here:
+$1,667
State:
+$17,569
(% of AGI for various income ranges: -1.5% for AGIs below $10k, 0.2% for AGIs $10k-25k, 0.1% for AGIs $25k-50k, 1.6% for AGIs $50k-75k)
Profit/loss from business: +$2,300 (reported on 12.7% of returns)
Here:
+$2,300
State:
+$11,088
(% of AGI for various income ranges: 17.2% for AGIs below $10k, 4.2% for AGIs $10k-25k, -1.5% for AGIs $25k-50k, 0.4% for AGIs $50k-75k)
IRA payment deduction: $2,364 (reported on 1.5% of returns)
86022:
$2,364
Arizona:
$3,023
Total itemized deductions: $14,084 (28% of AGI, reported on 18.4% of returns)
Here:
$14,084
State:
$19,781
Here:
28.3% of AGI
State:
21.8% of AGI
(% of AGI for various income ranges: 7.2% for AGIs $10k-25k, 8.9% for AGIs $25k-50k, 13.3% for AGIs $50k-75k, 12.7% for AGIs $75k-100k)
Charity contributions deductions: $4,009 (8% of AGI, reported on 16.5% of returns)
Here:
$4,009
State:
$3,389
Here:
7.7% of AGI
State:
3.5% of AGI
(% of AGI for various income ranges: 1.4% for AGIs $10k-25k, 2.1% for AGIs $25k-50k, 4.1% for AGIs $50k-75k, 3.1% for AGIs $75k-100k)
Total tax: $2,506 (reported on 63.2% of returns)
86022:
$2,506
State:
$8,323
(% of AGI for various income ranges: 3.5% for AGIs below $10k, 3.6% for AGIs $10k-25k, 5.0% for AGIs $25k-50k, 7.6% for AGIs $50k-75k, 10.0% for AGIs $75k-100k)
Earned income credit: $1,909 (reported on 26.3% of returns)
Here:
$1,909
State:
$1,786
Percentage of individuals using paid preparers for their 2004 taxes: 69.8%
Here:
70%
State:
60%
(% for various income ranges: 60.4% for AGIs below $10k, 71.4% for AGIs $10k-25k, 75.9% for AGIs $25k-50k, 74.3% for AGIs $50k-75k, 67.7% for AGIs $75k-100k)
Household received Food Stamps/SNAP in the past 12 months: 102 Household did not receive Food Stamps/SNAP in the past 12 months: 540
Women who did not have a birth in the past 12 months: 382 (121 now married, 262 unmarried)
Housing units in zip code 86022 with a mortgage: 174 (8 second mortgage, 9 both second mortgage and home equity loan) Median monthly owner costs for units with a mortgage: $1,070 Median monthly owner costs for units without a mortgage: $317
Residents with income below the poverty level in 2022:
This zip code:
12.6%
Whole state:
12.5%
Residents with income below 50% of the poverty level in 2022:
This zip code:
5.3%
Whole state:
6.0%
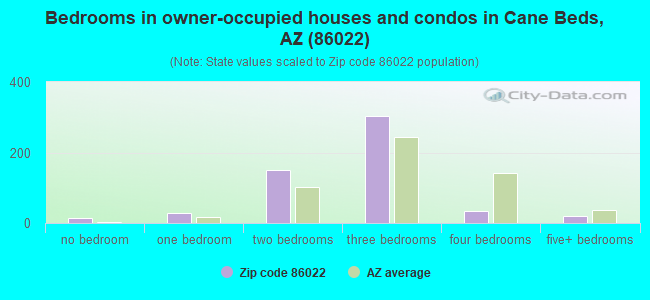
Median number of rooms in houses and condos:
Here:
4.9
State:
6.0
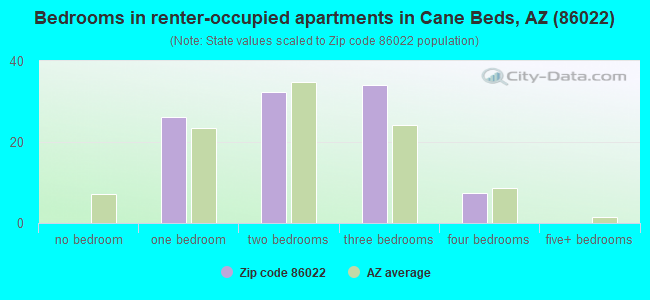
Median number of rooms in apartments:
Here:
4.1
State:
4.1
Notable locations in this zip code not listed on our city pages
Notable locations in zip code 86022: Twomile Corrals (A), Kaibab Lodge (B), Chatterly Ranch (C), Arizona Inspection Station (D), Mangum Camp (E), South Cutler Pockets Corral (F), Mangum Camp (G), Pleasant Valley Cabin (H), Big Springs Ranger Station (I), DeMotte Campground (J), Moquitch Camp (K), Esplins Corral (L), Fredonia Municipal Court (M), Fredonia Public Library (N), Fredonia Fire Department (O). Display/hide their locations on the map
Lakes and reservoirs: Stock Pond (A), Warm Springs Lake (B), Mile-and-a-half Lake (C), Mud Lake (D), East Lake (E), Crane Lake (F), Franks Lake (G), Joes Mud Hole (H). Display/hide their locations on the map
Streams, rivers, and creeks: Sandy Canyon Wash (A), Sand Wash (B), Cottonwood Creek (C), Cottonwood Wash (D), Lost Spring Wash (E), South Moccasin Wash (F), Twomile Wash (G), Sungabi Creek (H). Display/hide their locations on the map
Size of family households: 156 2-persons, 116 3-persons, 49 4-persons, 58 5-persons, 15 6-persons, 3 7-or-more-persons
Size of nonfamily households: 206 1-person, 38 2-persons
223 married couples with children.
41 single-parent households (4 men, 37 women).
97.4% of residents of 86022 zip code speak English at home.
1.9% of residents speak Spanish at home (100% very well).
1.0% of residents speak other language at home (88% very well, 12% well).
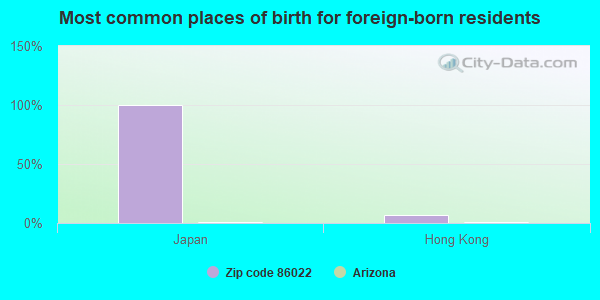
Foreign born population: 16 (0.9%) (100.0% of them are naturalized citizens)
This zip code:
0.9%
Whole state:
13.1%
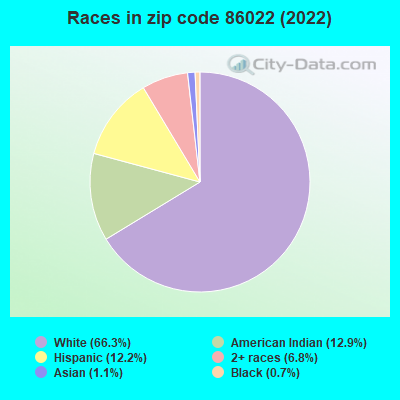
100%Japan
7%Hong Kong
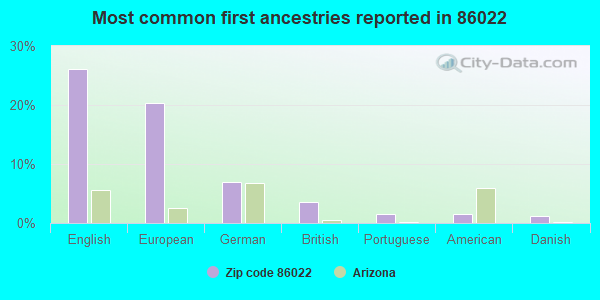
26%English
20%European
7%German
4%British
2%Portuguese
1%American
1%Danish
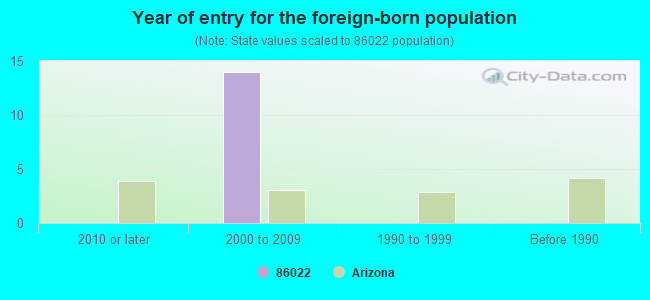
Year of entry for the foreign-born population
02010 or later
142000 to 2009
01990 to 1999
0Before 1990
Facilities with environmental interests located in this zip code:
FREDONIA STANDBY FACILITY (1346 NORTH HIGHWAY 89A in FREDONIA, AZ)
STATE MASTER (Arizona's Tracking Of The Environment) - AZURITE-559, WASTE, UNDERGROUND STORAGE TANK PROGRAM, AIR MINOR, ASBESTOS ABATEMENT PROGRAM, LEAKING STORAGE TANK SUPERFUND (Superfund database) CRITERIA AND HAZARDOUS AIR POLLUTANT INVENTORY (Inventory of air pollution sources) TRI REPORTER (Tracking of toxic chemicals releasing facilities) Business SIC classification: PETROLEUM REFINING; ASPHALT PAVING MIXTURES AND BLOCKS Business NAICS classification: ASPHALT PAVING MIXTURE AND BLOCK MANUFACTURING. Organizations: INTERMOUNTAIN REFINING CO INC (CONTACT/GENERAL)
, GARKANE ENERGY COOPERATIVE, INC. (CONTACT/GENERAL)
Alternative names: ARIZONA DEPARTMENT OF TRANSPORTATION MAINTENANCE YARD, ARIZONA FUELS CORP, INTERMOUNTAIN REFINING, PETRO SOURCE ASPHALT, SAHUARO PETROLEUM & ASPHALT
FREDONIA ELEMENTARY SCHOOL (222 N 200 EAST in FREDONIA, AZ)
(Geographic Names Information System) (National Center for Education Statistics) - STATE ID-101 Organizations: FREDONIA-MOCCASIN UNIFIED DISTRICT (SCHOOL DISTRICT)
FREDONIA HIGH SCHOOL (221 E HORTT STREET in FREDONIA, AZ)
(Geographic Names Information System) (National Center for Education Statistics) - STATE ID-203 Organizations: FREDONIA-MOCCASIN UNIFIED DISTRICT (SCHOOL DISTRICT)
Alternative names: CAVIAT- FREDONIA HIGH SCHOOL
ADOT EQUIPMENT SVCS (HWY 89 A MP 610 in FREDONIA, AZ)
(Resource Conservation and Recovery Act (tracking hazardous waste)) Organizations: STATE OF ARIZONA DEPT OF TRANS (CONTACT/OWNER)
ARIZONA REFINING C0 (1 MI N ON 89A in FREDONIA, AZ)
(Resource Conservation and Recovery Act (tracking hazardous waste)) Organizations: ARIZONA REFINING COMPANY (CONTACT/OWNER)
CROWN ASPHALT PRODUCTS CO FREDONIA ASPHALT TERMINAL (HIGHWAY 89 A 1420 NORTH in FREDONIA, AZ)
Conditionally Exempt Small Quantity Generators, less than 100 kg/month of hazardous waste (Resource Conservation and Recovery Act (tracking hazardous waste)) TRI REPORTER (Tracking of toxic chemicals releasing facilities) Business SIC classification: ASPHALT PAVING MIXTURES AND BLOCKS Business NAICS classification: ASPHALT PAVING MIXTURE AND BLOCK MANUFACTURING. Organizations: PETRO SOURCE CORPORATION (CONTACT/OWNER)
Alternative names: CROWN ASPHALT PRODUCTS COMPANY, PETRO SOURCE ASPHALT TERMINAL, SAHUARO PETROLEUM & ASPHALT CO.
FREDONIA-MOCCASIN SD #6 (220 E HORTT in FREDONIA, AZ)
COMPLIANCE ACTIVITY (Tracking inspections of insecticide, fungicide, and rodenticide, and toxic substances) Alternative names: FREDONIA-MOCCASIN UNIFIED SD
ABANDONED COPPER MINE (COPPER MINE in FREDONIA, AZ) . Tribal Land
SUPERFUND (Superfund database) Alternative names: ABANDONED COPPER MINE NN
Housing units lacking complete plumbing facilities: 8.6% Housing units lacking complete kitchen facilities: 5.6%
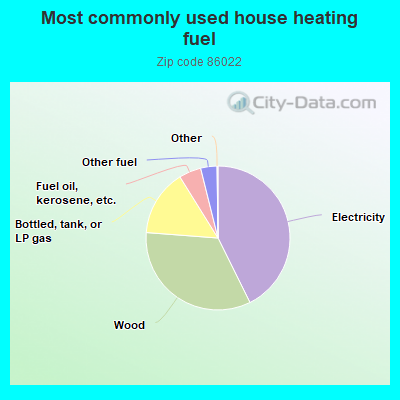
42.9%Electricity
33.7%Wood
15.0%Bottled, tank, or LP gas
5.0%Fuel oil, kerosene, etc.
3.7%Other fuel
Population in 1990: 1,393. Population change in the 1990s: +407 (+29.2%).
Place of birth for U.S.-born residents:
This state: 460
Northeast: 33
Midwest: 53
South: 59
West: 1,116
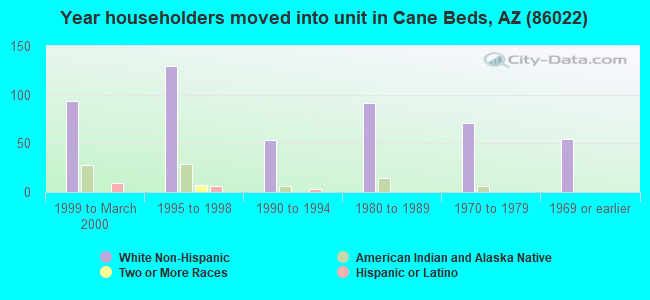
50% of the 86022 zip code residents lived in the same house 5 years ago. Out of people who lived in different houses, 34% lived in this county. Out of people who lived in different counties, 50% lived in Arizona.
98% of the 86022 zip code residents lived in the same house 1 year ago. Out of people who lived in different houses, 53% moved from this county. Out of people who lived in different houses, 13% moved from different county within same state. Out of people who lived in different houses, 80% moved from different state.
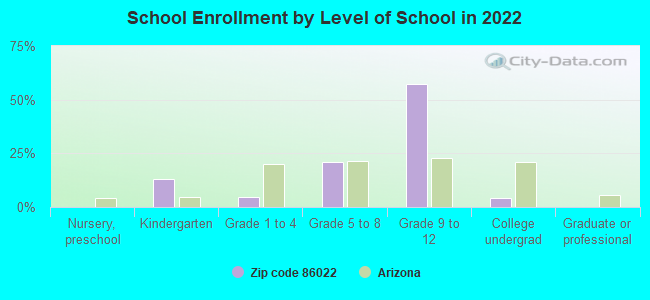
Private vs. public school enrollment:
Students in private schools in grades 1 to 8 (elementary and middle school):
Here:
1.4%
Arizona:
10.4%
Students in private schools in grades 9 to 12 (high school):
Here:
0.0%
Arizona:
8.8%
Students in private undergraduate colleges:
Here:
0.0%
Arizona:
13.1%
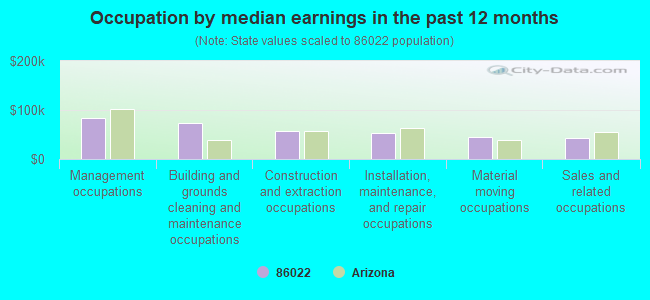
Occupation by median earnings in the past 12 months ($)
84,201Management occupations
72,561Building and grounds cleaning and maintenance occupations
56,984Construction and extraction occupations
54,025Installation, maintenance, and repair occupations
44,055Material moving occupations
43,421Sales and related occupations
Companies with federal contracts located in this zip code:
A S Z JOHNSON ENTERPRISE INC (14 N SUNNYBROOK in FREDONIA, AZ; small business) 3 employees, $125000 revenue. : $66,726 in 4 contractsin 2002
$33,000 with National Park Service for Facilities Operations Support Services. Taking place in UT. Signed on 2002-04-15. Completion date: 2002-11-15.
$33,000, same as above.Signed on 2002-05-15. Completion date: 2002-11-15.
$720, same as above.Signed on 2002-11-15. Completion date: 2002-11-15.
$6, same as above.Signed on 2002-10-15. Completion date: 2002-11-15.
Top industries in this zip code by the number of employees in 2005:
Wholesale Trade: Other Grocery and Related Products Merchant Wholesalers (10-19 employees: 1 establishment)
Construction: Site Preparation Contractors (5-9: 1)
Accommodation and Food Services: Full-Service Restaurants (5-9: 1)
Accommodation and Food Services: Hotels (except Casino Hotels) and Motels (5-9: 1)
Other Services (except Public Administration): Automotive Oil Change and Lubrication Shops (5-9: 1)
Health Care and Social Assistance: All Other Outpatient Care Centers (5-9: 1)
Construction: Highway, Street, and Bridge Construction (5-9: 1)
Fatal accident statistics in 2012:
Fatal accident count: 1
Vehicles involved in fatal accidents: 1
Fatal accidents caused by drunken drivers: 0
Fatalities: 1
Persons involved in fatal accidents: 1
Pedestrians involved in fatal accidents: 0
Home Mortgage Disclosure Act Aggregated Statistics For Year 2009 (Based on 2 partial tracts)
A) FHA, FSA/RHS & VA Home Purchase Loans
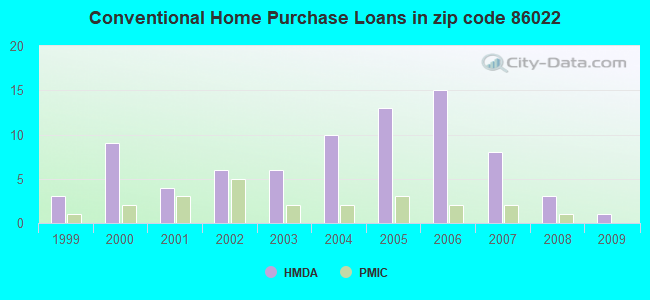
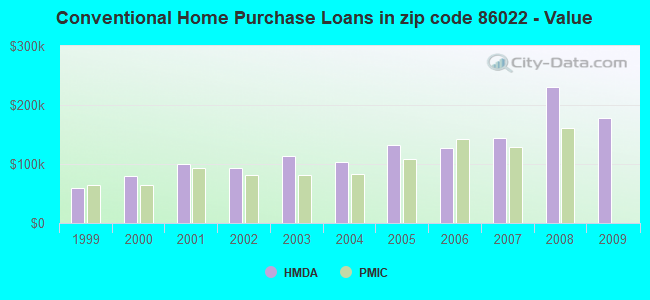
B) Conventional Home Purchase Loans
C) Refinancings
D) Home Improvement Loans
F) Non-occupant Loans on < 5 Family Dwellings (A B C & D)
G) Loans On Manufactured Home Dwelling (A B C & D)
Number
Average Value
Number
Average Value
Number
Average Value
Number
Average Value
Number
Average Value
Number
Average Value
LOANS ORIGINATED
2
$119,505
1
$177,160
11
$158,642
1
$165,800
1
$70,270
2
$118,035
APPLICATIONS APPROVED, NOT ACCEPTED
0
$0
0
$0
4
$121,085
0
$0
0
$0
1
$113,200
APPLICATIONS DENIED
2
$155,065
3
$122,873
10
$165,416
2
$25,250
1
$167,480
5
$98,130
APPLICATIONS WITHDRAWN
0
$0
0
$0
3
$163,550
0
$0
0
$0
1
$106,880
FILES CLOSED FOR INCOMPLETENESS
0
$0
0
$0
0
$0
0
$0
0
$0
0
$0
Aggregated Statistics For Year 2008 (Based on 2 partial tracts)
A) FHA, FSA/RHS & VA Home Purchase Loans
B) Conventional Home Purchase Loans
C) Refinancings
D) Home Improvement Loans
F) Non-occupant Loans on < 5 Family Dwellings (A B C & D)
G) Loans On Manufactured Home Dwelling (A B C & D)
Number
Average Value
Number
Average Value
Number
Average Value
Number
Average Value
Number
Average Value
Number
Average Value
LOANS ORIGINATED
1
$154,010
3
$230,317
11
$142,154
1
$40,400
1
$211,240
3
$115,440
APPLICATIONS APPROVED, NOT ACCEPTED
1
$102,680
1
$126,240
1
$127,500
0
$0
0
$0
1
$142,230
APPLICATIONS DENIED
2
$177,790
6
$155,837
5
$172,612
2
$56,810
0
$0
4
$94,995
APPLICATIONS WITHDRAWN
0
$0
0
$0
6
$153,452
0
$0
0
$0
2
$106,885
FILES CLOSED FOR INCOMPLETENESS
0
$0
0
$0
1
$83,320
0
$0
0
$0
0
$0
Aggregated Statistics For Year 2007 (Based on 2 partial tracts)
A) FHA, FSA/RHS & VA Home Purchase Loans
B) Conventional Home Purchase Loans
C) Refinancings
D) Home Improvement Loans
F) Non-occupant Loans on < 5 Family Dwellings (A B C & D)
G) Loans On Manufactured Home Dwelling (A B C & D)
Number
Average Value
Number
Average Value
Number
Average Value
Number
Average Value
Number
Average Value
Number
Average Value
LOANS ORIGINATED
2
$183,470
8
$144,176
11
$133,815
1
$183,890
1
$221,760
6
$111,722
APPLICATIONS APPROVED, NOT ACCEPTED
0
$0
2
$84,160
2
$84,580
0
$0
0
$0
0
$0
APPLICATIONS DENIED
0
$0
6
$155,205
11
$118,206
5
$84,750
1
$80,370
4
$65,540
APPLICATIONS WITHDRAWN
0
$0
1
$151,490
3
$127,923
0
$0
0
$0
1
$129,190
FILES CLOSED FOR INCOMPLETENESS
0
$0
0
$0
1
$114,460
0
$0
0
$0
1
$106,040
Aggregated Statistics For Year 2006 (Based on 2 partial tracts)
A) FHA, FSA/RHS & VA Home Purchase Loans
B) Conventional Home Purchase Loans
C) Refinancings
D) Home Improvement Loans
F) Non-occupant Loans on < 5 Family Dwellings (A B C & D)
G) Loans On Manufactured Home Dwelling (A B C & D)
Number
Average Value
Number
Average Value
Number
Average Value
Number
Average Value
Number
Average Value
Number
Average Value
LOANS ORIGINATED
1
$101,830
15
$126,661
12
$81,846
1
$50,920
8
$113,826
11
$103,287
APPLICATIONS APPROVED, NOT ACCEPTED
0
$0
3
$83,177
3
$139,567
1
$189,360
1
$129,610
1
$106,880
APPLICATIONS DENIED
0
$0
10
$111,175
13
$106,074
3
$45,727
2
$136,130
5
$96,952
APPLICATIONS WITHDRAWN
0
$0
5
$95,942
5
$87,022
0
$0
1
$93,000
2
$75,955
FILES CLOSED FOR INCOMPLETENESS
0
$0
0
$0
3
$82,197
0
$0
0
$0
0
$0
Aggregated Statistics For Year 2005 (Based on 2 partial tracts)
A) FHA, FSA/RHS & VA Home Purchase Loans
B) Conventional Home Purchase Loans
C) Refinancings
D) Home Improvement Loans
F) Non-occupant Loans on < 5 Family Dwellings (A B C & D)
G) Loans On Manufactured Home Dwelling (A B C & D)
Number
Average Value
Number
Average Value
Number
Average Value
Number
Average Value
Number
Average Value
Number
Average Value
LOANS ORIGINATED
0
$0
13
$131,937
11
$84,695
2
$83,740
4
$137,180
7
$85,903
APPLICATIONS APPROVED, NOT ACCEPTED
0
$0
2
$108,145
1
$88,370
0
$0
1
$75,740
1
$106,880
APPLICATIONS DENIED
1
$73,220
5
$106,968
13
$94,907
2
$11,150
2
$95,940
5
$80,288
APPLICATIONS WITHDRAWN
0
$0
1
$179,260
5
$93,670
0
$0
0
$0
2
$67,750
FILES CLOSED FOR INCOMPLETENESS
0
$0
0
$0
3
$95,380
0
$0
0
$0
0
$0
Aggregated Statistics For Year 2004 (Based on 2 partial tracts)
A) FHA, FSA/RHS & VA Home Purchase Loans
B) Conventional Home Purchase Loans
C) Refinancings
D) Home Improvement Loans
F) Non-occupant Loans on < 5 Family Dwellings (A B C & D)
G) Loans On Manufactured Home Dwelling (A B C & D)
Number
Average Value
Number
Average Value
Number
Average Value
Number
Average Value
Number
Average Value
Number
Average Value
LOANS ORIGINATED
1
$52,180
10
$103,391
14
$100,871
2
$12,205
4
$136,970
6
$80,863
APPLICATIONS APPROVED, NOT ACCEPTED
0
$0
1
$61,020
2
$53,440
0
$0
1
$35,770
1
$41,240
APPLICATIONS DENIED
0
$0
6
$61,717
15
$87,414
1
$60,170
1
$48,810
4
$67,538
APPLICATIONS WITHDRAWN
0
$0
4
$84,790
7
$89,630
0
$0
1
$83,320
1
$64,800
FILES CLOSED FOR INCOMPLETENESS
0
$0
0
$0
3
$89,210
0
$0
0
$0
0
$0
Aggregated Statistics For Year 2003 (Based on 2 partial tracts)
B) Conventional Home Purchase Loans
C) Refinancings
D) Home Improvement Loans
F) Non-occupant Loans on < 5 Family Dwellings (A B C & D)
Number
Average Value
Number
Average Value
Number
Average Value
Number
Average Value
LOANS ORIGINATED
6
$113,265
19
$84,536
0
$0
2
$61,435
APPLICATIONS APPROVED, NOT ACCEPTED
2
$177,580
2
$54,705
0
$0
0
$0
APPLICATIONS DENIED
3
$77,007
20
$69,264
1
$19,360
0
$0
APPLICATIONS WITHDRAWN
0
$0
10
$82,182
0
$0
0
$0
FILES CLOSED FOR INCOMPLETENESS
0
$0
2
$111,720
0
$0
0
$0
Aggregated Statistics For Year 2002 (Based on 2 partial tracts)
A) FHA, FSA/RHS & VA Home Purchase Loans
B) Conventional Home Purchase Loans
C) Refinancings
D) Home Improvement Loans
F) Non-occupant Loans on < 5 Family Dwellings (A B C & D)
Number
Average Value
Number
Average Value
Number
Average Value
Number
Average Value
Number
Average Value
LOANS ORIGINATED
2
$68,380
6
$93,067
16
$73,298
1
$34,080
3
$75,603
APPLICATIONS APPROVED, NOT ACCEPTED
0
$0
2
$85,635
3
$73,780
0
$0
0
$0
APPLICATIONS DENIED
0
$0
2
$73,850
10
$56,640
2
$18,725
1
$51,340
APPLICATIONS WITHDRAWN
0
$0
0
$0
8
$79,689
1
$10,940
0
$0
FILES CLOSED FOR INCOMPLETENESS
0
$0
0
$0
1
$53,020
0
$0
0
$0
Aggregated Statistics For Year 2001 (Based on 2 partial tracts)
A) FHA, FSA/RHS & VA Home Purchase Loans
B) Conventional Home Purchase Loans
C) Refinancings
D) Home Improvement Loans
F) Non-occupant Loans on < 5 Family Dwellings (A B C & D)
Number
Average Value
Number
Average Value
Number
Average Value
Number
Average Value
Number
Average Value
LOANS ORIGINATED
1
$103,520
4
$99,730
13
$93,579
1
$4,210
2
$102,675
APPLICATIONS APPROVED, NOT ACCEPTED
0
$0
1
$87,950
2
$53,650
0
$0
0
$0
APPLICATIONS DENIED
1
$62,280
5
$64,214
11
$55,622
3
$12,343
0
$0
APPLICATIONS WITHDRAWN
0
$0
3
$147,000
6
$48,673
0
$0
1
$135,920
FILES CLOSED FOR INCOMPLETENESS
0
$0
0
$0
0
$0
0
$0
0
$0
Aggregated Statistics For Year 2000 (Based on 2 partial tracts)
A) FHA, FSA/RHS & VA Home Purchase Loans
B) Conventional Home Purchase Loans
C) Refinancings
D) Home Improvement Loans
F) Non-occupant Loans on < 5 Family Dwellings (A B C & D)
Number
Average Value
Number
Average Value
Number
Average Value
Number
Average Value
Number
Average Value
LOANS ORIGINATED
3
$64,943
9
$80,186
3
$51,900
3
$4,910
1
$135,500
APPLICATIONS APPROVED, NOT ACCEPTED
1
$34,510
2
$45,655
3
$69,010
1
$26,510
0
$0
APPLICATIONS DENIED
1
$116,140
8
$36,346
9
$49,421
4
$12,730
0
$0
APPLICATIONS WITHDRAWN
0
$0
0
$0
3
$45,727
1
$12,620
0
$0
FILES CLOSED FOR INCOMPLETENESS
0
$0
0
$0
2
$79,950
0
$0
0
$0
Aggregated Statistics For Year 1999 (Based on 1 partial tract)
A) FHA, FSA/RHS & VA Home Purchase Loans
B) Conventional Home Purchase Loans
C) Refinancings
D) Home Improvement Loans
F) Non-occupant Loans on < 5 Family Dwellings (A B C & D)


 Nearest zip codes: 84784, 86021, 84763, 84755, 84767, 84737.