Estimated zip code population in 2022: 30,843 Zip code population in 2010: 27,698 Zip code population in 2000: 17,585
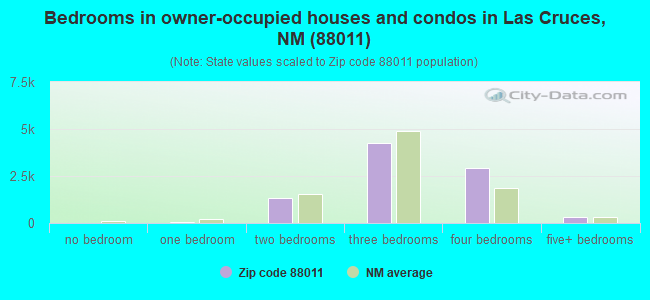
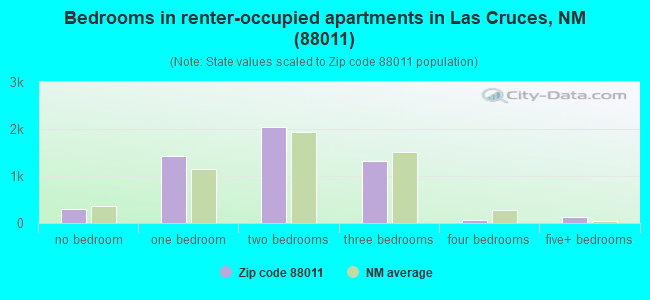
Houses and condos: 14,858 Renter-occupied apartments: 5,246
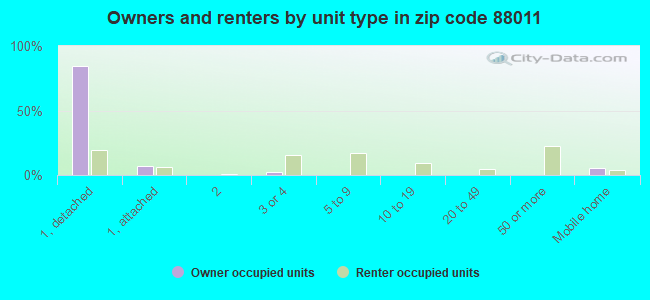
% of renters here:
37%
State:
29%
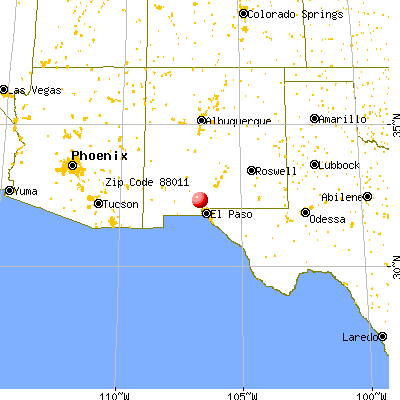
March 2022 cost of living index in zip code 88011: 86.8 (less than average, U.S. average is 100)
Land area: 146.4 sq. mi. Water area: 0.1 sq. mi.
Population density: 211 people per square mile
(very low).
OSM Map
General Map
Google Map
MSN Map
OSM Map
General Map
Google Map
MSN Map
OSM Map
General Map
Google Map
MSN Map
OSM Map
General Map
Google Map
MSN Map
Please wait while loading the map...
Real estate property taxes paid for housing units in 2022:
This zip code:
0.7% ($2,399)
New Mexico:
0.7% ($1,638)
Median real estate property taxes paid for housing units with mortgages in 2022: $2,648 (0.7%) Median real estate property taxes paid for housing units with no mortgage in 2022: $2,037 (0.7%)
Estimated median house/condo value in 2022: $335,275
88011:
$335,275
New Mexico:
$243,100
According to our research of New Mexico and other state lists, there were 16 registered sex offenders living in 88011 zip code as of April 27, 2024. The ratio of all residents to sex offenders in zip code 88011 is 1,868 to 1. The ratio of registered sex offenders to all residents in this zip code is much lower than the state average.
Median resident age:
This zip code:
43.6 years
New Mexico median age:
39.4 years
Average household size:
This zip code:
2.1 people
New Mexico:
2.4 people
Averages for the 2020 tax year for zip code 88011, filed in 2021:
Average Adjusted Gross Income (AGI) in 2020: $77,482 (Individual Income Tax Returns)
Here:
$77,482
State:
$59,146
Salary/wage: $60,891 (reported on 72.1% of returns)
Here:
$60,891
State:
$48,327
(% of AGI for various income ranges: 1114.7% for AGIs below $25k, 3088.9% for AGIs $25k-50k, 5409.1% for AGIs $50k-75k, 7887.0% for AGIs $75k-100k, 15929.8% for AGIs $100k-200k, 70567.1% for AGIs over 200k)
Taxable interest for individuals: $2,155 (reported on 35.4% of returns)
This zip code:
$2,155
New Mexico:
$1,616
(% of AGI for various income ranges: 24.1% for AGIs below $25k, 39.2% for AGIs $25k-50k, 93.2% for AGIs $50k-75k, 122.9% for AGIs $75k-100k, 194.2% for AGIs $100k-200k, 1848.3% for AGIs over 200k)
Ordinary dividends: $6,452 (reported on 23.6% of returns)
Here:
$6,452
State:
$7,816
(% of AGI for various income ranges: 30.4% for AGIs below $25k, 62.3% for AGIs $25k-50k, 145.4% for AGIs $50k-75k, 277.2% for AGIs $75k-100k, 542.6% for AGIs $100k-200k, 3292.5% for AGIs over 200k)
Net capital gain/loss in AGI: +$16,539 (reported on 22.6% of returns)
Here:
+$16,539
State:
+$19,595
(% of AGI for various income ranges: 15.4% for AGIs below $25k, 50.1% for AGIs $25k-50k, 137.5% for AGIs $50k-75k, 356.0% for AGIs $75k-100k, 785.6% for AGIs $100k-200k, 15667.1% for AGIs over 200k)
Profit/loss from business: +$14,504 (reported on 13.9% of returns)
Here:
+$14,504
State:
+$11,430
(% of AGI for various income ranges: 69.1% for AGIs below $25k, 115.0% for AGIs $25k-50k, 191.2% for AGIs $50k-75k, 178.0% for AGIs $75k-100k, 534.2% for AGIs $100k-200k, 5445.8% for AGIs over 200k)
Taxable individual retirement arrangement distribution: $23,403 (reported on 12.5% of returns)
88011:
$23,403
New Mexico:
$20,970
(% of AGI for various income ranges: 56.4% for AGIs below $25k, 156.0% for AGIs $25k-50k, 356.8% for AGIs $50k-75k, 703.0% for AGIs $75k-100k, 1084.0% for AGIs $100k-200k, 4664.6% for AGIs over 200k)
Self-employed (Keogh) retirement plans: $25,883 (reported on 0.4% of returns)
88011:
$25,883
New Mexico:
$20,997
(% of AGI for various income ranges: 42.3% for AGIs $75k-100k, 483.3% for AGIs over 200k)
Total itemized deductions: $33,125 (reported on 9.1% of returns)
Here:
$33,125
State:
$33,187
(% of AGI for various income ranges: 55.4% for AGIs below $25k, 119.0% for AGIs $25k-50k, 280.7% for AGIs $50k-75k, 570.1% for AGIs $75k-100k, 1056.8% for AGIs $100k-200k, 6782.9% for AGIs over 200k)
Charity contributions: $12,987 (reported on 7.3% of returns)
Here:
$12,987
State:
$11,850
(% of AGI for various income ranges: 2.1% for AGIs below $25k, 14.0% for AGIs $25k-50k, 44.9% for AGIs $50k-75k, 122.3% for AGIs $75k-100k, 291.5% for AGIs $100k-200k, 3237.9% for AGIs over 200k)
Taxes paid: $7,336 (reported on 9.1% of returns)
88011:
$7,336
State:
$7,150
(% of AGI for various income ranges: 5.6% for AGIs below $25k, 19.6% for AGIs $25k-50k, 53.0% for AGIs $50k-75k, 136.1% for AGIs $75k-100k, 294.5% for AGIs $100k-200k, 1295.4% for AGIs over 200k)
Earned income credit: $2,178 (reported on 13.2% of returns)
Here:
$2,178
State:
$2,323
(% of AGI for various income ranges: 79.4% for AGIs below $25k, 60.7% for AGIs $25k-50k, 1.3% for AGIs $50k-75k)
Percentage of individuals using paid preparers for their 2020 taxes: 92.9%
Here:
93%
State:
92%
(% for various income ranges: 92.8% for AGIs below $25k, 93.9% for AGIs $25k-50k, 91.8% for AGIs $50k-75k, 91.9% for AGIs $75k-100k, 93.0% for AGIs $100k-200k, 94.1% for AGIs over 200k)
Averages for the 2012 tax year for zip code 88011, filed in 2013:
Average Adjusted Gross Income (AGI) in 2012: $69,332 (Individual Income Tax Returns)
Here:
$69,332
State:
$50,343
Salary/wage: $53,013 (reported on 77.0% of returns)
Here:
$53,013
State:
$41,171
(% of AGI for various income ranges: 74.7% for AGIs below $25k, 67.2% for AGIs $25k-50k, 63.7% for AGIs $50k-75k, 62.9% for AGIs $75k-100k, 64.4% for AGIs $100k-200k, 41.2% for AGIs over 200k)
Taxable interest for individuals: $1,928 (reported on 41.5% of returns)
This zip code:
$1,928
New Mexico:
$1,677
(% of AGI for various income ranges: 1.8% for AGIs below $25k, 1.4% for AGIs $25k-50k, 1.1% for AGIs $50k-75k, 0.8% for AGIs $75k-100k, 1.0% for AGIs $100k-200k, 1.3% for AGIs over 200k)
Ordinary dividends: $5,775 (reported on 25.5% of returns)
Here:
$5,775
State:
$6,939
(% of AGI for various income ranges: 2.5% for AGIs below $25k, 1.8% for AGIs $25k-50k, 2.0% for AGIs $50k-75k, 1.9% for AGIs $75k-100k, 1.8% for AGIs $100k-200k, 2.7% for AGIs over 200k)
Net capital gain/loss in AGI: +$12,033 (reported on 22.2% of returns)
Here:
+$12,033
State:
+$14,311
(% of AGI for various income ranges: 0.8% for AGIs $25k-50k, 0.8% for AGIs $50k-75k, 0.5% for AGIs $75k-100k, 1.5% for AGIs $100k-200k, 11.9% for AGIs over 200k)
Profit/loss from business: +$15,833 (reported on 15.1% of returns)
Here:
+$15,833
State:
+$11,059
(% of AGI for various income ranges: 5.5% for AGIs below $25k, 3.3% for AGIs $25k-50k, 1.9% for AGIs $50k-75k, 2.2% for AGIs $75k-100k, 2.7% for AGIs $100k-200k, 5.3% for AGIs over 200k)
Taxable individual retirement arrangement distribution: $17,291 (reported on 13.9% of returns)
88011:
$17,291
New Mexico:
$15,706
(% of AGI for various income ranges: 3.3% for AGIs below $25k, 3.5% for AGIs $25k-50k, 3.3% for AGIs $50k-75k, 4.4% for AGIs $75k-100k, 4.0% for AGIs $100k-200k, 2.5% for AGIs over 200k)
Self-employment retirement plans: $24,238 (reported on 0.6% of returns)
88011:
$24,238
New Mexico:
$18,209
(% of AGI for various income ranges: 0.2% for AGIs $100k-200k, 0.6% for AGIs over 200k)
Total itemized deductions: $22,784 (18% of AGI, reported on 36.5% of returns)
Here:
$22,784
State:
$21,709
Here:
18.1% of AGI
State:
19.8% of AGI
(% of AGI for various income ranges: 10.6% for AGIs below $25k, 11.5% for AGIs $25k-50k, 12.2% for AGIs $50k-75k, 13.6% for AGIs $75k-100k, 13.9% for AGIs $100k-200k, 9.4% for AGIs over 200k)
Charity contributions: $4,242 (reported on 29.2% of returns)
Here:
$4,242
State:
$4,195
(% of AGI for various income ranges: 0.8% for AGIs below $25k, 1.2% for AGIs $25k-50k, 1.6% for AGIs $50k-75k, 2.1% for AGIs $75k-100k, 2.2% for AGIs $100k-200k, 1.8% for AGIs over 200k)
Taxes paid: $6,818 (reported on 36.3% of returns)
88011:
$6,818
State:
$6,176
(% of AGI for various income ranges: 1.6% for AGIs below $25k, 2.2% for AGIs $25k-50k, 2.8% for AGIs $50k-75k, 3.4% for AGIs $75k-100k, 4.4% for AGIs $100k-200k, 4.0% for AGIs over 200k)
Earned income credit: $2,085 (reported on 14.3% of returns)
Here:
$2,085
State:
$2,311
(% of AGI for various income ranges: 5.6% for AGIs below $25k, 0.8% for AGIs $25k-50k)
Percentage of individuals using paid preparers for their 2012 taxes: 51.3%
Here:
51%
State:
50%
(% for various income ranges: 46.8% for AGIs below $25k, 52.0% for AGIs $25k-50k, 50.8% for AGIs $50k-75k, 50.7% for AGIs $75k-100k, 55.2% for AGIs $100k-200k, 77.1% for AGIs over 200k)
Averages for the 2004 tax year for zip code 88011, filed in 2005:
Average Adjusted Gross Income (AGI) in 2004: $55,123 (Individual Income Tax Returns)
Here:
$55,123
State:
$39,572
Salary/wage: $46,317 (reported on 78.1% of returns)
Here:
$46,317
State:
$34,237
(% of AGI for various income ranges: 111.1% for AGIs below $10k, 69.0% for AGIs $10k-25k, 68.1% for AGIs $25k-50k, 66.7% for AGIs $50k-75k, 68.8% for AGIs $75k-100k, 61.5% for AGIs over 100k)
Taxable interest for individuals: $2,142 (reported on 51.1% of returns)
This zip code:
$2,142
New Mexico:
$1,873
(% of AGI for various income ranges: 7.5% for AGIs below $10k, 3.7% for AGIs $10k-25k, 2.5% for AGIs $25k-50k, 2.0% for AGIs $50k-75k, 1.9% for AGIs $75k-100k, 1.4% for AGIs over 100k)
Taxable dividends: $3,084 (reported on 31.3% of returns)
Here:
$3,084
State:
$3,554
(% of AGI for various income ranges: 6.2% for AGIs below $10k, 2.7% for AGIs $10k-25k, 2.0% for AGIs $25k-50k, 1.9% for AGIs $50k-75k, 1.5% for AGIs $75k-100k, 1.4% for AGIs over 100k)
Net capital gain/loss: +$10,981 (reported on 27.5% of returns)
Here:
+$10,981
State:
+$10,425
(% of AGI for various income ranges: 1.2% for AGIs below $10k, 0.1% for AGIs $10k-25k, 0.9% for AGIs $25k-50k, 1.4% for AGIs $50k-75k, 1.9% for AGIs $75k-100k, 10.5% for AGIs over 100k)
Profit/loss from business: +$14,228 (reported on 15.6% of returns)
Here:
+$14,228
State:
+$8,875
(% of AGI for various income ranges: 0.6% for AGIs below $10k, 4.0% for AGIs $10k-25k, 2.7% for AGIs $25k-50k, 2.2% for AGIs $50k-75k, 3.1% for AGIs $75k-100k, 5.5% for AGIs over 100k)
IRA payment deduction: $3,183 (reported on 3.1% of returns)
88011:
$3,183
New Mexico:
$2,940
(% of AGI for various income ranges: 0.2% for AGIs $10k-25k, 0.3% for AGIs $25k-50k, 0.2% for AGIs $50k-75k, 0.2% for AGIs $75k-100k, 0.1% for AGIs over 100k)
Self-employed pension: $15,895 (reported on 1.1% of returns)
Here:
$15,895
New Mexico:
$13,110
(% of AGI for various income ranges: 0.1% for AGIs $25k-50k, 0.1% for AGIs $50k-75k, 0.3% for AGIs $75k-100k, 0.5% for AGIs over 100k)
Total itemized deductions: $19,027 (19% of AGI, reported on 39.6% of returns)
Here:
$19,027
State:
$18,103
Here:
19.4% of AGI
State:
21.5% of AGI
(% of AGI for various income ranges: 19.2% for AGIs below $10k, 11.2% for AGIs $10k-25k, 12.2% for AGIs $25k-50k, 14.6% for AGIs $50k-75k, 15.4% for AGIs $75k-100k, 13.4% for AGIs over 100k)
Charity contributions deductions: $3,568 (3% of AGI, reported on 34.3% of returns)
Here:
$3,568
State:
$3,246
Here:
3.5% of AGI
State:
3.6% of AGI
(% of AGI for various income ranges: 1.0% for AGIs below $10k, 1.1% for AGIs $10k-25k, 1.7% for AGIs $25k-50k, 2.2% for AGIs $50k-75k, 2.3% for AGIs $75k-100k, 2.5% for AGIs over 100k)
Total tax: $9,292 (reported on 76.9% of returns)
88011:
$9,292
State:
$6,237
(% of AGI for various income ranges: 2.5% for AGIs below $10k, 3.7% for AGIs $10k-25k, 7.2% for AGIs $25k-50k, 9.5% for AGIs $50k-75k, 11.2% for AGIs $75k-100k, 18.2% for AGIs over 100k)
Earned income credit: $1,694 (reported on 12.3% of returns)
Here:
$1,694
State:
$1,796
Percentage of individuals using paid preparers for their 2004 taxes: 56.0%
Here:
56%
State:
57%
(% for various income ranges: 49.2% for AGIs below $10k, 59.5% for AGIs $10k-25k, 56.6% for AGIs $25k-50k, 54.7% for AGIs $50k-75k, 53.2% for AGIs $75k-100k, 63.2% for AGIs over 100k)
Likely homosexual households (counted as self-reported same-sex unmarried-partner households)
Lesbian couples: 0.0% of all households
Gay men: 0.3% of all households
Household received Food Stamps/SNAP in the past 12 months: 1,320 Household did not receive Food Stamps/SNAP in the past 12 months: 12,796
Women who had a birth in the past 12 months: 316 (384 now married, 0 unmarried) Women who did not have a birth in the past 12 months: 6,639 (2,755 now married, 3,867 unmarried)
Housing units in zip code 88011 with a mortgage: 4,959 (431 second mortgage, 239 both second mortgage and home equity loan) Houses without a mortgage: 19
Median monthly owner costs for units with a mortgage: $1,672 Median monthly owner costs for units without a mortgage: $521
Residents with income below the poverty level in 2022:
This zip code:
10.5%
Whole state:
17.6%
Residents with income below 50% of the poverty level in 2022:
This zip code:
4.7%
Whole state:
9.7%
Median number of rooms in houses and condos:
Here:
6.4
State:
5.9
Median number of rooms in apartments:
Here:
4.0
State:
4.2
Notable locations in this zip code not listed on our city pages
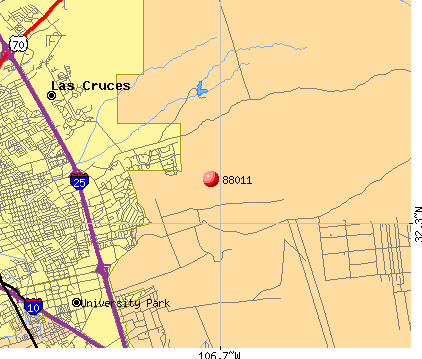
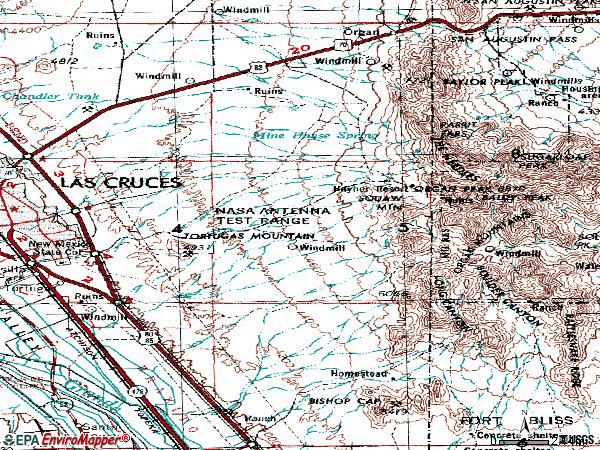
Notable locations in zip code 88011: Rose Well (A), Cordova Well (B), Cox Home Ranch (C), E J Isaacks Ranch (D), Foster Well (E), Hayner Resort (F), Las Cruces Fire Department Station 6 (G), Las Cruces Fire Department Station 5 (H), Las Cruces Fire Department Station 4 (I), Las Alturas Volunteer Fire Department Talavera Substation (J), Las Alturas Fire Department (K), Rehabilitation Hospital of Southern New Mexico (L). Display/hide their locations on the map
Streams, rivers, and creeks: Anvil Creek (A), North Fork Las Cruces Arroyo (B), South Fork Las Cruces Arroyo (C), Sotol Creek (D). Display/hide their locations on the map
4,287 married couples with children.
667 single-parent households (152 men, 515 women).
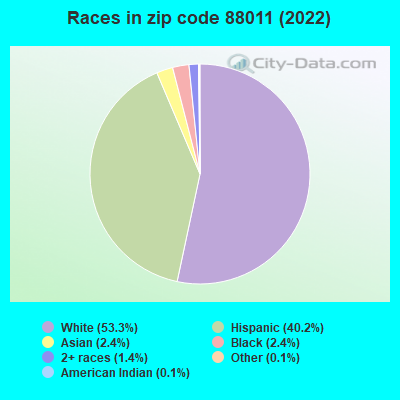
71.9% of residents of 88011 zip code speak English at home.
24.8% of residents speak Spanish at home (77% very well, 17% well, 2% not well, 4% not at all).
2.3% of residents speak other Indo-European language at home (66% very well, 15% well, 18% not well).
0.9% of residents speak Asian or Pacific Island language at home (91% very well, 9% well).
1.4% of residents speak other language at home (100% very well).
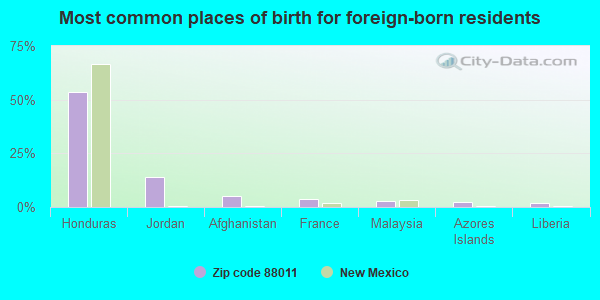
Foreign born population: 3,783 (12.3%) (57.8% of them are naturalized citizens)
Facilities with environmental interests located in this zip code:
ROADRUNNER PLAZA (141 ROAD RUNNER in LAS CRUCES, NM)
ENFORCEMENT/COMPLIANCE ACTIVITY (Integrated Compliance Information System) FORMAL ENFORCEMENT ACTION (Integrated Compliance Information System) National Pollutant Discharge Elimination System NON-MAJOR (Tracking pollutant discharge elimination systems) - permit - ICIS-06-2006-1767, ENFORCEMENT/COMPLIANCE ACTIVITY Business SIC classification: GENERAL CONTRACTORS-NONRESIDENTIAL BUILDINGS, OTHER THAN INDUSTRIAL BUILDINGS AND WAREHOUSES
CAMINO REAL MIDDLE (2961 ROADRUNNER PKW. in LAS CRUCES, NM)
(National Center for Education Statistics) - STATE ID-17131002 Organizations: LAS CRUCES PUBLIC SCHOOLS (SCHOOL DISTRICT)
CERTIFIED CONCRETE PRODUCT, INC. (INTERSTATE HWY 10, EXIT 139, W in LAS CRUCES, NM)
(Integrated Compliance Information System) - ICIS-06-1997-0661, FORMAL ENFORCEMENT ACTION Business SIC classification: BRICK, STONE, AND RELATED CONSTRUCTION MATERIALS
LOVELACE LAS CRUCES CLINIC (2525 S TELSHOR BLVD in LAS CRUCES, NM)
(Resource Conservation and Recovery Act (tracking hazardous waste)) Organizations: LOVELACE HEALTH SYSTEMS (CONTACT/OWNER)
BRIDGES-REEL-SLAGUE FAMILY DOLLAR STORE (745 NORTH VALLEY DRIVE in LAS CRUCES, NM)
AIR MINOR (AIRS/AFS) Business SIC classification: GENERAL CONTRACTORS-NONRESIDENTIAL BUILDINGS, OTHER THAN INDUSTRIAL BUILDINGS AND WAREHOUSES
DANIEL S GUILLEN INC DANIEL S GUILLEN IN (1 MILE NORTH OF VARO in LAS CRUCES, NM)
AIR MINOR (AIRS/AFS) Business SIC classification: CONSTRUCTION SAND AND GRAVEL Alternative names: DANIEL S GUILLEN INCORPORATED ??
LAS CRUCES RADIOLOGY ( in LAS CRUCES, NM)
National Pollutant Discharge Elimination System NON-MAJOR (Tracking pollutant discharge elimination systems) - permit Business SIC classification: GENERAL CONTRACTORS-NONRESIDENTIAL BUILDINGS, OTHER THAN INDUSTRIAL BUILDINGS AND WAREHOUSES Alternative names: TAJ CONSTRUCTION
EMI TECHNOLOGIES INCORPORATED (2200 NORTH TELSHOR BOULEVARD in LAS CRUCES, NM)
Conditionally Exempt Small Quantity Generators, less than 100 kg/month of hazardous waste (Resource Conservation and Recovery Act (tracking hazardous waste)) - notification Organizations: JOSE GALVAREZ (CONTACT/OWNER)
SAMS CLUB #4784 (2711 NORTH TELSHORE BLVD in LAS CRUCES, NM)
Conditionally Exempt Small Quantity Generators, less than 100 kg/month of hazardous waste (Resource Conservation and Recovery Act (tracking hazardous waste)) Organizations: SAMS EAST INC (CONTACT/OWNER)
LAS CRUCES #3 LANDFILL (5555 FOOTHILL ROAD in LAS CRUCES, NM)
CRITERIA AND HAZARDOUS AIR POLLUTANT INVENTORY (Inventory of air pollution sources) Business SIC classification: REFUSE SYSTEMS Business NAICS classification: SOLID WASTE LANDFILL.
Housing units lacking complete plumbing facilities: 0.9% Housing units lacking complete kitchen facilities: 0.9%
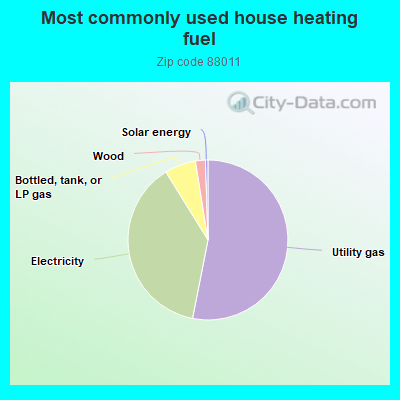
53.0%Utility gas
38.0%Electricity
6.3%Bottled, tank, or LP gas
2.0%Wood
0.5%Solar energy
Place of birth for U.S.-born residents:
This state: 10,835
Northeast: 3,065
Midwest: 3,032
South: 5,560
West: 4,249
42% of the 88011 zip code residents lived in the same house 5 years ago. Out of people who lived in different houses, 46% lived in this county. Out of people who lived in different counties, 50% lived in New Mexico.
88% of the 88011 zip code residents lived in the same house 1 year ago. Out of people who lived in different houses, 35% moved from this county. Out of people who lived in different houses, 18% moved from different county within same state. Out of people who lived in different houses, 48% moved from different state. Out of people who lived in different houses, 3% moved from abroad.
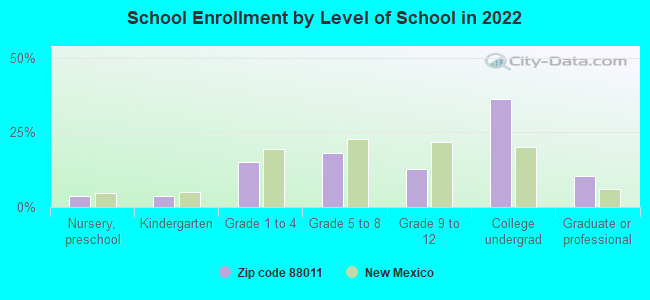
Private vs. public school enrollment:
Students in private schools in grades 1 to 8 (elementary and middle school): 540
Here:
18.5%
New Mexico:
10.2%
Students in private schools in grades 9 to 12 (high school): 44
Here:
4.1%
New Mexico:
10.0%
Students in private undergraduate colleges: 279
Here:
8.8%
New Mexico:
12.3%
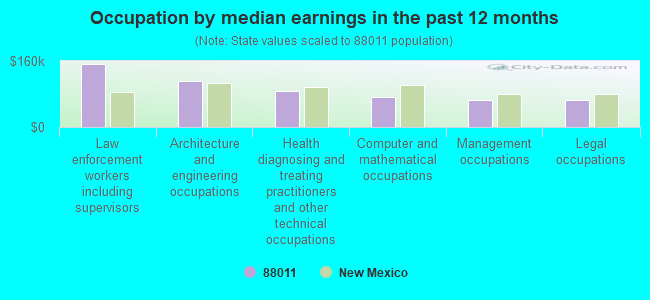
Occupation by median earnings in the past 12 months ($)
152,193Law enforcement workers including supervisors
111,699Architecture and engineering occupations
86,367Health diagnosing and treating practitioners and other technical occupations
71,611Computer and mathematical occupations
65,679Management occupations
64,854Legal occupations
Companies with biggest federal contracts located in this zip code (LAS CRUCES, NM):
EMI TECHNOLOGIES, INC (2200 NORTH TELSHOR BLVD; small business) : $36,634,535 in 73 contractsfrom 2000 to 2006
Contracts for Trucks and Truck Tractors, Wheeled, Trailers, Vehicular Cab, Body, and Frame Structural Components, Miscellaneous Prefabricated Structures, and moreby Army, National Oceanic and Atmospheric Administration/Under Secretary for Oceans and Atmosphere, Department of Defense, Navy, and others Signed by year:2000: $971,121; 2001: $14,500; 2002: $1,352,457; 2003: $24,337,143; 2004: $3,688,877; 2005: $3,339,640; 2006: $2,930,797.
Biggest contracts:
$19,759,552 with Army for Trucks and Truck Tractors, Wheeled. Signed on 2003-04-01. Completion date: 2004-04-30.
$2,956,500, same as above.Signed on 2003-12-18. Completion date: 2004-04-30.
$2,121,000, same as above.Signed on 2004-03-30. Completion date: 2004-04-30.
$1,297,000, same as above.Signed on 2006-07-06. Completion date: 2007-03-30.
R-CON CONSTRUCTION INC (3401 MONTECITO CT; small business) : $9,453,280 in 65 contractsfrom 2002 to 2006
Contracts for Construction of Structures and Facilities -- Office Buildings, Landscaping/Groundskeeping Services, Construction of Structures and Facilities -- Other Industrial Buildings, Maintenance, Repair or Alteration of Real Property -- Other Utilities, and moreby Army, Air Force Signed by year:2000: $0; 2001: $0; 2002: $213,737; 2003: $2,016,886; 2004: $3,002,824; 2005: $4,002,604; 2006: $217,229.
Biggest contracts:
$1,500,000 with Army for Construction of Structures and Facilities -- Office Buildings. Signed on 2004-09-30. Completion date: 2005-07-22.
$853,200 with Air Force for Landscaping/Groundskeeping Services. Taking place in DE. Signed on 2005-10-01. Completion date: 2006-09-30.
$785,016 with Air Force for Landscaping/Groundskeeping Services. Signed on 2005-10-01. Completion date: 2006-09-30.
$785,016, same as above.Signed on 2005-10-01. Completion date: 2006-09-30.
ZIA ENGINEERING & ENVIRONMNETA (755 S TELSHOR BLVD; small business) : $7,532,215 in 114 contractsfrom 2004 to 2006
Contracts for Other Research and Development -- Basic Research (R&D), Other Environmental Services, Studies, and Analytical Support by Army Signed by year:2000: $0; 2001: $0; 2002: $0; 2003: $0; 2004: $3,573,343; 2005: $1,558,930; 2006: $2,399,942.
Biggest contracts:
$2,937,271 with Army for Other Research and Development -- Basic Research (R&D). Signed on 2004-09-30. Completion date: 2009-10-30.
$400,590, same as above.Signed on 2004-09-30. Completion date: 2004-09-30.
$400,590, same as above.Signed on 2004-10-07. Completion date: 2009-09-30.
$261,329, same as above.Signed on 2005-03-16. Completion date: 2004-09-30.
LASEN, INC (300 N TELSHOR, SUITE 600; small business) : $4,737,012 in 10 contractsfrom 2001 to 2004
Contracts for Defense Electronics and Communication Equipment -- Management and Support (R&D), Other Defense -- Applied Research and Exploratory Development (R&D), Other Defense -- Management and Support (R&D) by Air Force, Army Signed by year:2000: $0; 2001: $899,962; 2002: $598,939; 2003: $2,418,368; 2004: $819,743; 2005: $0; 2006: $0.
Biggest contracts:
$1,299,093 with Air Force for Defense Electronics and Communication Equipment -- Management and Support (R&D). Signed on 2003-07-18. Completion date: 2004-10-29.
$599,974, same as above.Signed on 2003-09-18. Completion date: 2005-08-31.
$599,962, same as above.Signed on 2001-05-04. Completion date: 2002-04-30.
$598,939, same as above.Signed on 2002-06-14. Completion date: 2003-04-30.
OAK PLUS INC (315 S TELSHOR BLVD; small business) : $221,028 in 8 contractsfrom 2004 to 2005
Contracts for Office Furniture by Army Signed by year:2000: $0; 2001: $0; 2002: $0; 2003: $0; 2004: $200,531; 2005: $20,497; 2006: $0.
Biggest contracts:
$143,780 with Army for Office Furniture. Signed on 2004-09-23. Completion date: 2004-11-13.
$31,155, same as above.Signed on 2004-08-20. Completion date: 2004-09-11.
$12,100, same as above.Signed on 2005-03-23. Completion date: 2005-04-13.
$9,748, same as above.Signed on 2004-09-24. Completion date: 2004-11-04.
VDP INC (755 S TELSHOR BLVD STE D9; small business) : $169,194 in 9 contractsfrom 2002 to 2005
Contracts for ADP Software, Other ADP and Telecommunications Services (includes data storage on tapes, compact disks, etc.), ADPE System Configuration by Department of Defense, American Forces Information Service, Air Force Signed by year:2000: $0; 2001: $0; 2002: $133,762; 2003: $5,250; 2004: $19,195; 2005: $10,987; 2006: $0.
Biggest contracts:
$80,026 with Department of Defense for ADP Software. Signed on 2002-08-23. Completion date: 2003-09-27.
$36,775, same as above.Signed on 2002-02-22. Completion date: 2003-02-27.
$19,195 with American Forces Information Service for ADP Software. Signed on 2004-01-07. Completion date: 2005-01-06.
$8,400 with Department of Defense for Other ADP and Telecommunications Services (includes data storage on tapes, compact disks, etc.). Signed on 2002-07-12. Completion date: 2002-08-08.
AGEE,WILLIAM (2725 HUNTINGTON DR; small business) : $103,316 in 2 contractsin 2005
$63,316 with Army for ADP Software. Signed on 2005-03-08. Completion date: 2010-03-07.
$40,000, same as above.Signed on 2005-07-26. Completion date: 2010-03-07.
JAMES D KLETT (4507 MOCKINGBIRD ST; small business)
$99,780 with Army for Defense Electronics and Communication Equipment -- Basic Research (R&D). Signed on 2006-03-23. Completion date: 2006-12-31.
WHITE SANDS RESEARCH AND DEVEL (12595 BAYLOR PEAK RD; small business) : $95,562 in 3 contractsfrom 2003 to 2004
$40,000 with Army for Engineering -- Advanced Development (R&D). Signed on 2004-08-12. Completion date: 2005-01-13.
$30,562 with Defense Logistics Agency for Microcircuits, Electronic. Signed on 2003-12-23. Completion date: 2004-05-21.
$25,000 with Army for Defense Missile and Space Systems -- Basic Research (R&D). Signed on 2003-09-15. Completion date: 2003-12-08.
TRAMMEL, JOSEPH L (2864 MORNING STAR DR; small business) : $43,701 in 15 contractsfrom 2003 to 2006
Contracts for Other Professional Services, Chaplain Services by Army Signed by year:2000: $0; 2001: $0; 2002: $0; 2003: $3,925; 2004: $12,862; 2005: $20,044; 2006: $6,870.
Biggest contracts:
$15,475 with Army for Other Professional Services. Signed on 2003-10-22. Completion date: 2004-09-30.
$12,097, same as above.Signed on 2005-05-18. Completion date: 2005-09-30.
$8,400 with Army for Chaplain Services. Signed on 2006-03-10. Completion date: 2006-09-30.
$7,625 with Army for Other Professional Services. Signed on 2004-03-15. Completion date: 2004-09-30.
Top industries in this zip code by the number of employees in 2005:
Health Care and Social Assistance: General Medical and Surgical Hospitals (over 1000 employees: 1 establishment, 500-999 employees: 1 establishment)
Health Care and Social Assistance: Offices of Physicians (except Mental Health Specialists) (50-99: 1, 20-49: 8, 10-19: 12, 5-9: 26, 1-4: 35)
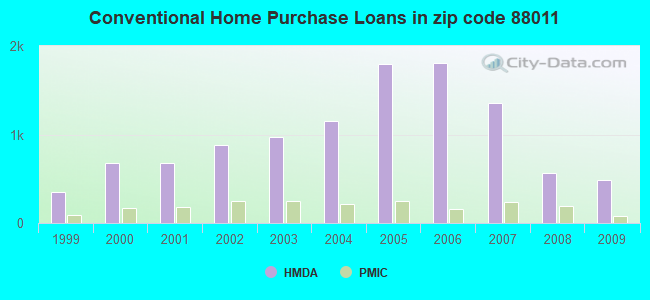
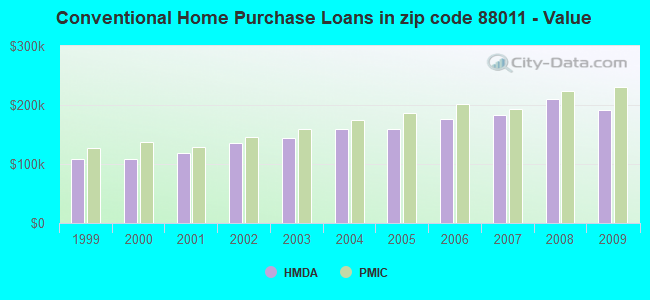
Detailed PMIC statistics for the following Tracts:0012.01
, 0012.02
2008 - 2018 National Fire Incident Reporting System (NFIRS) incidents
According to the data from the years 2008 - 2018 the average number of fires per year is 43. The highest number of reported fire incidents - 62 took place in 2015, and the least - 31 in 2017. The data has a growing trend.
When looking into fire subcategories, the most reports belonged to: Outside Fires (56.1%), and Structure Fires (23.9%).
Fire incident types reported to NFIRS in Zip Code 88011


 Nearest zip codes: 88003, 88001, 88052, 88047, 88048, 88046.


 According to the data from the years 2008 - 2018 the average number of fires per year is 43. The highest number of reported fire incidents - 62 took place in 2015, and the least - 31 in 2017. The data has a growing trend.
 When looking into fire subcategories, the most reports belonged to: Outside Fires (56.1%), and Structure Fires (23.9%).