Estimated zip code population in 2022: 28,714 Zip code population in 2010: 25,574 Zip code population in 2000: 23,900
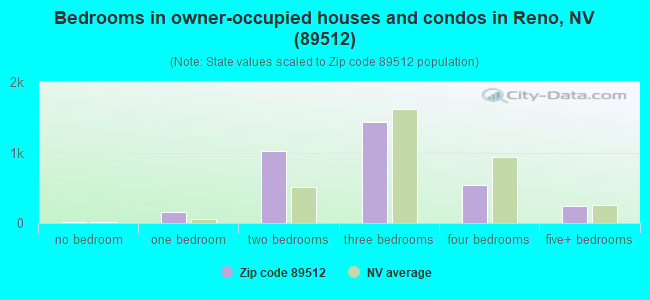
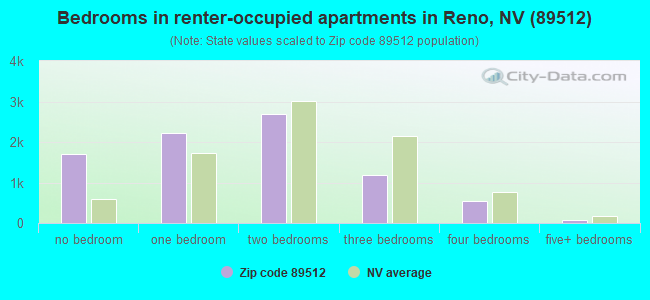
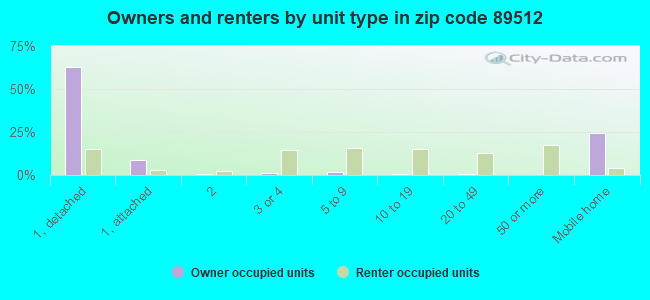
Houses and condos: 12,749 Renter-occupied apartments: 8,223
% of renters here:
71%
State:
40%
March 2022 cost of living index in zip code 89512: 98.3 (near average, U.S. average is 100)
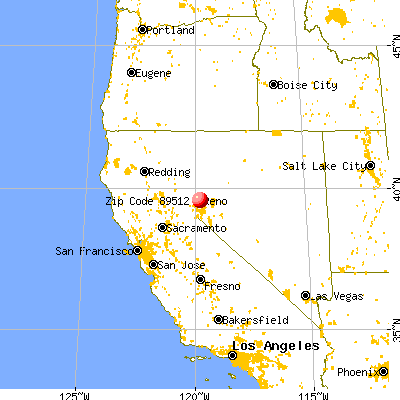
Land area: 6.3 sq. mi. Water area: 0.0 sq. mi.
Population density: 4,556 people per square mile
(average).
OSM Map
General Map
Google Map
MSN Map
OSM Map
General Map
Google Map
MSN Map
OSM Map
General Map
Google Map
MSN Map
OSM Map
General Map
Google Map
MSN Map
Please wait while loading the map...
Real estate property taxes paid for housing units in 2022:
This zip code:
0.3% ($1,086)
Nevada:
0.4% ($1,889)
Median real estate property taxes paid for housing units with mortgages in 2022: $1,357 (0.4%) Median real estate property taxes paid for housing units with no mortgage in 2022: $788 (0.3%)
Averages for the 2020 tax year for zip code 89512, filed in 2021:
Average Adjusted Gross Income (AGI) in 2020: $38,470 (Individual Income Tax Returns)
Here:
$38,470
State:
$78,964
Salary/wage: $33,957 (reported on 90.3% of returns)
Here:
$33,957
State:
$54,472
(% of AGI for various income ranges: 1286.5% for AGIs below $25k, 3798.6% for AGIs $25k-50k, 6761.9% for AGIs $50k-75k, 10519.8% for AGIs $75k-100k, 16020.0% for AGIs $100k-200k)
Taxable interest for individuals: $1,055 (reported on 10.7% of returns)
This zip code:
$1,055
Nevada:
$3,521
(% of AGI for various income ranges: 4.6% for AGIs below $25k, 2.6% for AGIs $25k-50k, 17.8% for AGIs $50k-75k, 19.3% for AGIs $75k-100k, 157.6% for AGIs $100k-200k)
Ordinary dividends: $3,075 (reported on 6.1% of returns)
Here:
$3,075
State:
$13,390
(% of AGI for various income ranges: 5.9% for AGIs below $25k, 3.9% for AGIs $25k-50k, 23.5% for AGIs $50k-75k, 78.3% for AGIs $75k-100k, 235.5% for AGIs $100k-200k)
Net capital gain/loss in AGI: +$13,595 (reported on 6.7% of returns)
Here:
+$13,595
State:
+$63,025
(% of AGI for various income ranges: 3.1% for AGIs below $25k, 4.6% for AGIs $25k-50k, 39.6% for AGIs $50k-75k, 156.2% for AGIs $75k-100k, 813.4% for AGIs $100k-200k)
Profit/loss from business: +$9,478 (reported on 8.7% of returns)
Here:
+$9,478
State:
+$11,500
(% of AGI for various income ranges: 65.2% for AGIs below $25k, 72.0% for AGIs $25k-50k, 106.4% for AGIs $50k-75k, 253.8% for AGIs $75k-100k, 876.9% for AGIs $100k-200k)
Taxable individual retirement arrangement distribution: $13,821 (reported on 2.7% of returns)
89512:
$13,821
Nevada:
$23,628
(% of AGI for various income ranges: 11.6% for AGIs below $25k, 18.8% for AGIs $25k-50k, 58.5% for AGIs $50k-75k, 157.9% for AGIs $75k-100k, 698.3% for AGIs $100k-200k)
Total itemized deductions: $29,215 (reported on 2.1% of returns)
Here:
$29,215
State:
$44,173
(% of AGI for various income ranges: 10.8% for AGIs below $25k, 30.4% for AGIs $25k-50k, 135.6% for AGIs $50k-75k, 257.4% for AGIs $75k-100k, 659.7% for AGIs $100k-200k)
Charity contributions: $5,147 (reported on 1.2% of returns)
Here:
$5,147
State:
$12,589
(% of AGI for various income ranges: 1.3% for AGIs $25k-50k, 13.1% for AGIs $50k-75k, 36.7% for AGIs $75k-100k, 140.0% for AGIs $100k-200k)
Taxes paid: $4,208 (reported on 2.0% of returns)
89512:
$4,208
State:
$6,112
(% of AGI for various income ranges: 5.2% for AGIs $25k-50k, 18.3% for AGIs $50k-75k, 40.7% for AGIs $75k-100k, 103.4% for AGIs $100k-200k)
Earned income credit: $2,170 (reported on 22.9% of returns)
Here:
$2,170
State:
$2,214
(% of AGI for various income ranges: 92.5% for AGIs below $25k, 66.4% for AGIs $25k-50k, 1.7% for AGIs $50k-75k)
Percentage of individuals using paid preparers for their 2020 taxes: 93.7%
Here:
94%
State:
93%
(% for various income ranges: 92.8% for AGIs below $25k, 94.8% for AGIs $25k-50k, 93.5% for AGIs $50k-75k, 95.2% for AGIs $75k-100k, 92.2% for AGIs $100k-200k, 100.0% for AGIs over 200k)
Averages for the 2012 tax year for zip code 89512, filed in 2013:
Average Adjusted Gross Income (AGI) in 2012: $30,172 (Individual Income Tax Returns)
Here:
$30,172
State:
$61,164
Salary/wage: $25,552 (reported on 88.4% of returns)
Here:
$25,552
State:
$45,924
(% of AGI for various income ranges: 83.5% for AGIs below $25k, 85.9% for AGIs $25k-50k, 78.1% for AGIs $50k-75k, 71.3% for AGIs $75k-100k, 68.7% for AGIs $100k-200k, 22.3% for AGIs over 200k)
Taxable interest for individuals: $894 (reported on 11.7% of returns)
This zip code:
$894
Nevada:
$3,137
(% of AGI for various income ranges: 0.3% for AGIs below $25k, 0.2% for AGIs $25k-50k, 0.4% for AGIs $50k-75k, 0.5% for AGIs $75k-100k, 0.8% for AGIs $100k-200k, 0.3% for AGIs over 200k)
Ordinary dividends: $6,539 (reported on 6.9% of returns)
Here:
$6,539
State:
$11,762
(% of AGI for various income ranges: 2.5% for AGIs below $25k, 1.1% for AGIs $25k-50k, 1.0% for AGIs $50k-75k, 0.9% for AGIs $75k-100k, 1.5% for AGIs $100k-200k, 1.2% for AGIs over 200k)
Net capital gain/loss in AGI: +$20,104 (reported on 5.0% of returns)
Here:
+$20,104
State:
+$33,127
(% of AGI for various income ranges: 0.2% for AGIs below $25k, 0.2% for AGIs $25k-50k, 0.7% for AGIs $50k-75k, 1.0% for AGIs $75k-100k, 2.2% for AGIs $100k-200k, 27.8% for AGIs over 200k)
Profit/loss from business: +$7,860 (reported on 8.4% of returns)
Here:
+$7,860
State:
+$12,567
(% of AGI for various income ranges: 3.9% for AGIs below $25k, 1.3% for AGIs $25k-50k, 1.3% for AGIs $50k-75k, 2.3% for AGIs $75k-100k, 4.5% for AGIs $100k-200k)
Taxable individual retirement arrangement distribution: $12,295 (reported on 3.9% of returns)
89512:
$12,295
Nevada:
$20,808
(% of AGI for various income ranges: 1.0% for AGIs below $25k, 1.0% for AGIs $25k-50k, 2.0% for AGIs $50k-75k, 3.3% for AGIs $75k-100k, 5.2% for AGIs $100k-200k)
Total itemized deductions: $18,309 (21% of AGI, reported on 9.1% of returns)
Here:
$18,309
State:
$26,148
Here:
21.4% of AGI
State:
20.0% of AGI
(% of AGI for various income ranges: 2.6% for AGIs below $25k, 4.3% for AGIs $25k-50k, 7.0% for AGIs $50k-75k, 10.3% for AGIs $75k-100k, 11.4% for AGIs $100k-200k, 6.0% for AGIs over 200k)
Charity contributions: $2,292 (reported on 6.3% of returns)
Here:
$2,292
State:
$4,329
(% of AGI for various income ranges: 0.2% for AGIs below $25k, 0.4% for AGIs $25k-50k, 0.6% for AGIs $50k-75k, 0.9% for AGIs $75k-100k, 1.6% for AGIs $100k-200k)
Taxes paid: $3,133 (reported on 8.9% of returns)
89512:
$3,133
State:
$5,116
(% of AGI for various income ranges: 0.4% for AGIs below $25k, 0.6% for AGIs $25k-50k, 1.2% for AGIs $50k-75k, 1.9% for AGIs $75k-100k, 2.2% for AGIs $100k-200k, 0.9% for AGIs over 200k)
Earned income credit: $2,380 (reported on 30.7% of returns)
Here:
$2,380
State:
$2,279
(% of AGI for various income ranges: 7.3% for AGIs below $25k, 1.7% for AGIs $25k-50k)
Percentage of individuals using paid preparers for their 2012 taxes: 49.7%
Here:
50%
State:
55%
(% for various income ranges: 47.6% for AGIs below $25k, 52.2% for AGIs $25k-50k, 54.7% for AGIs $50k-75k, 53.3% for AGIs $75k-100k, 47.4% for AGIs $100k-200k, 75.0% for AGIs over 200k)
Averages for the 2004 tax year for zip code 89512, filed in 2005:
Average Adjusted Gross Income (AGI) in 2004: $28,001 (Individual Income Tax Returns)
Here:
$28,001
State:
$58,367
Salary/wage: $25,156 (reported on 90.6% of returns)
Here:
$25,156
State:
$42,695
(% of AGI for various income ranges: 98.7% for AGIs below $10k, 89.6% for AGIs $10k-25k, 88.3% for AGIs $25k-50k, 81.9% for AGIs $50k-75k, 74.2% for AGIs $75k-100k, 48.4% for AGIs over 100k)
Taxable interest for individuals: $1,361 (reported on 18.2% of returns)
This zip code:
$1,361
Nevada:
$3,867
(% of AGI for various income ranges: 3.8% for AGIs below $10k, 0.7% for AGIs $10k-25k, 0.6% for AGIs $25k-50k, 0.6% for AGIs $50k-75k, 1.4% for AGIs $75k-100k, 1.2% for AGIs over 100k)
Taxable dividends: $2,339 (reported on 8.6% of returns)
Here:
$2,339
State:
$5,770
(% of AGI for various income ranges: 1.7% for AGIs below $10k, 0.4% for AGIs $10k-25k, 0.4% for AGIs $25k-50k, 0.5% for AGIs $50k-75k, 0.5% for AGIs $75k-100k, 2.3% for AGIs over 100k)
Net capital gain/loss: +$8,756 (reported on 7.5% of returns)
Here:
+$8,756
State:
+$50,644
(% of AGI for various income ranges: -0.7% for AGIs below $10k, 0.1% for AGIs $10k-25k, 0.3% for AGIs $25k-50k, 0.9% for AGIs $50k-75k, 1.6% for AGIs $75k-100k, 14.5% for AGIs over 100k)
Profit/loss from business: +$6,678 (reported on 6.9% of returns)
Here:
+$6,678
State:
+$13,618
(% of AGI for various income ranges: 1.7% for AGIs below $10k, 1.4% for AGIs $10k-25k, 1.4% for AGIs $25k-50k, 2.0% for AGIs $50k-75k, 3.2% for AGIs $75k-100k, 1.4% for AGIs over 100k)
IRA payment deduction: $2,023 (reported on 1.4% of returns)
89512:
$2,023
Nevada:
$3,054
(% of AGI for various income ranges: 0.1% for AGIs $10k-25k, 0.1% for AGIs $25k-50k, 0.2% for AGIs $50k-75k, 0.2% for AGIs $75k-100k)
Self-employed pension: $4,417 (reported on 0.1% of returns)
Here:
$4,417
Nevada:
$16,706
Total itemized deductions: $15,769 (27% of AGI, reported on 14.8% of returns)
Here:
$15,769
State:
$22,990
Here:
26.9% of AGI
State:
21.8% of AGI
(% of AGI for various income ranges: 7.3% for AGIs below $10k, 4.1% for AGIs $10k-25k, 6.8% for AGIs $25k-50k, 11.6% for AGIs $50k-75k, 14.1% for AGIs $75k-100k, 12.5% for AGIs over 100k)
Charity contributions deductions: $1,898 (3% of AGI, reported on 11.7% of returns)
Here:
$1,898
State:
$3,443
Here:
3.1% of AGI
State:
3.1% of AGI
(% of AGI for various income ranges: 0.3% for AGIs below $10k, 0.3% for AGIs $10k-25k, 0.6% for AGIs $25k-50k, 1.0% for AGIs $50k-75k, 1.3% for AGIs $75k-100k, 1.7% for AGIs over 100k)
Total tax: $3,408 (reported on 64.3% of returns)
89512:
$3,408
State:
$10,585
(% of AGI for various income ranges: 1.7% for AGIs below $10k, 3.5% for AGIs $10k-25k, 6.0% for AGIs $25k-50k, 8.9% for AGIs $50k-75k, 11.6% for AGIs $75k-100k, 18.5% for AGIs over 100k)
Earned income credit: $1,733 (reported on 25.7% of returns)
Here:
$1,733
State:
$1,676
Percentage of individuals using paid preparers for their 2004 taxes: 61.3%
Here:
61%
State:
60%
(% for various income ranges: 55.7% for AGIs below $10k, 63.4% for AGIs $10k-25k, 63.0% for AGIs $25k-50k, 60.2% for AGIs $50k-75k, 57.6% for AGIs $75k-100k, 66.1% for AGIs over 100k)
Likely homosexual households (counted as self-reported same-sex unmarried-partner households)
Lesbian couples: 0.2% of all households
Gay men: 0.1% of all households
Household received Food Stamps/SNAP in the past 12 months: 3,572 Household did not receive Food Stamps/SNAP in the past 12 months: 8,557
Women who had a birth in the past 12 months: 422 (132 now married, 240 unmarried) Women who did not have a birth in the past 12 months: 6,620 (1,493 now married, 5,172 unmarried)
Housing units in zip code 89512 with a mortgage: 1,708 (30 second mortgage, 32 both second mortgage and home equity loan) Houses without a mortgage: 17
Median monthly owner costs for units with a mortgage: $1,316 Median monthly owner costs for units without a mortgage: $436
Residents with income below the poverty level in 2022:
This zip code:
20.8%
Whole state:
12.5%
Residents with income below 50% of the poverty level in 2022:
This zip code:
8.5%
Whole state:
5.9%
Median number of rooms in houses and condos:
Here:
5.2
State:
6.0
Median number of rooms in apartments:
Here:
3.7
State:
4.2
Notable locations in this zip code not listed on our city pages
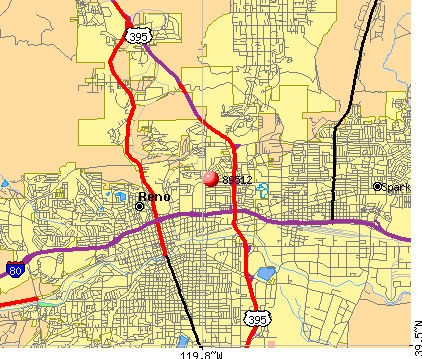
Notable locations in zip code 89512: State Highway Maintenance Shops (A), Desert Research Institute (B), University of Nevada Experimental Farm (C), Reno Fire Department Station 2 (D), Reno Fire Department Station 1 (E), United States Bureau of Mines (F). Display/hide their locations on the map
Shopping Centers: Sterling Village Shopping Center (1), University Village East Shopping Center (2), Oddie Mall (3). Display/hide their locations on the map
Parks in zip code 89512 include: Taylor Memorial Park (1), Baker Park (2), Paradise Park (3), Fishermans Park (4), Governors Bowl Park (5). Display/hide their locations on the map
Tourist attraction (not listed on the city page) : Washoe County - Libraries-Public- Senior Center (Cultural Attractions- Events- & Facilities; 1155 East 9th Street).
1,446 married couples with children.
2,885 single-parent households (485 men, 2,400 women).
64.8% of residents of 89512 zip code speak English at home.
26.3% of residents speak Spanish at home (66% very well, 13% well, 15% not well, 5% not at all).
2.1% of residents speak other Indo-European language at home (60% very well, 39% well, 1% not well).
5.4% of residents speak Asian or Pacific Island language at home (76% very well, 20% well, 3% not well).
1.4% of residents speak other language at home (71% very well, 29% not well).
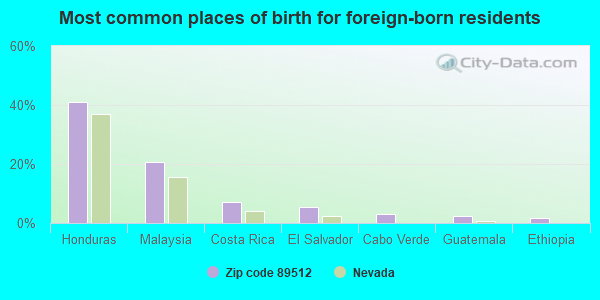
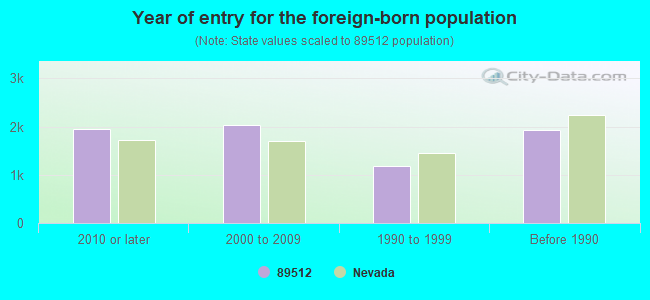
Foreign born population: 6,100 (21.2%) (32.2% of them are naturalized citizens)
Major facilities with environmental interests located in this zip code:
CRUMRINE MANUFACTURING (145 CATRON DR. in RENO, NV)
CRITERIA AND HAZARDOUS AIR POLLUTANT INVENTORY (Inventory of air pollution sources) HAZARDOUS WASTE BIENNIAL REPORTER (Resource Conservation and Recovery Act (tracking hazardous waste)) - ICIS-, ENFORCEMENT/COMPLIANCE ACTIVITY Large Quantity Generators, more that 1000 kg of hazardous waste/month (Resource Conservation and Recovery Act (tracking hazardous waste)) - notification - ICIS-, ENFORCEMENT/COMPLIANCE ACTIVITY TRI REPORTER (Tracking of toxic chemicals releasing facilities) Business SIC classification: JEWELRY, PRECIOUS METAL Business NAICS classification: ALL OTHER MISCELLANEOUS FABRICATED METAL PRODUCT MANUFACTURING.; JEWELRY (EXCEPT COSTUME) MANUFACTURING.; JEWELRY (EXCEPT COSTUME) MANUFACTURING.; FASTENER, BUTTON, NEEDLE, AND PIN MANUFACTURING. Alternative names: CRUMRINE MFG JEWELERS
ALLIED WASHOE PETROLEUM (2500 EAST 4TH STREET in RENO, NV)
STATE MASTER (NV-FP) - STORMWATER-ISW-50, NPDES STORMWATER PERMIT HAZARDOUS WASTE BIENNIAL REPORTER (Resource Conservation and Recovery Act (tracking hazardous waste)) (Resource Conservation and Recovery Act (tracking hazardous waste)) Organizations: ALLIED PETROLEUM CO (CONTACT/OWNER)
Alternative names: ALLIED PETROLEUM, ALLIED PETROLEUM WASHOE, TRUCKEE RIVER
CITILIFT PARATRANSIT MAINTENANCE FACILITY (600 SUTRO in RENO, NV)
STATE MASTER (NV-FP) - STORMWATER-ISW-258, NPDES STORMWATER PERMIT (Resource Conservation and Recovery Act (tracking hazardous waste)) Organizations: REGIONAL TRANSPORTATION COMMUNITY (CONTACT/OWNER)
, REGIONAL TRANSPORTATION COMMISSION (CONTACT/OWNER)
Alternative names: TRUCKEE RIVER
DESERT RESEARCH INSTITUTE, NNSC (7010 DANDINI BLVD in RENO, NV)
Small Quantity Generators, between 100 kg and 1000 kg of hazardous waste/month (Resource Conservation and Recovery Act (tracking hazardous waste)) - ICIS-, ENFORCEMENT/COMPLIANCE ACTIVITY Organizations: DESERT RESEARCH INSTITIURE NNSC (CONTACT/OPERATOR)
, UNIV AND COMMUNITY COLLEGE OF N V SYS (CONTACT/OWNER)
, BOARD OF REGENTS NSHE (CONTACT/OWNER)
MARTIN IRON WORKS (530 E. 4TH ST. in RENO, NV)
CRITERIA AND HAZARDOUS AIR POLLUTANT INVENTORY (Inventory of air pollution sources) STATE MASTER (NV-FP) - STORMWATER-ISW-110, NPDES STORMWATER PERMIT TRI REPORTER (Tracking of toxic chemicals releasing facilities) Business SIC classification: FABRICATED STRUCTURAL METAL Organizations: MARTIN IRON WORKS INC (CONTACT/OWNER)
Alternative names: TRUCKEE RIVER
HUG, PROCTOR HS (2880 SUTRO in RENO, NV)
(National Center for Education Statistics) - STATE ID-16-504 Conditionally Exempt Small Quantity Generators, less than 100 kg/month of hazardous waste (Resource Conservation and Recovery Act (tracking hazardous waste)) - notification Organizations: WASHOE CO SCHOOL DIST (CONTACT/OWNER)
, WASHOE CO SCH DIST (SCHOOL DISTRICT)
Alternative names: HUG HIGH SCHOOL
CANNAN, RITA ELEM (2450 CANNAN STREET in RENO, NV)
(National Center for Education Statistics) - STATE ID-16-214 Organizations: WASHOE CO SCH DIST (SCHOOL DISTRICT)
SIERRA VISTA ELEM (2001 GETTO DRIVE in RENO, NV)
(National Center for Education Statistics) - STATE ID-16-217 Organizations: WASHOE CO SCH DIST (SCHOOL DISTRICT)
SIERRA STRIPERS & ASPHALT PAINTING INC (296 PARR BLVD in RENO, NV)
(Resource Conservation and Recovery Act (tracking hazardous waste)) Organizations: J & S PAINTING (CONTACT/OPERATOR)
, SIERRA STRIPERS & ASPHALT PAVING (CONTACT/OPERATOR)
, PAUL MACDONALD (CONTACT/OWNER)
, JACK GERRARD (CONTACT/OWNER)
, SMITH BROTHERS INVESTMENTS LLC (CONTACT/OWNER)
Alternative names: NEVADA HIGH REACH EQPT CO
MATHEWS, BERNICE ELEM (2750 ELEMENTARY DRIVE in RENO, NV)
(National Center for Education Statistics) - STATE ID-16-273 Organizations: WASHOE CO SCH DIST (SCHOOL DISTRICT)
DUNCAN, GLENN ELEM (1200 MONTELLO STREET in RENO, NV)
(National Center for Education Statistics) - STATE ID-16-204 Organizations: WASHOE CO SCH DIST (SCHOOL DISTRICT)
HIGHLAND WWTP (1502 WASHINGTON ST in RENO, NV)
National Pollutant Discharge Elimination System NON-MAJOR (Tracking pollutant discharge elimination systems) - permit Conditionally Exempt Small Quantity Generators, less than 100 kg/month of hazardous waste (Resource Conservation and Recovery Act (tracking hazardous waste)) - notification Business SIC classification: WATER SUPPLY Organizations: SIERRA PACIFIC POWER CO (CONTACT/OWNER)
, WASHOE COUNTY (CONTACT/OWNER)
Alternative names: SIERRA PACIFIC POWER, WASHOE COUNTY PARKS & REC
GEOBIOTICS (1605 EVANS AVE in RENO, NV) . Federal Facility. DEPARTMENT OF INTERIOR
(Resource Conservation and Recovery Act (tracking hazardous waste)) HAZARDOUS WASTE BIENNIAL REPORTER (Resource Conservation and Recovery Act (tracking hazardous waste)) Large Quantity Generators, more that 1000 kg of hazardous waste/month (Resource Conservation and Recovery Act (tracking hazardous waste)) Organizations: STATE OF NEVADA (CONTACT/OPERATOR)
, UNIVERSITY OF NEVADA RENO (CONTACT/OWNER)
Alternative names: UNIVERSITY OF NEVADA RENO MAIN CAMPUS
Housing units lacking complete plumbing facilities: 1.5% Housing units lacking complete kitchen facilities: 3.9%
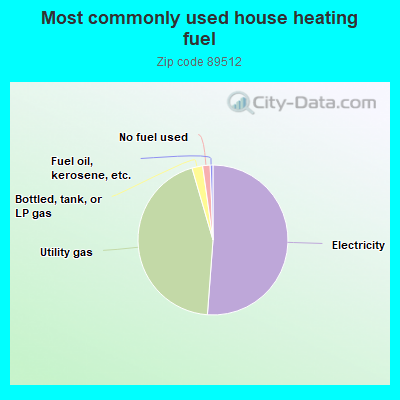
51.1%Electricity
44.2%Utility gas
2.3%Bottled, tank, or LP gas
1.6%No fuel used
0.6%Fuel oil, kerosene, etc.
Population in 1990: 21,009. Population change in the 1990s: +2,891 (+13.8%).
Place of birth for U.S.-born residents:
This state: 8,888
Northeast: 1,074
Midwest: 1,216
South: 1,406
West: 9,171
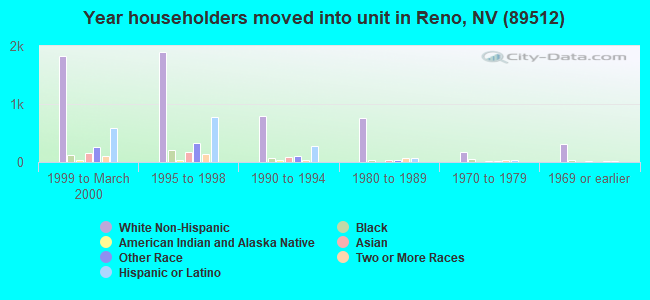
38% of the 89512 zip code residents lived in the same house 5 years ago. Out of people who lived in different houses, 60% lived in this county. Out of people who lived in different counties, 50% lived in Nevada.
79% of the 89512 zip code residents lived in the same house 1 year ago. Out of people who lived in different houses, 48% moved from this county. Out of people who lived in different houses, 18% moved from different county within same state. Out of people who lived in different houses, 25% moved from different state. Out of people who lived in different houses, 5% moved from abroad.
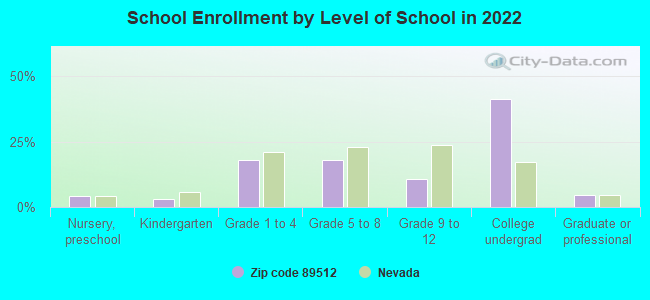
Private vs. public school enrollment:
Students in private schools in grades 1 to 8 (elementary and middle school): 128
Here:
5.3%
Nevada:
12.9%
Students in private schools in grades 9 to 12 (high school): 45
Here:
6.2%
Nevada:
6.9%
Students in private undergraduate colleges: 369
Here:
12.9%
Nevada:
16.0%
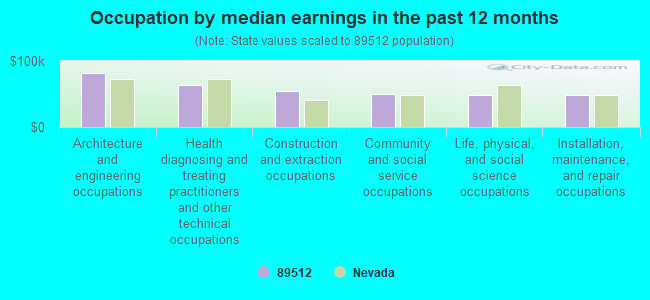
Occupation by median earnings in the past 12 months ($)
81,583Architecture and engineering occupations
64,327Health diagnosing and treating practitioners and other technical occupations
54,579Construction and extraction occupations
49,317Community and social service occupations
48,476Life, physical, and social science occupations
47,865Installation, maintenance, and repair occupations
Companies with biggest federal contracts located in this zip code (RENO, NV):
U S ORDNANCE INC (2500 VALLEY RD SUITE Z; small business) : $17,593,910 in 18 contractsfrom 2001 to 2006
Contracts for Guns, through 30 mm, Guns, over 125 mm through 150 mm by Army, Defense Logistics Agency, Navy Signed by year:2000: $0; 2001: $261,061; 2002: $62,667; 2003: $0; 2004: $2,784,186; 2005: $13,382,989; 2006: $1,103,007.
Biggest contracts:
$7,507,840 with Army for Guns, through 30 mm. Signed on 2005-02-09. Completion date: 2006-01-30.
$5,469,200, same as above.Signed on 2005-06-30. Completion date: 2005-12-20.
$2,371,266, same as above.Signed on 2004-11-22. Completion date: 2004-11-30.
$1,075,238, same as above.Signed on 2006-05-10. Completion date: 2006-10-31.
CONCENTRA MEDICAL CENTER (1530 E 6TH ST) : $596,982 in 11 contractsfrom 2001 to 2005
Contracts for Other Medical Services by Army Signed by year:2000: $0; 2001: $25,650; 2002: $126,800; 2003: $49,385; 2004: $179,082; 2005: $216,065; 2006: $0.
Biggest contracts:
$191,848 with Army for Other Medical Services. Taking place in WA. Signed on 2005-12-20. Completion date: 2006-09-30.
$179,712 with Army for Other Medical Services. Signed on 2004-10-04. Completion date: 2005-09-30.
$75,400, same as above.Signed on 2003-10-16. Completion date: 2005-09-30.
$72,800 with Army for Other Medical Services. Taking place in CA. Signed on 2002-10-17. Completion date: 2005-09-30.
GARDNER MECHANICAL SERVICES IN (270 E PARR BLVD; small business) : $279,888 in 6 contractsfrom 2000 to 2005
Contracts for Maintenance, Repair or Alteration of Real Property -- Office Buildings, Maintenance, Repair or Alteration of Real Property -- Maintenance Buildings, Air Conditioning Equipment, Refrigeration and Air Conditioning Components, and moreby Army Signed by year:2000: $195,877; 2001: $0; 2002: $0; 2003: $0; 2004: $23,392; 2005: $60,619; 2006: $0.
Biggest contracts:
$84,670 with Army for Maintenance, Repair or Alteration of Real Property -- Office Buildings. Taking place in CA. Signed on 2000-06-28. Completion date: 2000-09-26.
$72,407 with Army for Maintenance, Repair or Alteration of Real Property -- Maintenance Buildings. Taking place in CA. Signed on 2000-08-02. Completion date: 2000-09-30.
$60,619 with Army for Air Conditioning Equipment. Signed on 2005-08-18. Completion date: 2005-09-30.
$38,800 with Army for Maintenance, Repair or Alteration of Real Property -- Office Buildings. Taking place in CA. Signed on 2000-02-22. Completion date: 2000-04-23.
D&D TIRE, INC (1250 E 6TH STREET; small business) : $238,879 in 32 contractsfrom 2002 to 2006
Contracts for Tires and Tubes, Pneumatic, Except Aircraft, Tire Rebuilding and Tire and Tube Repair Materials, Rubber Fabricated Materials, Other Housekeeping Services, and moreby Army Signed by year:2000: $0; 2001: $0; 2002: $50,775; 2003: $52,151; 2004: $40,745; 2005: $51,832; 2006: $43,376.
Biggest contracts:
$44,730 with Army for Tires and Tubes, Pneumatic, Except Aircraft. Signed on 2002-12-19. Completion date: 2003-01-18.
$13,708, same as above.Signed on 2005-08-30. Completion date: 2005-09-26.
$11,248 with Army for Tire Rebuilding and Tire and Tube Repair Materials. Signed on 2004-06-21. Completion date: 2004-07-28.
$10,411 with Army for Tires and Tubes, Pneumatic, Except Aircraft. Signed on 2003-12-23. Completion date: 2004-01-16.
RENO WINDUSTRIAL CO (495 VALLEY ROAD; small business)
$63,923 with Army for Hose, Pipe, Tube, Lubrication, and Railing Fittings. Signed on 2000-10-23. Completion date: 2000-11-17.
ALSCO INC (2535 E 5TH ST) : $52,674 in 5 contractsfrom 2001 to 2005
Contracts for Other Housekeeping Services, Laundry and DryCleaning Services, Outerwear, Men's by Navy, Army Signed by year:2000: $0; 2001: $3,092; 2002: $6,295; 2003: $15,596; 2004: $13,294; 2005: $14,397; 2006: $0.
Biggest contracts:
$15,596 with Navy for Other Housekeeping Services. Signed on 2003-08-04. Completion date: 2004-09-30.
$14,397 with Navy for Laundry and DryCleaning Services. Signed on 2005-07-08. Completion date: 2006-09-30.
$13,294 with Navy for Other Housekeeping Services. Signed on 2004-08-27. Completion date: 2005-09-30.
$6,295, same as above.Signed on 2002-10-21. Completion date: 2003-09-30.
WASHOE, COUNTY OF (1001 E 9TH ST)
$38,000 with Army for Telephone and/or Communications Services (includes Telegraph, Telex, and Cablevision Services). Signed on 2004-09-14. Completion date: 2004-11-15.
BERGDAHL ASSOCIATES INC (2990 SUTRO ST; small business) : $21,981 in 4 contractsfrom 2003 to 2005
$9,528 with Air Force for Miscellaneous Materials Handling Equipment. Signed on 2005-03-28. Completion date: 2005-05-02.
$4,764 with Army for Miscellaneous Maintenance and Repair Shop Specialized Equipment. Signed on 2005-02-24. Completion date: 2005-03-25.
$4,235, same as above.Signed on 2003-02-04. Completion date: 2003-02-26.
$3,454 with Air Force for Cleaning and Polishing Compounds and Preparations. Signed on 2005-04-20. Completion date: 2005-05-20.
MICHAEL R CARTWRIGHT (5 CLARET CT; small business)
$17,968 with Army for Real Estate Brokerage Services. Taking place in CA. Signed on 2003-12-10. Completion date: 2004-03-10.
WEDCO INC (450 TOANO ST; small business) : $17,722 in 3 contractsfrom 2004 to 2005
$12,284 with Army for Electrical Hardware and Supplies. Signed on 2005-05-26. Completion date: 2005-06-30.
$3,048 with Geological Survey for Electrical Hardware and Supplies. Taking place in OR. Signed on 2004-07-21. Completion date: 2004-10-20.
$2,390 with Army for Electrical Hardware and Supplies. Signed on 2005-10-20. Completion date: 2005-10-31.
Top industries in this zip code by the number of employees in 2005:
2003 - 2018 National Fire Incident Reporting System (NFIRS) incidents
Based on the data from the years 2003 - 2018 the average number of fire incidents per year is 83. The highest number of reported fires - 119 took place in 2011, and the least - 19 in 2005. The data has an increasing trend.
When looking into fire subcategories, the most incidents belonged to: Outside Fires (38.5%), and Structure Fires (37.3%).
Fire incident types reported to NFIRS in Zip Code 89512


 Nearest zip codes: 89501, 89503, 89431, 89433, 89509, 89502.


 Based on the data from the years 2003 - 2018 the average number of fire incidents per year is 83. The highest number of reported fires - 119 took place in 2011, and the least - 19 in 2005. The data has an increasing trend.
 When looking into fire subcategories, the most incidents belonged to: Outside Fires (38.5%), and Structure Fires (37.3%).