Estimated zip code population in 2022: 2,660 Zip code population in 2010: 3,468 Zip code population in 2000: 2,880
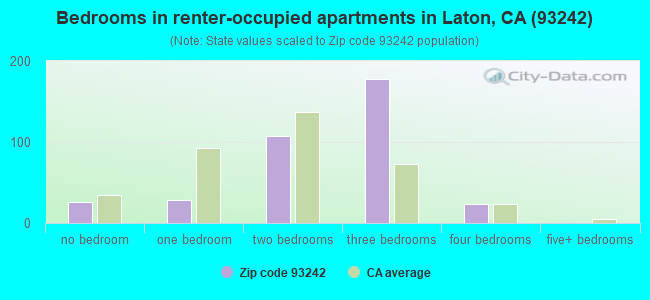
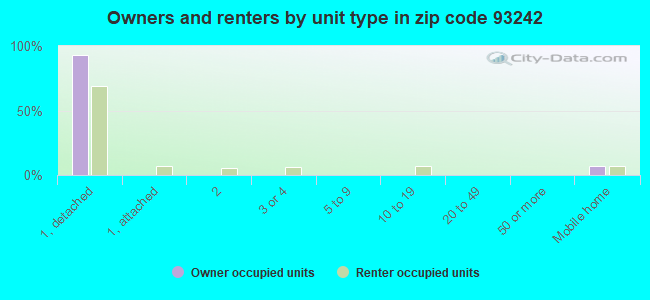
Houses and condos: 1,055 Renter-occupied apartments: 365
% of renters here:
39%
State:
44%
March 2022 cost of living index in zip code 93242: 100.4 (near average, U.S. average is 100)
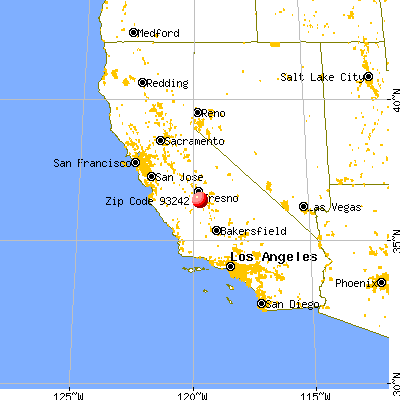
Land area: 41.1 sq. mi. Water area: 0.0 sq. mi.
Population density: 65 people per square mile
(very low).
OSM Map
General Map
Google Map
MSN Map
OSM Map
General Map
Google Map
MSN Map
OSM Map
General Map
Google Map
MSN Map
OSM Map
General Map
Google Map
MSN Map
Please wait while loading the map...
Real estate property taxes paid for housing units in 2022:
This zip code:
0.5% ($2,597)
California:
0.7% ($4,831)
Median real estate property taxes paid for housing units with mortgages in 2022: $2,587 (1.1%) Median real estate property taxes paid for housing units with no mortgage in 2022: $2,748 (0.8%)
Averages for the 2020 tax year for zip code 93242, filed in 2021:
Average Adjusted Gross Income (AGI) in 2020: $54,847 (Individual Income Tax Returns)
Here:
$54,847
State:
$95,910
Salary/wage: $42,741 (reported on 86.7% of returns)
Here:
$42,741
State:
$77,331
(% of AGI for various income ranges: 1721.4% for AGIs below $25k, 5324.6% for AGIs $25k-50k, 8310.8% for AGIs $50k-75k, 12086.7% for AGIs $75k-100k, 16624.0% for AGIs $100k-200k)
Taxable interest for individuals: $2,581 (reported on 20.0% of returns)
This zip code:
$2,581
California:
$2,294
(% of AGI for various income ranges: 5.0% for AGIs below $25k, 4.2% for AGIs $25k-50k, 27.7% for AGIs $50k-75k, 11.7% for AGIs $75k-100k, 84.0% for AGIs $100k-200k)
Ordinary dividends: $6,533 (reported on 4.4% of returns)
Here:
$6,533
State:
$10,949
(% of AGI for various income ranges: 25.8% for AGIs $25k-50k, 650.0% for AGIs $100k-200k)
Net capital gain/loss in AGI: +$69,950 (reported on 5.9% of returns)
Here:
+$69,950
State:
+$49,306
(% of AGI for various income ranges: 53.8% for AGIs $25k-50k, 10912.0% for AGIs $100k-200k)
Profit/loss from business: +$7,492 (reported on 9.6% of returns)
Here:
+$7,492
State:
+$15,671
(% of AGI for various income ranges: 91.8% for AGIs below $25k, 146.2% for AGIs $25k-50k, 561.7% for AGIs $75k-100k)
Taxable individual retirement arrangement distribution: $6,567 (reported on 2.2% of returns)
93242:
$6,567
California:
$23,505
(% of AGI for various income ranges: 70.4% for AGIs below $25k)
Total itemized deductions: $36,057 (reported on 5.2% of returns)
Here:
$36,057
State:
$39,517
(% of AGI for various income ranges: 926.9% for AGIs $50k-75k, 2638.0% for AGIs $100k-200k)
Charity contributions: $11,020 (reported on 3.7% of returns)
Here:
$11,020
State:
$12,598
(% of AGI for various income ranges: 30.8% for AGIs $25k-50k, 942.0% for AGIs $100k-200k)
Taxes paid: $7,371 (reported on 5.2% of returns)
93242:
$7,371
State:
$8,807
(% of AGI for various income ranges: 192.3% for AGIs $50k-75k, 532.0% for AGIs $100k-200k)
Earned income credit: $2,159 (reported on 20.0% of returns)
Here:
$2,159
State:
$2,074
(% of AGI for various income ranges: 110.0% for AGIs below $25k, 105.8% for AGIs $25k-50k)
Percentage of individuals using paid preparers for their 2020 taxes: 89.6%
Here:
90%
State:
92%
(% for various income ranges: 91.5% for AGIs below $25k, 86.7% for AGIs $25k-50k, 90.5% for AGIs $50k-75k, 90.0% for AGIs $75k-100k, 88.9% for AGIs $100k-200k, 100.0% for AGIs over 200k)
Averages for the 2012 tax year for zip code 93242, filed in 2013:
Average Adjusted Gross Income (AGI) in 2012: $42,002 (Individual Income Tax Returns)
Here:
$42,002
State:
$72,726
Salary/wage: $32,301 (reported on 89.6% of returns)
Here:
$32,301
State:
$59,079
(% of AGI for various income ranges: 79.9% for AGIs below $25k, 88.6% for AGIs $25k-50k, 80.3% for AGIs $50k-75k, 80.2% for AGIs $75k-100k, 37.8% for AGIs $100k-200k)
Taxable interest for individuals: $1,750 (reported on 20.9% of returns)
This zip code:
$1,750
California:
$2,146
(% of AGI for various income ranges: 0.7% for AGIs below $25k, 0.2% for AGIs $25k-50k, 0.2% for AGIs $50k-75k, 2.1% for AGIs $100k-200k)
Ordinary dividends: $1,840 (reported on 3.7% of returns)
Here:
$1,840
State:
$9,308
Net capital gain/loss in AGI: +$20,217 (reported on 4.5% of returns)
Here:
+$20,217
State:
+$30,460
Profit/loss from business: +$8,708 (reported on 9.0% of returns)
Here:
+$8,708
State:
+$17,064
(% of AGI for various income ranges: 5.0% for AGIs below $25k, 1.6% for AGIs $25k-50k, 6.7% for AGIs $75k-100k)
Taxable individual retirement arrangement distribution: $13,460 (reported on 3.7% of returns)
93242:
$13,460
California:
$19,557
Total itemized deductions: $28,545 (25% of AGI, reported on 14.9% of returns)
Here:
$28,545
State:
$34,004
Here:
25.5% of AGI
State:
22.7% of AGI
(% of AGI for various income ranges: 4.3% for AGIs below $25k, 4.8% for AGIs $25k-50k, 9.1% for AGIs $50k-75k, 14.0% for AGIs $75k-100k, 17.0% for AGIs $100k-200k)
Charity contributions: $6,256 (reported on 11.9% of returns)
Here:
$6,256
State:
$4,659
(% of AGI for various income ranges: 0.5% for AGIs $25k-50k, 1.0% for AGIs $50k-75k, 1.6% for AGIs $75k-100k, 4.2% for AGIs $100k-200k)
Taxes paid: $7,095 (reported on 14.9% of returns)
93242:
$7,095
State:
$14,448
(% of AGI for various income ranges: 0.5% for AGIs below $25k, 0.9% for AGIs $25k-50k, 1.8% for AGIs $50k-75k, 4.5% for AGIs $75k-100k, 4.7% for AGIs $100k-200k)
Earned income credit: $2,489 (reported on 26.1% of returns)
Here:
$2,489
State:
$2,286
(% of AGI for various income ranges: 6.7% for AGIs below $25k, 1.8% for AGIs $25k-50k)
Percentage of individuals using paid preparers for their 2012 taxes: 72.4%
Here:
72%
State:
64%
(% for various income ranges: 70.0% for AGIs below $25k, 72.3% for AGIs $25k-50k, 76.9% for AGIs $50k-75k, 66.7% for AGIs $75k-100k, 87.5% for AGIs $100k-200k)
Averages for the 2004 tax year for zip code 93242, filed in 2005:
Average Adjusted Gross Income (AGI) in 2004: $29,097 (Individual Income Tax Returns)
Here:
$29,097
State:
$58,600
Salary/wage: $28,671 (reported on 87.5% of returns)
Here:
$28,671
State:
$49,455
(% of AGI for various income ranges: 1219.8% for AGIs below $10k, 83.8% for AGIs $10k-25k, 87.2% for AGIs $25k-50k, 83.4% for AGIs $50k-75k, 80.8% for AGIs $75k-100k, 78.1% for AGIs over 100k)
Taxable interest for individuals: $1,910 (reported on 27.2% of returns)
This zip code:
$1,910
California:
$2,365
(% of AGI for various income ranges: 76.7% for AGIs below $10k, 1.5% for AGIs $10k-25k, 0.7% for AGIs $25k-50k, 1.2% for AGIs $50k-75k, 0.7% for AGIs $75k-100k, 4.7% for AGIs over 100k)
Taxable dividends: $797 (reported on 6.0% of returns)
Here:
$797
State:
$4,746
(% of AGI for various income ranges: 0.1% for AGIs $10k-25k, 0.1% for AGIs $25k-50k, 0.1% for AGIs $50k-75k, 0.6% for AGIs over 100k)
Net capital gain/loss: +$23,727 (reported on 7.6% of returns)
Here:
+$23,727
State:
+$23,418
(% of AGI for various income ranges: 452.3% for AGIs below $10k, 0.6% for AGIs $10k-25k, 0.0% for AGIs $25k-50k, 1.0% for AGIs $50k-75k, 29.7% for AGIs over 100k)
Profit/loss from business: +$6,976 (reported on 9.7% of returns)
Here:
+$6,976
State:
+$16,826
(% of AGI for various income ranges: -110.5% for AGIs below $10k, 3.1% for AGIs $10k-25k, 4.1% for AGIs $25k-50k, 2.7% for AGIs $50k-75k)
IRA payment deduction: $3,562 (reported on 1.2% of returns)
93242:
$3,562
California:
$3,192
Total itemized deductions: $19,132 (29% of AGI, reported on 15.6% of returns)
Here:
$19,132
State:
$28,113
Here:
28.6% of AGI
State:
25.3% of AGI
(% of AGI for various income ranges: 5.6% for AGIs $10k-25k, 7.4% for AGIs $25k-50k, 10.7% for AGIs $50k-75k, 13.9% for AGIs $75k-100k, 20.4% for AGIs over 100k)
Charity contributions deductions: $4,006 (6% of AGI, reported on 13.5% of returns)
Here:
$4,006
State:
$3,923
Here:
5.7% of AGI
State:
3.3% of AGI
(% of AGI for various income ranges: 0.4% for AGIs $10k-25k, 0.9% for AGIs $25k-50k, 1.4% for AGIs $50k-75k, 2.6% for AGIs $75k-100k, 6.0% for AGIs over 100k)
Total tax: $3,558 (reported on 55.8% of returns)
93242:
$3,558
State:
$10,761
(% of AGI for various income ranges: 46.5% for AGIs below $10k, 2.5% for AGIs $10k-25k, 4.6% for AGIs $25k-50k, 7.7% for AGIs $50k-75k, 9.4% for AGIs $75k-100k, 14.5% for AGIs over 100k)
Earned income credit: $1,882 (reported on 30.5% of returns)
Here:
$1,882
State:
$1,763
Percentage of individuals using paid preparers for their 2004 taxes: 77.0%
Here:
77%
State:
66%
(% for various income ranges: 69.9% for AGIs below $10k, 80.3% for AGIs $10k-25k, 77.0% for AGIs $25k-50k, 71.7% for AGIs $50k-75k, 79.5% for AGIs $75k-100k, 92.7% for AGIs over 100k)
Household received Food Stamps/SNAP in the past 12 months: 120 Household did not receive Food Stamps/SNAP in the past 12 months: 820
Women who had a birth in the past 12 months: 68 (46 now married, 22 unmarried) Women who did not have a birth in the past 12 months: 490 (155 now married, 335 unmarried)
Housing units in zip code 93242 with a mortgage: 425 (11 second mortgage, 11 both second mortgage and home equity loan) Median monthly owner costs for units with a mortgage: $1,723 Median monthly owner costs for units without a mortgage: $786
Residents with income below the poverty level in 2022:
This zip code:
14.6%
Whole state:
12.2%
Residents with income below 50% of the poverty level in 2022:
This zip code:
3.5%
Whole state:
6.2%
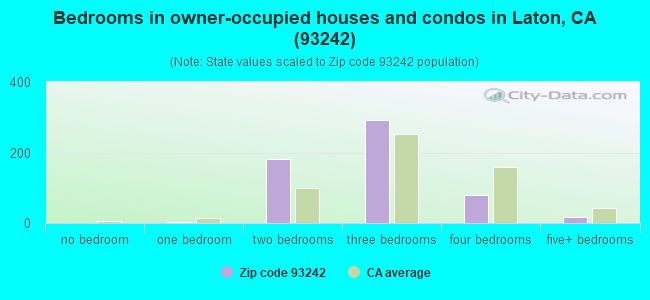
Median number of rooms in houses and condos:
Here:
5.0
State:
6.0
Median number of rooms in apartments:
Here:
4.7
State:
3.9
Notable locations in this zip code not listed on our city pages
Notable locations in zip code 93242: A J Dairy (A), Medeiros Dairy (B), Goulart Dairy (C), Areias Brothers Dairy (D), Maple Dairy (E), Zonneveld Dairies Complex (F), Laton Volunteer Fire Department (G). Display/hide their locations on the map
Size of family households: 159 2-persons, 48 3-persons, 218 4-persons, 105 5-persons, 17 6-persons, 29 7-or-more-persons
Size of nonfamily households: 341 1-person, 15 2-persons
412 married couples with children.
180 single-parent households (8 men, 172 women).
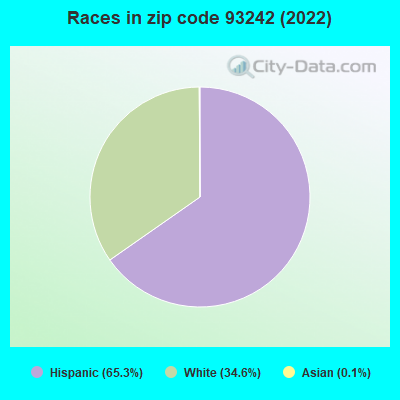
56.9% of residents of 93242 zip code speak English at home.
38.6% of residents speak Spanish at home (49% very well, 25% well, 17% not well, 9% not at all).
3.9% of residents speak other Indo-European language at home (16% very well, 84% well).
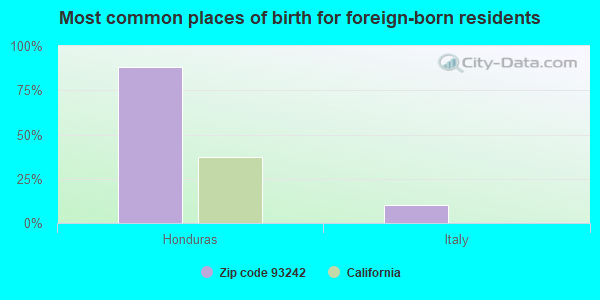
Foreign born population: 589 (22.2%) (33.5% of them are naturalized citizens)
This zip code:
22.2%
Whole state:
26.7%
88%Honduras
10%Italy
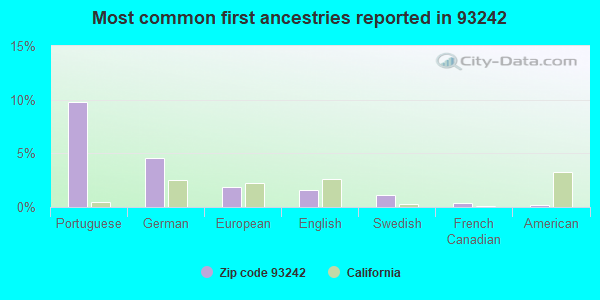
10%Portuguese
5%German
2%European
2%English
1%Swedish
0%French Canadian
0%American
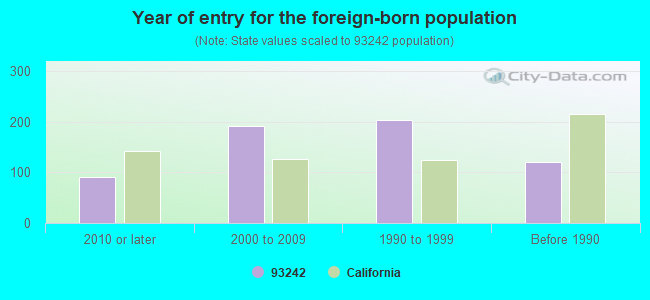
Year of entry for the foreign-born population
912010 or later
1922000 to 2009
2031990 to 1999
121Before 1990
Facilities with environmental interests located in this zip code:
LATON ELEMENTARY (6065 LATONIA in LATON, CA)
(National Center for Education Statistics) - STATE ID-6006902 Organizations: LATON JOINT UNIFIED (SCHOOL DISTRICT)
LATON HIGH (6449 DEWOODY in LATON, CA)
(National Center for Education Statistics) - STATE ID-1033950 Organizations: LATON JOINT UNIFIED (SCHOOL DISTRICT)
JOE GONSALVES DAIRY (EAST HARLAN AVENUE in LATON, CA)
National Pollutant Discharge Elimination System NON-MAJOR (Tracking pollutant discharge elimination systems) - permit Business SIC classification: DAIRY FARMS
LATON DISPOSAL SITE (CLOVIS AVE & BLANCHARD AVE in LATON, CA)
CRITERIA AND HAZARDOUS AIR POLLUTANT INVENTORY (Inventory of air pollution sources) Business SIC classification: REFUSE SYSTEMS Business NAICS classification: SOLID WASTE LANDFILL.
Housing units lacking complete plumbing facilities: 0.8% Housing units lacking complete kitchen facilities: 3.0%
39.6%Utility gas
25.3%Bottled, tank, or LP gas
21.7%Electricity
10.8%No fuel used
2.2%Other fuel
0.8%Wood
Population in 1990: 2,860. Population change in the 1990s: +20 (+0.7%).
Place of birth for U.S.-born residents:
This state: 1,753
Northeast: 8
Midwest: 139
South: 125
West: 18
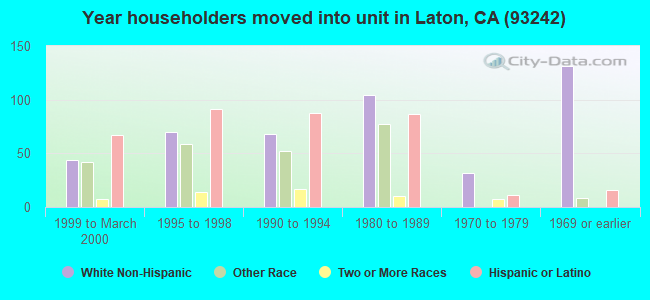
72% of the 93242 zip code residents lived in the same house 5 years ago. Out of people who lived in different houses, 77% lived in this county. Out of people who lived in different counties, 50% lived in California.
89% of the 93242 zip code residents lived in the same house 1 year ago. Out of people who lived in different houses, 55% moved from this county. Out of people who lived in different houses, 23% moved from different county within same state. Out of people who lived in different houses, 22% moved from different state.
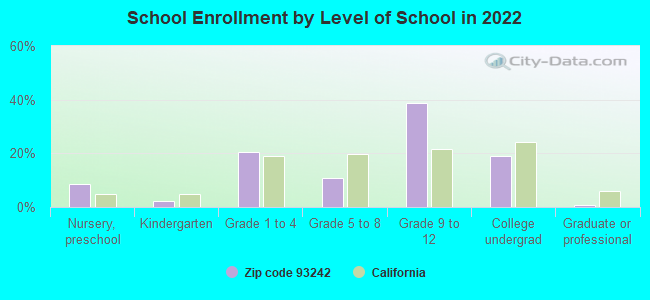
Private vs. public school enrollment:
Students in private schools in grades 1 to 8 (elementary and middle school): 6
Here:
2.5%
California:
10.5%
Students in private schools in grades 9 to 12 (high school):
Here:
0.0%
California:
8.5%
Students in private undergraduate colleges:
Here:
0.0%
California:
15.9%
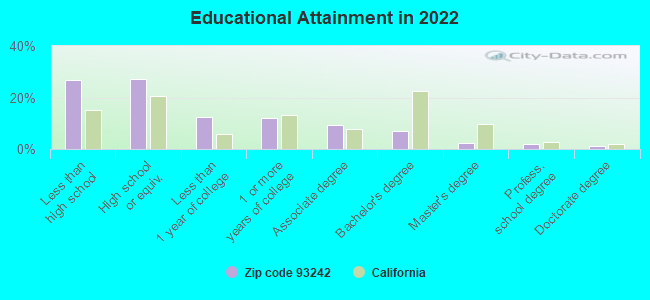
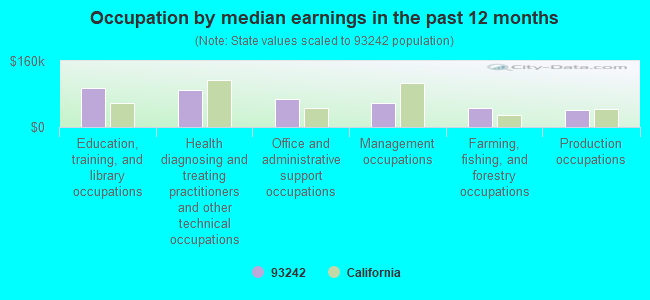
Occupation by median earnings in the past 12 months ($)
95,504Education, training, and library occupations
88,684Health diagnosing and treating practitioners and other technical occupations
69,047Office and administrative support occupations
56,989Management occupations
46,711Farming, fishing, and forestry occupations
42,121Production occupations
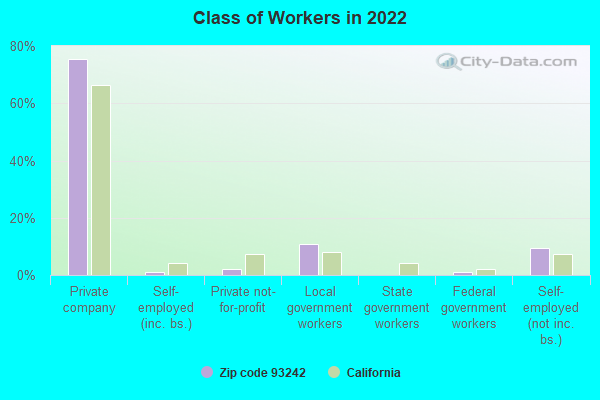
Top industries in this zip code by the number of employees in 2005:
Health Care and Social Assistance: Continuing Care Retirement Communities (20-49 employees: 1 establishment)
Construction: Other Heavy and Civil Engineering Construction (10-19: 1)
Construction: Site Preparation Contractors (5-9: 1)
Wholesale Trade: Farm and Garden Machinery and Equipment Merchant Wholesalers (5-9: 1)
Administrative and Support and Waste Management and Remediation Services: Document Preparation Services (5-9: 1)
Construction: Electrical Contractors (1-4: 1)
Professional, Scientific, and Technical Services: Offices of Lawyers (1-4: 1)
People in group quarters in 2000:
5 people in other noninstitutional group quarters
Fatal accident statistics in 2014:
Fatal accident count: 3
Vehicles involved in fatal accidents: 6
Fatal accidents caused by drunken drivers: 0
Fatalities: 4
Persons involved in fatal accidents: 10
Pedestrians involved in fatal accidents: 0
Fatal accident statistics in 2013:
Fatal accident count: 1
Vehicles involved in fatal accidents: 4
Fatal accidents caused by drunken drivers: 0
Fatalities: 1
Persons involved in fatal accidents: 6
Pedestrians involved in fatal accidents: 0
Home Mortgage Disclosure Act Aggregated Statistics For Year 2009 (Based on 2 partial tracts)
A) FHA, FSA/RHS & VA Home Purchase Loans
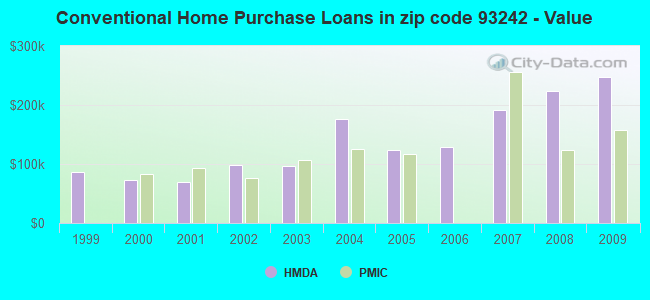
B) Conventional Home Purchase Loans
C) Refinancings
D) Home Improvement Loans
F) Non-occupant Loans on < 5 Family Dwellings (A B C & D)
G) Loans On Manufactured Home Dwelling (A B C & D)
Number
Average Value
Number
Average Value
Number
Average Value
Number
Average Value
Number
Average Value
Number
Average Value
LOANS ORIGINATED
5
$125,568
3
$246,950
17
$154,836
3
$116,673
2
$166,380
0
$0
APPLICATIONS APPROVED, NOT ACCEPTED
0
$0
0
$0
2
$327,260
0
$0
0
$0
0
$0
APPLICATIONS DENIED
0
$0
0
$0
14
$156,624
2
$78,480
0
$0
0
$0
APPLICATIONS WITHDRAWN
2
$268,400
0
$0
14
$185,661
0
$0
2
$111,440
0
$0
FILES CLOSED FOR INCOMPLETENESS
2
$139,695
2
$269,970
3
$95,747
2
$51,795
0
$0
2
$139,695
Aggregated Statistics For Year 2008 (Based on 2 partial tracts)
A) FHA, FSA/RHS & VA Home Purchase Loans
B) Conventional Home Purchase Loans
C) Refinancings
D) Home Improvement Loans
F) Non-occupant Loans on < 5 Family Dwellings (A B C & D)
G) Loans On Manufactured Home Dwelling (A B C & D)
Number
Average Value
Number
Average Value
Number
Average Value
Number
Average Value
Number
Average Value
Number
Average Value
LOANS ORIGINATED
2
$124,785
5
$222,884
25
$177,176
6
$53,628
5
$115,522
2
$115,365
APPLICATIONS APPROVED, NOT ACCEPTED
0
$0
2
$176,580
11
$214,465
2
$232,300
0
$0
0
$0
APPLICATIONS DENIED
0
$0
6
$145,973
60
$168,418
8
$62,391
2
$70,630
2
$129,490
APPLICATIONS WITHDRAWN
0
$0
3
$248,520
16
$142,834
0
$0
0
$0
0
$0
FILES CLOSED FOR INCOMPLETENESS
0
$0
0
$0
2
$39,240
2
$129,490
0
$0
0
$0
Aggregated Statistics For Year 2007 (Based on 2 partial tracts)
B) Conventional Home Purchase Loans
C) Refinancings
D) Home Improvement Loans
F) Non-occupant Loans on < 5 Family Dwellings (A B C & D)
G) Loans On Manufactured Home Dwelling (A B C & D)
Number
Average Value
Number
Average Value
Number
Average Value
Number
Average Value
Number
Average Value
LOANS ORIGINATED
30
$191,177
75
$199,151
11
$103,165
13
$176,761
2
$171,085
APPLICATIONS APPROVED, NOT ACCEPTED
11
$137,269
14
$190,819
6
$52,582
0
$0
0
$0
APPLICATIONS DENIED
16
$173,735
60
$189,948
9
$124,347
8
$150,289
5
$137,496
APPLICATIONS WITHDRAWN
6
$150,420
24
$141,918
8
$112,815
2
$62,785
2
$171,085
FILES CLOSED FOR INCOMPLETENESS
3
$133,940
9
$155,041
3
$100,453
0
$0
0
$0
Aggregated Statistics For Year 2006 (Based on 2 partial tracts)
A) FHA, FSA/RHS & VA Home Purchase Loans
B) Conventional Home Purchase Loans
C) Refinancings
D) Home Improvement Loans
F) Non-occupant Loans on < 5 Family Dwellings (A B C & D)
G) Loans On Manufactured Home Dwelling (A B C & D)
Number
Average Value
Number
Average Value
Number
Average Value
Number
Average Value
Number
Average Value
Number
Average Value
LOANS ORIGINATED
2
$189,920
38
$128,872
96
$149,652
20
$108,460
11
$120,574
2
$98,100
APPLICATIONS APPROVED, NOT ACCEPTED
0
$0
13
$145,611
14
$143,282
5
$76,910
2
$269,970
0
$0
APPLICATIONS DENIED
0
$0
35
$163,283
67
$153,985
14
$58,972
13
$142,955
5
$97,316
APPLICATIONS WITHDRAWN
0
$0
8
$157,156
63
$150,781
3
$113,533
2
$82,405
2
$51,010
FILES CLOSED FOR INCOMPLETENESS
2
$116,150
3
$146,497
5
$144,404
0
$0
0
$0
0
$0
Aggregated Statistics For Year 2005 (Based on 2 partial tracts)
A) FHA, FSA/RHS & VA Home Purchase Loans
B) Conventional Home Purchase Loans
C) Refinancings
D) Home Improvement Loans
F) Non-occupant Loans on < 5 Family Dwellings (A B C & D)
G) Loans On Manufactured Home Dwelling (A B C & D)
Number
Average Value
Number
Average Value
Number
Average Value
Number
Average Value
Number
Average Value
Number
Average Value
LOANS ORIGINATED
0
$0
57
$124,026
102
$133,293
9
$97,839
8
$121,251
3
$53,367
APPLICATIONS APPROVED, NOT ACCEPTED
0
$0
8
$247,409
20
$153,193
2
$31,390
3
$111,440
0
$0
APPLICATIONS DENIED
3
$64,353
27
$115,860
67
$126,458
9
$68,888
5
$48,344
3
$49,180
APPLICATIONS WITHDRAWN
3
$137,080
8
$138,321
82
$135,120
0
$0
2
$196,200
2
$70,630
FILES CLOSED FOR INCOMPLETENESS
0
$0
2
$26,685
13
$111,442
0
$0
0
$0
2
$85,545
Aggregated Statistics For Year 2004 (Based on 2 partial tracts)
A) FHA, FSA/RHS & VA Home Purchase Loans
B) Conventional Home Purchase Loans
C) Refinancings
D) Home Improvement Loans
F) Non-occupant Loans on < 5 Family Dwellings (A B C & D)
G) Loans On Manufactured Home Dwelling (A B C & D)
Number
Average Value
Number
Average Value
Number
Average Value
Number
Average Value
Number
Average Value
Number
Average Value
LOANS ORIGINATED
5
$91,036
16
$175,501
93
$120,184
13
$78,722
5
$91,978
3
$94,177
APPLICATIONS APPROVED, NOT ACCEPTED
0
$0
6
$126,615
20
$127,373
3
$47,087
5
$72,516
3
$82,667
APPLICATIONS DENIED
0
$0
6
$147,020
86
$112,354
19
$71,458
8
$78,284
2
$73,770
APPLICATIONS WITHDRAWN
3
$70,633
9
$187,306
53
$111,530
3
$68,017
5
$77,538
2
$65,140
FILES CLOSED FOR INCOMPLETENESS
0
$0
2
$142,050
9
$130,277
2
$89,465
2
$89,465
0
$0
Aggregated Statistics For Year 2003 (Based on 2 partial tracts)
A) FHA, FSA/RHS & VA Home Purchase Loans
B) Conventional Home Purchase Loans
C) Refinancings
D) Home Improvement Loans
F) Non-occupant Loans on < 5 Family Dwellings (A B C & D)
Number
Average Value
Number
Average Value
Number
Average Value
Number
Average Value
Number
Average Value
LOANS ORIGINATED
6
$96,268
16
$97,119
110
$95,332
2
$6,280
14
$91,485
APPLICATIONS APPROVED, NOT ACCEPTED
2
$58,075
2
$69,060
19
$97,233
0
$0
0
$0
APPLICATIONS DENIED
2
$83,190
2
$55,720
69
$90,468
3
$54,937
0
$0
APPLICATIONS WITHDRAWN
0
$0
8
$137,929
44
$126,175
0
$0
0
$0
FILES CLOSED FOR INCOMPLETENESS
0
$0
0
$0
5
$73,772
0
$0
2
$47,875
Aggregated Statistics For Year 2002 (Based on 2 partial tracts)
A) FHA, FSA/RHS & VA Home Purchase Loans
B) Conventional Home Purchase Loans
C) Refinancings
D) Home Improvement Loans
F) Non-occupant Loans on < 5 Family Dwellings (A B C & D)
Number
Average Value
Number
Average Value
Number
Average Value
Number
Average Value
Number
Average Value
LOANS ORIGINATED
6
$77,957
16
$98,198
69
$89,831
5
$26,370
5
$45,204
APPLICATIONS APPROVED, NOT ACCEPTED
0
$0
2
$112,225
3
$88,943
0
$0
0
$0
APPLICATIONS DENIED
2
$62,000
2
$163,240
50
$97,817
6
$19,882
2
$51,010
APPLICATIONS WITHDRAWN
2
$54,150
0
$0
13
$76,911
3
$31,393
0
$0
FILES CLOSED FOR INCOMPLETENESS
2
$64,355
0
$0
3
$58,600
0
$0
0
$0
Aggregated Statistics For Year 2001 (Based on 2 partial tracts)
A) FHA, FSA/RHS & VA Home Purchase Loans
B) Conventional Home Purchase Loans
C) Refinancings
D) Home Improvement Loans
F) Non-occupant Loans on < 5 Family Dwellings (A B C & D)
Number
Average Value
Number
Average Value
Number
Average Value
Number
Average Value
Number
Average Value
LOANS ORIGINATED
6
$97,577
19
$68,980
35
$97,764
3
$41,333
3
$65,923
APPLICATIONS APPROVED, NOT ACCEPTED
0
$0
0
$0
9
$123,127
0
$0
0
$0
APPLICATIONS DENIED
0
$0
8
$41,202
41
$68,488
5
$27,938
5
$30,764
APPLICATIONS WITHDRAWN
0
$0
3
$112,487
36
$102,460
0
$0
0
$0
FILES CLOSED FOR INCOMPLETENESS
0
$0
2
$142,835
8
$124,980
0
$0
0
$0
Aggregated Statistics For Year 2000 (Based on 2 partial tracts)
A) FHA, FSA/RHS & VA Home Purchase Loans
B) Conventional Home Purchase Loans
C) Refinancings
D) Home Improvement Loans
F) Non-occupant Loans on < 5 Family Dwellings (A B C & D)
Number
Average Value
Number
Average Value
Number
Average Value
Number
Average Value
Number
Average Value
LOANS ORIGINATED
14
$66,259
14
$73,435
27
$66,911
3
$37,670
11
$60,358
APPLICATIONS APPROVED, NOT ACCEPTED
0
$0
2
$30,605
8
$69,062
0
$0
0
$0
APPLICATIONS DENIED
0
$0
9
$74,643
35
$68,210
5
$47,402
0
$0
APPLICATIONS WITHDRAWN
5
$75,340
2
$50,225
20
$107,204
0
$0
0
$0
FILES CLOSED FOR INCOMPLETENESS
0
$0
0
$0
5
$68,120
0
$0
0
$0
Aggregated Statistics For Year 1999 (Based on 1 partial tract)
A) FHA, FSA/RHS & VA Home Purchase Loans
B) Conventional Home Purchase Loans
C) Refinancings
D) Home Improvement Loans
E) Loans on Dwellings For 5+ Families
F) Non-occupant Loans on < 5 Family Dwellings (A B C & D)
Detailed PMIC statistics for the following Tracts:0074.00
2004 - 2018 National Fire Incident Reporting System (NFIRS) incidents
Based on the data from the years 2004 - 2018 the average number of fire incidents per year is 35. The highest number of fires - 65 took place in 2005, and the least - 19 in 2004. The data has a growing trend.
When looking into fire subcategories, the most reports belonged to: Outside Fires (62.7%), and Mobile Property/Vehicle Fires (22.1%).
Fire incident types reported to NFIRS in Zip Code 93242


 Nearest zip codes: 93662, 93202, 93609, 93245, 93230, 93725.


 Based on the data from the years 2004 - 2018 the average number of fire incidents per year is 35. The highest number of fires - 65 took place in 2005, and the least - 19 in 2004. The data has a growing trend.
 When looking into fire subcategories, the most reports belonged to: Outside Fires (62.7%), and Mobile Property/Vehicle Fires (22.1%).