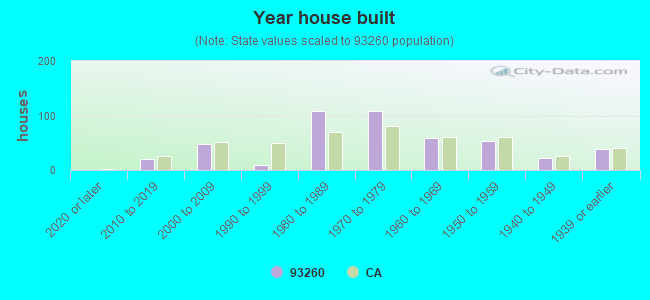
Estimated zip code population in 2022: 176 Zip code population in 2010: 200 Zip code population in 2000: 247
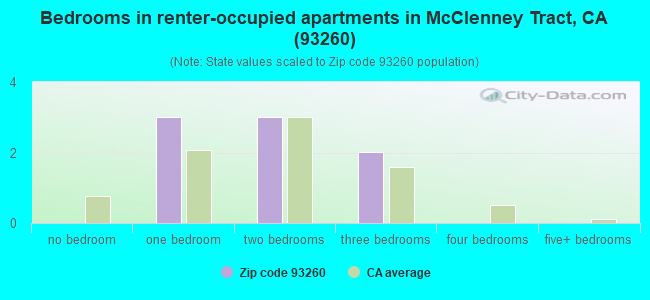
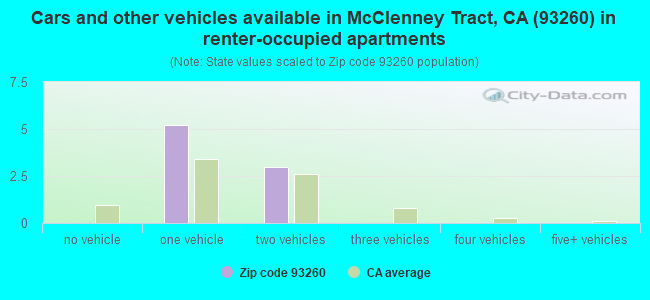
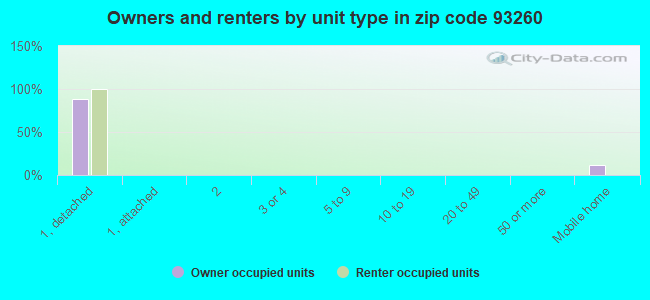
Houses and condos: 469 Renter-occupied apartments: 8
% of renters here:
10%
State:
44%
March 2022 cost of living index in zip code 93260: 92.8 (less than average, U.S. average is 100)
Land area: 32.9 sq. mi. Water area: 0.0 sq. mi.
Population density: 5 people per square mile
(very low).
OSM Map
General Map
Google Map
MSN Map
OSM Map
General Map
Google Map
MSN Map
OSM Map
General Map
Google Map
MSN Map
OSM Map
General Map
Google Map
MSN Map
Please wait while loading the map...
Real estate property taxes paid for housing units in 2022:
This zip code:
0.6% ($1,694)
California:
0.7% ($4,831)
Median real estate property taxes paid for housing units with mortgages in 2022: $1,936 (0.6%) Median real estate property taxes paid for housing units with no mortgage in 2022: $1,222 (0.5%)
Business Search- 14 Million verified businesses
Males: 91
(51.7%)
Females: 85
(48.3%)
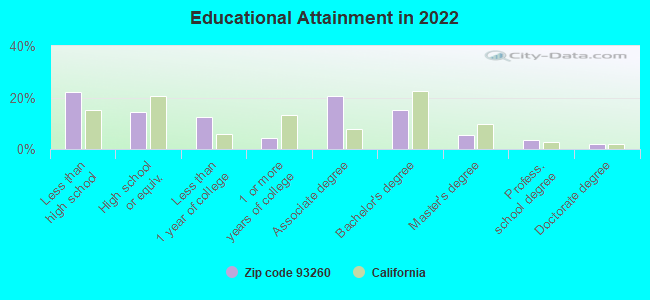
For population 25 years and over in 93260:
High school or higher: 75.5%
Bachelor's degree or higher: 24.4%
Graduate or professional degree: 10.2%
Mean travel time to work (commute): 289.6 minutes
For population 15 years and over in 93260:
Never married: 17.4%
Now married: 58.4%
Separated: 6.1%
Widowed: 12.0%
Divorced: 6.2%
Zip code 93260 compared to state average:
Median household income significantly below state average.
Median house value significantly below state average.
Unemployed percentage significantly below state average.
Black race population percentage significantly below state average.
Hispanic race population percentage significantly below state average.
Median age above state average.
Foreign-born population percentage significantly below state average.
Renting percentage significantly below state average.
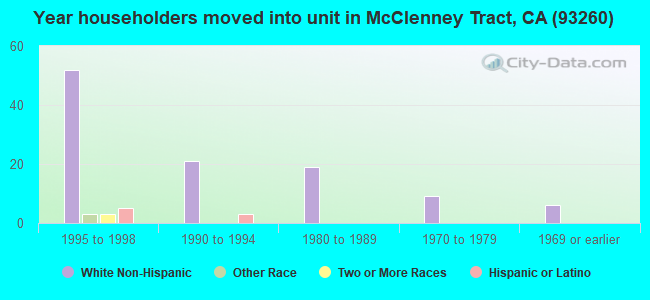
Length of stay since moving in significantly below state average.
Number of college students significantly below state average.
Percentage of population with a bachelor's degree or higher below state average.
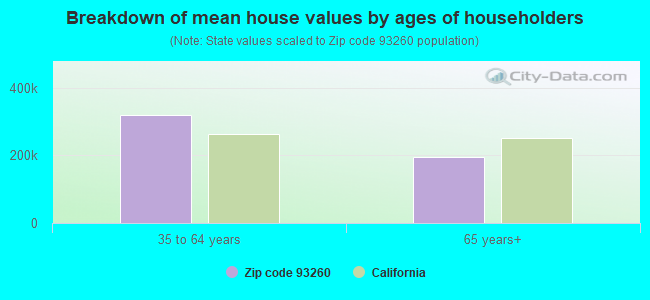
Estimated median house/condo value in 2022: $274,177
93260:
$274,177
California:
$715,900
According to our research of California and other state lists, there was 1 registered sex offender living in 93260 zip code as of May 02, 2024. The ratio of all residents to sex offenders in zip code 93260 is 201 to 1.
Median resident age:
This zip code:
44.6 years
California median age:
37.9 years
Average household size:
This zip code:
2.3 people
California:
2.8 people
Averages for the 2004 tax year for zip code 93260, filed in 2005:
Average Adjusted Gross Income (AGI) in 2004: $41,969 (Individual Income Tax Returns)
Here:
$41,969
State:
$58,600
Salary/wage: $33,179 (reported on 58.3% of returns)
Here:
$33,179
State:
$49,455
Taxable interest for individuals: $1,034 (reported on 60.4% of returns)
This zip code:
$1,034
California:
$2,365
(% of AGI for various income ranges: 5.9% for AGIs $10k-25k, 2.1% for AGIs $25k-50k, 0.2% for AGIs $50k-75k, 0.4% for AGIs $75k-100k)
Taxable dividends: $1,263 (reported on 19.8% of returns)
Here:
$1,263
State:
$4,746
Net capital gain/loss: +$2,522 (reported on 24.0% of returns)
Here:
+$2,522
State:
+$23,418
Profit/loss from business: +$3,600 (reported on 10.4% of returns)
Here:
+$3,600
State:
+$16,826
Total itemized deductions: $15,500 (25% of AGI, reported on 39.6% of returns)
Here:
$15,500
State:
$28,113
Here:
25.3% of AGI
State:
25.3% of AGI
Charity contributions deductions: $1,639 (3% of AGI, reported on 37.5% of returns)
Here:
$1,639
State:
$3,923
Here:
2.7% of AGI
State:
3.3% of AGI
Total tax: $4,961 (reported on 79.2% of returns)
93260:
$4,961
State:
$10,761
(% of AGI for various income ranges: 3.7% for AGIs $10k-25k, 7.2% for AGIs $25k-50k, 8.1% for AGIs $50k-75k, 13.2% for AGIs $75k-100k)
Percentage of individuals using paid preparers for their 2004 taxes: 68.8%
Here:
69%
State:
66%
(% for various income ranges: 89.7% for AGIs $10k-25k, 70.4% for AGIs $25k-50k, 76.9% for AGIs $50k-75k, 68.8% for AGIs $75k-100k)
Household received Food Stamps/SNAP in the past 12 months: 0 Household did not receive Food Stamps/SNAP in the past 12 months: 76
Women who had a birth in the past 12 months: 1 (1 now married, 0 unmarried) Women who did not have a birth in the past 12 months: 28 (12 now married, 16 unmarried)
Housing units in zip code 93260 with a mortgage: 52 Median monthly owner costs for units with a mortgage: $1,743 Median monthly owner costs for units without a mortgage: $500
Residents with income below the poverty level in 2022:
This zip code:
18.6%
Whole state:
12.2%
Residents with income below 50% of the poverty level in 2022:
This zip code:
2.7%
Whole state:
6.2%
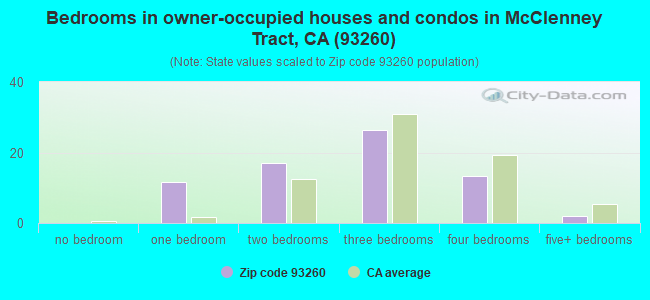
Median number of rooms in houses and condos:
Here:
5.3
State:
6.0
Median number of rooms in apartments:
Here:
7.8
State:
3.9
Notable locations in this zip code not listed on our city pages
Notable locations in zip code 93260: Burton Ranch (A), Sierra Christian Camp (B), Vincent Ranch (C), Jack Ranch (D), Poso Forest Service Station (E), Cedar Trough Landmark Object (F), Sugarloaf Campground (G), Tulare County Fire Department Battalion 2 Posey Fire Station 5 (H). Display/hide their locations on the map
Size of family households: 25 2-persons, 9 4-persons, 6 7-or-more-persons
Size of nonfamily households: 35 1-person, 2 2-persons
38 married couples with children.
0 single-parent households ().
All residents speak English at home
Foreign born population: 0 (0.0%)
:
0.0%
Whole state:
26.7%
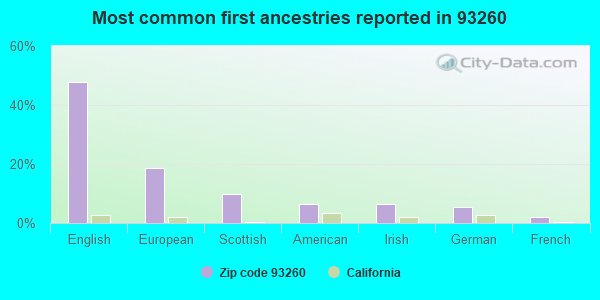
48%English
18%European
10%Scottish
7%American
7%Irish
5%German
2%French
Facilities with environmental interests located in this zip code:
BALANCE ROCK MOUNTAIN LANDFILL TS SINCE 1997 (RD. 412 AT AVE. 12 in BALANCE ROCK, CA)
CRITERIA AND HAZARDOUS AIR POLLUTANT INVENTORY (Inventory of air pollution sources) Business SIC classification: REFUSE SYSTEMS Business NAICS classification: SOLID WASTE LANDFILL.
Housing units lacking complete plumbing facilities: 3.7% Housing units lacking complete kitchen facilities: 3.4%
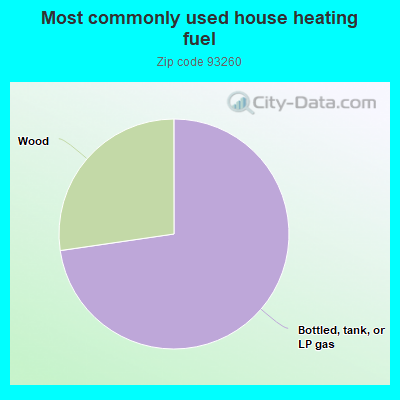
74.0%Bottled, tank, or LP gas
27.8%Wood
Population in 1990: 253.
Place of birth for U.S.-born residents:
This state: 163
Midwest: 8
South: 4
74% of the 93260 zip code residents lived in the same house 5 years ago. Out of people who lived in different houses, 21% lived in this county. Out of people who lived in different counties, 50% lived in California.
84% of the 93260 zip code residents lived in the same house 1 year ago. Out of people who lived in different houses, 95% moved from different county within same state.
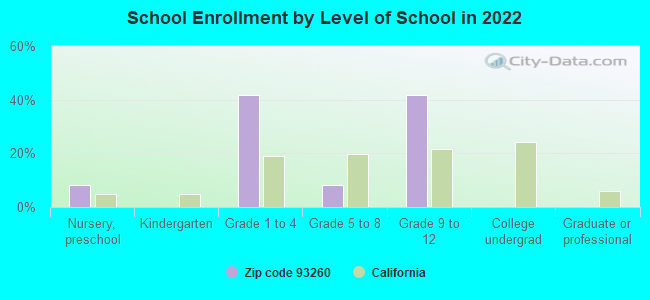
Private vs. public school enrollment:
Students in private schools in grades 1 to 8 (elementary and middle school): 6
Here:
46.7%
California:
10.5%
Students in private schools in grades 9 to 12 (high school):
Here:
0.0%
California:
8.5%
Top industries in this zip code by the number of employees in 2005:
Wholesale Trade: Farm and Garden Machinery and Equipment Merchant Wholesalers (20-49 employees: 1 establishment)
Fatal accident statistics in 2012:
Fatal accident count: 1
Vehicles involved in fatal accidents: 1
Fatal accidents caused by drunken drivers: 0
Fatalities: 1
Persons involved in fatal accidents: 1
Pedestrians involved in fatal accidents: 0
Home Mortgage Disclosure Act Aggregated Statistics For Year 2009 (Based on 2 partial tracts)
A) FHA, FSA/RHS & VA Home Purchase Loans
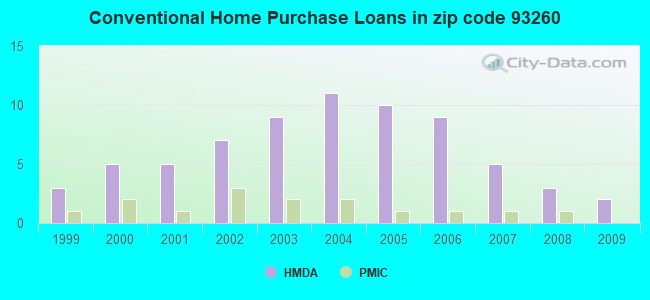
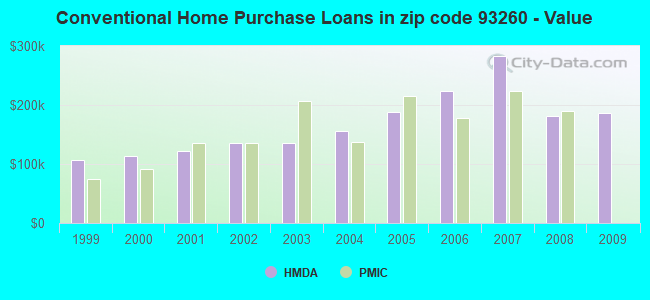
B) Conventional Home Purchase Loans
C) Refinancings
D) Home Improvement Loans
F) Non-occupant Loans on < 5 Family Dwellings (A B C & D)
G) Loans On Manufactured Home Dwelling (A B C & D)
Number
Average Value
Number
Average Value
Number
Average Value
Number
Average Value
Number
Average Value
Number
Average Value
LOANS ORIGINATED
1
$174,290
2
$187,130
7
$176,186
1
$77,910
3
$132,230
0
$0
APPLICATIONS APPROVED, NOT ACCEPTED
0
$0
0
$0
1
$192,990
0
$0
0
$0
0
$0
APPLICATIONS DENIED
0
$0
1
$116,710
5
$209,178
0
$0
1
$234,580
1
$133,080
APPLICATIONS WITHDRAWN
0
$0
0
$0
3
$205,407
0
$0
1
$115,240
0
$0
FILES CLOSED FOR INCOMPLETENESS
0
$0
0
$0
0
$0
0
$0
0
$0
0
$0
Aggregated Statistics For Year 2008 (Based on 2 partial tracts)
B) Conventional Home Purchase Loans
C) Refinancings
D) Home Improvement Loans
F) Non-occupant Loans on < 5 Family Dwellings (A B C & D)
G) Loans On Manufactured Home Dwelling (A B C & D)
Number
Average Value
Number
Average Value
Number
Average Value
Number
Average Value
Number
Average Value
LOANS ORIGINATED
3
$181,893
7
$228,343
1
$80,550
3
$192,680
1
$96,770
APPLICATIONS APPROVED, NOT ACCEPTED
1
$142,160
1
$162,960
0
$0
0
$0
0
$0
APPLICATIONS DENIED
1
$157,680
5
$235,222
1
$239,550
1
$139,450
0
$0
APPLICATIONS WITHDRAWN
0
$0
2
$273,850
0
$0
0
$0
0
$0
FILES CLOSED FOR INCOMPLETENESS
0
$0
0
$0
0
$0
0
$0
0
$0
Aggregated Statistics For Year 2007 (Based on 2 partial tracts)
B) Conventional Home Purchase Loans
C) Refinancings
D) Home Improvement Loans
F) Non-occupant Loans on < 5 Family Dwellings (A B C & D)
G) Loans On Manufactured Home Dwelling (A B C & D)
Number
Average Value
Number
Average Value
Number
Average Value
Number
Average Value
Number
Average Value
LOANS ORIGINATED
5
$282,682
10
$213,307
2
$102,355
3
$240,587
1
$109,650
APPLICATIONS APPROVED, NOT ACCEPTED
1
$109,490
2
$228,065
0
$0
0
$0
0
$0
APPLICATIONS DENIED
2
$249,600
8
$227,300
1
$174,130
2
$191,090
1
$130,370
APPLICATIONS WITHDRAWN
1
$149,380
4
$202,962
0
$0
1
$181,970
0
$0
FILES CLOSED FOR INCOMPLETENESS
0
$0
2
$195,900
0
$0
0
$0
0
$0
Aggregated Statistics For Year 2006 (Based on 2 partial tracts)
B) Conventional Home Purchase Loans
C) Refinancings
D) Home Improvement Loans
F) Non-occupant Loans on < 5 Family Dwellings (A B C & D)
G) Loans On Manufactured Home Dwelling (A B C & D)
Number
Average Value
Number
Average Value
Number
Average Value
Number
Average Value
Number
Average Value
LOANS ORIGINATED
9
$224,256
14
$219,497
4
$107,438
6
$172,000
1
$174,600
APPLICATIONS APPROVED, NOT ACCEPTED
1
$197,650
3
$203,803
1
$76,590
1
$69,140
0
$0
APPLICATIONS DENIED
3
$275,117
7
$210,696
1
$148,910
2
$124,705
1
$116,480
APPLICATIONS WITHDRAWN
1
$223,720
6
$200,247
1
$96,070
1
$214,490
0
$0
FILES CLOSED FOR INCOMPLETENESS
0
$0
2
$224,380
0
$0
0
$0
0
$0
Aggregated Statistics For Year 2005 (Based on 2 partial tracts)
B) Conventional Home Purchase Loans
C) Refinancings
D) Home Improvement Loans
F) Non-occupant Loans on < 5 Family Dwellings (A B C & D)
G) Loans On Manufactured Home Dwelling (A B C & D)
Number
Average Value
Number
Average Value
Number
Average Value
Number
Average Value
Number
Average Value
LOANS ORIGINATED
10
$187,970
15
$197,875
2
$111,470
6
$144,193
1
$109,030
APPLICATIONS APPROVED, NOT ACCEPTED
2
$241,995
2
$197,260
1
$41,440
1
$118,810
0
$0
APPLICATIONS DENIED
2
$242,385
7
$186,871
2
$81,015
1
$129,820
0
$0
APPLICATIONS WITHDRAWN
2
$162,725
8
$171,739
1
$182,980
1
$161,100
1
$87,530
FILES CLOSED FOR INCOMPLETENESS
0
$0
1
$136,420
0
$0
0
$0
0
$0
Aggregated Statistics For Year 2004 (Based on 2 partial tracts)
B) Conventional Home Purchase Loans
C) Refinancings
D) Home Improvement Loans
F) Non-occupant Loans on < 5 Family Dwellings (A B C & D)
G) Loans On Manufactured Home Dwelling (A B C & D)
Number
Average Value
Number
Average Value
Number
Average Value
Number
Average Value
Number
Average Value
LOANS ORIGINATED
11
$155,207
12
$161,156
2
$81,750
5
$121,614
1
$126,720
APPLICATIONS APPROVED, NOT ACCEPTED
2
$132,425
4
$127,982
0
$0
1
$133,160
0
$0
APPLICATIONS DENIED
3
$196,793
8
$127,895
2
$67,665
1
$207,350
1
$64,560
APPLICATIONS WITHDRAWN
1
$213,090
7
$141,310
1
$27,700
0
$0
0
$0
FILES CLOSED FOR INCOMPLETENESS
0
$0
1
$276,100
0
$0
0
$0
0
$0
Aggregated Statistics For Year 2003 (Based on 2 partial tracts)
B) Conventional Home Purchase Loans
C) Refinancings
D) Home Improvement Loans
F) Non-occupant Loans on < 5 Family Dwellings (A B C & D)
Number
Average Value
Number
Average Value
Number
Average Value
Number
Average Value
LOANS ORIGINATED
9
$135,334
23
$135,709
1
$57,810
8
$87,164
APPLICATIONS APPROVED, NOT ACCEPTED
1
$120,510
4
$113,568
0
$0
1
$92,580
APPLICATIONS DENIED
2
$164,630
7
$145,744
1
$25,690
1
$77,990
APPLICATIONS WITHDRAWN
2
$95,100
5
$147,984
0
$0
1
$30,810
FILES CLOSED FOR INCOMPLETENESS
0
$0
1
$78,140
0
$0
0
$0
Aggregated Statistics For Year 2002 (Based on 2 partial tracts)
A) FHA, FSA/RHS & VA Home Purchase Loans
B) Conventional Home Purchase Loans
C) Refinancings
D) Home Improvement Loans
F) Non-occupant Loans on < 5 Family Dwellings (A B C & D)
Number
Average Value
Number
Average Value
Number
Average Value
Number
Average Value
Number
Average Value
LOANS ORIGINATED
1
$82,330
7
$135,301
13
$132,881
1
$52,300
5
$81,124
APPLICATIONS APPROVED, NOT ACCEPTED
0
$0
0
$0
2
$125,325
0
$0
0
$0
APPLICATIONS DENIED
0
$0
1
$119,580
5
$156,908
0
$0
1
$49,200
APPLICATIONS WITHDRAWN
0
$0
1
$133,630
4
$130,718
0
$0
0
$0
FILES CLOSED FOR INCOMPLETENESS
0
$0
0
$0
1
$80,780
0
$0
0
$0
Aggregated Statistics For Year 2001 (Based on 2 partial tracts)
B) Conventional Home Purchase Loans
C) Refinancings
D) Home Improvement Loans
F) Non-occupant Loans on < 5 Family Dwellings (A B C & D)
Number
Average Value
Number
Average Value
Number
Average Value
Number
Average Value
LOANS ORIGINATED
5
$121,212
10
$113,389
1
$46,950
3
$84,660
APPLICATIONS APPROVED, NOT ACCEPTED
1
$81,400
1
$150,000
0
$0
0
$0
APPLICATIONS DENIED
0
$0
3
$87,560
1
$10,710
1
$37,480
APPLICATIONS WITHDRAWN
1
$47,800
3
$133,730
0
$0
0
$0
FILES CLOSED FOR INCOMPLETENESS
0
$0
0
$0
0
$0
0
$0
Aggregated Statistics For Year 2000 (Based on 2 partial tracts)
A) FHA, FSA/RHS & VA Home Purchase Loans
B) Conventional Home Purchase Loans
C) Refinancings
D) Home Improvement Loans
F) Non-occupant Loans on < 5 Family Dwellings (A B C & D)
Number
Average Value
Number
Average Value
Number
Average Value
Number
Average Value
Number
Average Value
LOANS ORIGINATED
1
$71,390
5
$114,366
4
$107,572
1
$21,960
2
$71,235
APPLICATIONS APPROVED, NOT ACCEPTED
0
$0
1
$54,160
1
$81,480
0
$0
0
$0
APPLICATIONS DENIED
0
$0
1
$80,550
3
$103,907
0
$0
0
$0
APPLICATIONS WITHDRAWN
0
$0
0
$0
2
$73,875
0
$0
0
$0
FILES CLOSED FOR INCOMPLETENESS
0
$0
0
$0
0
$0
0
$0
0
$0
Aggregated Statistics For Year 1999 (Based on 1 partial tract)
B) Conventional Home Purchase Loans
C) Refinancings
D) Home Improvement Loans
F) Non-occupant Loans on < 5 Family Dwellings (A B C & D)

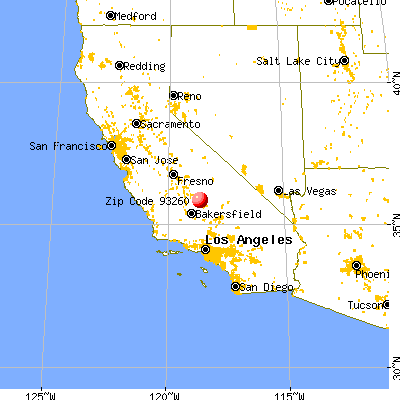


 Nearest zip codes: 93207, 93226, 93285, 93308, 93257, 93208.