Estimated zip code population in 2022: 55,129 Zip code population in 2010: 54,017 Zip code population in 2000: 51,736
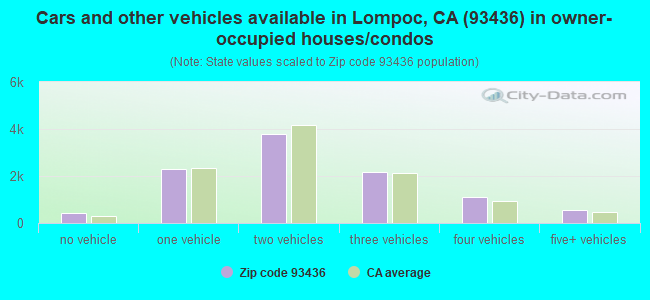
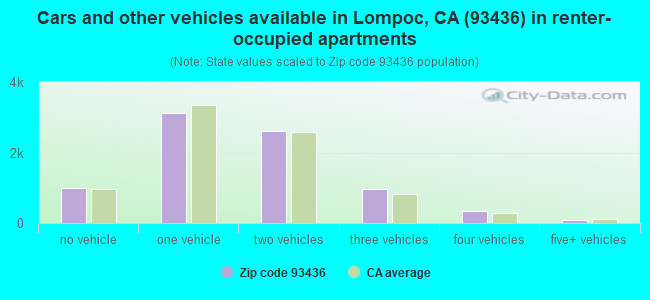
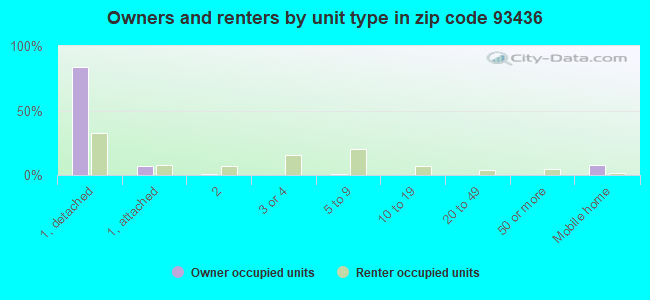
Houses and condos: 19,071 Renter-occupied apartments: 8,107
% of renters here:
44%
State:
44%
March 2022 cost of living index in zip code 93436: 109.5 (more than average, U.S. average is 100)
Land area: 218.9 sq. mi. Water area: 0.8 sq. mi.
Population density: 252 people per square mile
(very low).
OSM Map
General Map
Google Map
MSN Map
OSM Map
General Map
Google Map
MSN Map
OSM Map
General Map
Google Map
MSN Map
OSM Map
General Map
Google Map
MSN Map
Please wait while loading the map...
Real estate property taxes paid for housing units in 2022:
This zip code:
0.6% ($3,015)
California:
0.7% ($4,831)
Median real estate property taxes paid for housing units with mortgages in 2022: $3,362 (0.7%) Median real estate property taxes paid for housing units with no mortgage in 2022: $2,225 (0.5%)
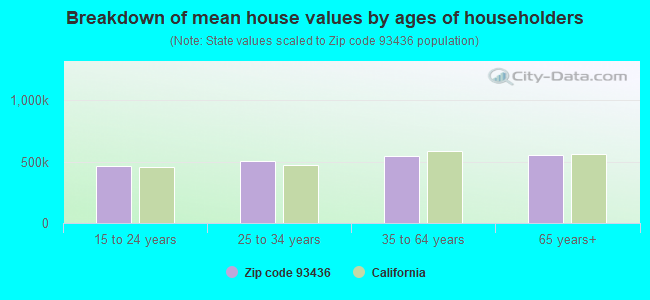
Estimated median house/condo value in 2022: $475,819
93436:
$475,819
California:
$715,900
According to our research of California and other state lists, there were 64 registered sex offenders living in 93436 zip code as of April 27, 2024. The ratio of all residents to sex offenders in zip code 93436 is 886 to 1. The ratio of registered sex offenders to all residents in this zip code is near the state average.
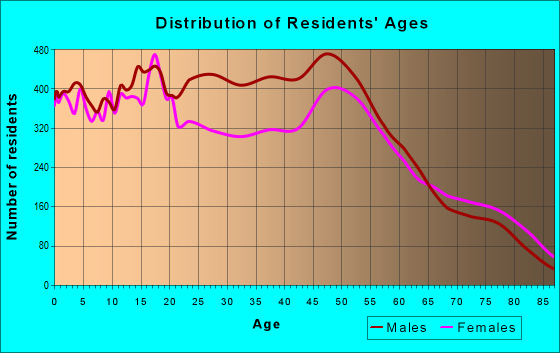
Median resident age:
This zip code:
36.5 years
California median age:
37.9 years
Average household size:
This zip code:
2.8 people
California:
2.8 people
Averages for the 2020 tax year for zip code 93436, filed in 2021:
Average Adjusted Gross Income (AGI) in 2020: $56,473 (Individual Income Tax Returns)
Here:
$56,473
State:
$95,910
Salary/wage: $48,804 (reported on 82.5% of returns)
Here:
$48,804
State:
$77,331
(% of AGI for various income ranges: 1377.0% for AGIs below $25k, 3950.6% for AGIs $25k-50k, 7147.1% for AGIs $50k-75k, 10033.5% for AGIs $75k-100k, 18119.3% for AGIs $100k-200k, 63192.0% for AGIs over 200k)
Taxable interest for individuals: $753 (reported on 32.9% of returns)
This zip code:
$753
California:
$2,294
(% of AGI for various income ranges: 11.2% for AGIs below $25k, 17.2% for AGIs $25k-50k, 35.0% for AGIs $50k-75k, 64.1% for AGIs $75k-100k, 104.2% for AGIs $100k-200k, 749.3% for AGIs over 200k)
Ordinary dividends: $3,704 (reported on 11.9% of returns)
Here:
$3,704
State:
$10,949
(% of AGI for various income ranges: 12.5% for AGIs below $25k, 22.4% for AGIs $25k-50k, 57.2% for AGIs $50k-75k, 97.8% for AGIs $75k-100k, 208.4% for AGIs $100k-200k, 1836.0% for AGIs over 200k)
Net capital gain/loss in AGI: +$11,578 (reported on 11.2% of returns)
Here:
+$11,578
State:
+$49,306
(% of AGI for various income ranges: 4.2% for AGIs below $25k, 14.6% for AGIs $25k-50k, 41.4% for AGIs $50k-75k, 121.6% for AGIs $75k-100k, 396.2% for AGIs $100k-200k, 14398.7% for AGIs over 200k)
Profit/loss from business: +$12,174 (reported on 11.2% of returns)
Here:
+$12,174
State:
+$15,671
(% of AGI for various income ranges: 95.6% for AGIs below $25k, 108.2% for AGIs $25k-50k, 211.2% for AGIs $50k-75k, 253.1% for AGIs $75k-100k, 543.2% for AGIs $100k-200k, 3508.0% for AGIs over 200k)
Taxable individual retirement arrangement distribution: $18,933 (reported on 6.5% of returns)
93436:
$18,933
California:
$23,505
(% of AGI for various income ranges: 32.6% for AGIs below $25k, 49.6% for AGIs $25k-50k, 125.9% for AGIs $50k-75k, 299.0% for AGIs $75k-100k, 730.7% for AGIs $100k-200k, 4316.7% for AGIs over 200k)
Self-employed (Keogh) retirement plans: $18,850 (reported on 0.2% of returns)
93436:
$18,850
California:
$30,163
(% of AGI for various income ranges: 4.8% for AGIs $25k-50k, 55.3% for AGIs $100k-200k)
Total itemized deductions: $29,813 (reported on 8.9% of returns)
Here:
$29,813
State:
$39,517
(% of AGI for various income ranges: 44.7% for AGIs below $25k, 116.8% for AGIs $25k-50k, 370.3% for AGIs $50k-75k, 670.3% for AGIs $75k-100k, 1549.4% for AGIs $100k-200k, 8536.7% for AGIs over 200k)
Charity contributions: $6,245 (reported on 6.5% of returns)
Here:
$6,245
State:
$12,598
(% of AGI for various income ranges: 2.0% for AGIs below $25k, 13.3% for AGIs $25k-50k, 38.8% for AGIs $50k-75k, 79.4% for AGIs $75k-100k, 266.2% for AGIs $100k-200k, 1830.7% for AGIs over 200k)
Taxes paid: $7,632 (reported on 8.9% of returns)
93436:
$7,632
State:
$8,807
(% of AGI for various income ranges: 6.5% for AGIs below $25k, 22.8% for AGIs $25k-50k, 94.1% for AGIs $50k-75k, 202.0% for AGIs $75k-100k, 468.8% for AGIs $100k-200k, 1538.7% for AGIs over 200k)
Earned income credit: $2,221 (reported on 16.9% of returns)
Here:
$2,221
State:
$2,074
(% of AGI for various income ranges: 98.8% for AGIs below $25k, 80.2% for AGIs $25k-50k, 1.3% for AGIs $50k-75k)
Percentage of individuals using paid preparers for their 2020 taxes: 92.9%
Here:
93%
State:
92%
(% for various income ranges: 91.5% for AGIs below $25k, 93.1% for AGIs $25k-50k, 93.4% for AGIs $50k-75k, 94.0% for AGIs $75k-100k, 94.4% for AGIs $100k-200k, 94.8% for AGIs over 200k)
Averages for the 2012 tax year for zip code 93436, filed in 2013:
Average Adjusted Gross Income (AGI) in 2012: $49,455 (Individual Income Tax Returns)
Here:
$49,455
State:
$72,726
Salary/wage: $42,898 (reported on 84.1% of returns)
Here:
$42,898
State:
$59,079
(% of AGI for various income ranges: 78.6% for AGIs below $25k, 80.4% for AGIs $25k-50k, 75.9% for AGIs $50k-75k, 72.8% for AGIs $75k-100k, 71.6% for AGIs $100k-200k, 49.1% for AGIs over 200k)
Taxable interest for individuals: $872 (reported on 33.8% of returns)
This zip code:
$872
California:
$2,146
(% of AGI for various income ranges: 0.7% for AGIs below $25k, 0.5% for AGIs $25k-50k, 0.7% for AGIs $50k-75k, 0.5% for AGIs $75k-100k, 0.5% for AGIs $100k-200k, 1.0% for AGIs over 200k)
Ordinary dividends: $3,217 (reported on 14.0% of returns)
Here:
$3,217
State:
$9,308
(% of AGI for various income ranges: 0.8% for AGIs below $25k, 0.5% for AGIs $25k-50k, 0.7% for AGIs $50k-75k, 0.9% for AGIs $75k-100k, 1.1% for AGIs $100k-200k, 1.9% for AGIs over 200k)
Net capital gain/loss in AGI: +$3,799 (reported on 10.1% of returns)
Here:
+$3,799
State:
+$30,460
(% of AGI for various income ranges: 0.1% for AGIs $50k-75k, 0.6% for AGIs $75k-100k, 1.0% for AGIs $100k-200k, 4.8% for AGIs over 200k)
Profit/loss from business: +$14,026 (reported on 11.3% of returns)
Here:
+$14,026
State:
+$17,064
(% of AGI for various income ranges: 5.6% for AGIs below $25k, 2.9% for AGIs $25k-50k, 2.3% for AGIs $50k-75k, 2.0% for AGIs $75k-100k, 2.6% for AGIs $100k-200k, 7.1% for AGIs over 200k)
Taxable individual retirement arrangement distribution: $14,079 (reported on 9.0% of returns)
93436:
$14,079
California:
$19,557
(% of AGI for various income ranges: 1.8% for AGIs below $25k, 1.4% for AGIs $25k-50k, 2.2% for AGIs $50k-75k, 2.5% for AGIs $75k-100k, 2.9% for AGIs $100k-200k, 5.4% for AGIs over 200k)
Self-employment retirement plans: $12,771 (reported on 0.3% of returns)
93436:
$12,771
California:
$24,530
Total itemized deductions: $22,743 (25% of AGI, reported on 30.2% of returns)
Here:
$22,743
State:
$34,004
Here:
24.7% of AGI
State:
22.7% of AGI
(% of AGI for various income ranges: 7.0% for AGIs below $25k, 8.8% for AGIs $25k-50k, 13.4% for AGIs $50k-75k, 16.0% for AGIs $75k-100k, 17.5% for AGIs $100k-200k, 18.5% for AGIs over 200k)
Charity contributions: $2,935 (reported on 23.6% of returns)
Here:
$2,935
State:
$4,659
(% of AGI for various income ranges: 0.4% for AGIs below $25k, 0.7% for AGIs $25k-50k, 1.1% for AGIs $50k-75k, 1.7% for AGIs $75k-100k, 2.0% for AGIs $100k-200k, 2.2% for AGIs over 200k)
Taxes paid: $7,405 (reported on 30.1% of returns)
93436:
$7,405
State:
$14,448
(% of AGI for various income ranges: 1.2% for AGIs below $25k, 1.9% for AGIs $25k-50k, 3.5% for AGIs $50k-75k, 4.8% for AGIs $75k-100k, 6.6% for AGIs $100k-200k, 8.4% for AGIs over 200k)
Earned income credit: $2,288 (reported on 20.0% of returns)
Here:
$2,288
State:
$2,286
(% of AGI for various income ranges: 6.6% for AGIs below $25k, 1.3% for AGIs $25k-50k)
Percentage of individuals using paid preparers for their 2012 taxes: 56.8%
Here:
57%
State:
64%
(% for various income ranges: 52.9% for AGIs below $25k, 57.2% for AGIs $25k-50k, 59.7% for AGIs $50k-75k, 59.9% for AGIs $75k-100k, 61.2% for AGIs $100k-200k, 73.3% for AGIs over 200k)
Averages for the 2004 tax year for zip code 93436, filed in 2005:
Average Adjusted Gross Income (AGI) in 2004: $43,455 (Individual Income Tax Returns)
Here:
$43,455
State:
$58,600
Salary/wage: $38,851 (reported on 84.1% of returns)
Here:
$38,851
State:
$49,455
(% of AGI for various income ranges: 131.0% for AGIs below $10k, 76.9% for AGIs $10k-25k, 79.5% for AGIs $25k-50k, 76.8% for AGIs $50k-75k, 78.2% for AGIs $75k-100k, 65.5% for AGIs over 100k)
Taxable interest for individuals: $1,225 (reported on 46.4% of returns)
This zip code:
$1,225
California:
$2,365
(% of AGI for various income ranges: 4.6% for AGIs below $10k, 1.5% for AGIs $10k-25k, 1.0% for AGIs $25k-50k, 1.4% for AGIs $50k-75k, 1.0% for AGIs $75k-100k, 1.5% for AGIs over 100k)
Taxable dividends: $2,686 (reported on 19.2% of returns)
Here:
$2,686
State:
$4,746
(% of AGI for various income ranges: 3.9% for AGIs below $10k, 0.9% for AGIs $10k-25k, 0.8% for AGIs $25k-50k, 0.9% for AGIs $50k-75k, 1.0% for AGIs $75k-100k, 1.8% for AGIs over 100k)
Net capital gain/loss: +$6,895 (reported on 14.3% of returns)
Here:
+$6,895
State:
+$23,418
(% of AGI for various income ranges: -1.0% for AGIs below $10k, 0.2% for AGIs $10k-25k, 0.2% for AGIs $25k-50k, 0.7% for AGIs $50k-75k, 1.1% for AGIs $75k-100k, 6.9% for AGIs over 100k)
Profit/loss from business: +$12,730 (reported on 12.2% of returns)
Here:
+$12,730
State:
+$16,826
(% of AGI for various income ranges: -2.5% for AGIs below $10k, 4.8% for AGIs $10k-25k, 2.9% for AGIs $25k-50k, 2.5% for AGIs $50k-75k, 2.4% for AGIs $75k-100k, 5.7% for AGIs over 100k)
IRA payment deduction: $2,979 (reported on 2.3% of returns)
93436:
$2,979
California:
$3,192
(% of AGI for various income ranges: 0.2% for AGIs $10k-25k, 0.2% for AGIs $25k-50k, 0.2% for AGIs $50k-75k, 0.2% for AGIs $75k-100k, 0.1% for AGIs over 100k)
Self-employed pension: $10,945 (reported on 0.7% of returns)
Here:
$10,945
California:
$17,688
(% of AGI for various income ranges: 0.0% for AGIs $10k-25k, 0.1% for AGIs $25k-50k, 0.1% for AGIs $50k-75k, 0.1% for AGIs $75k-100k, 0.4% for AGIs over 100k)
Total itemized deductions: $20,164 (27% of AGI, reported on 35.2% of returns)
Here:
$20,164
State:
$28,113
Here:
26.8% of AGI
State:
25.3% of AGI
(% of AGI for various income ranges: 16.6% for AGIs below $10k, 9.3% for AGIs $10k-25k, 12.6% for AGIs $25k-50k, 18.4% for AGIs $50k-75k, 19.0% for AGIs $75k-100k, 18.5% for AGIs over 100k)
Charity contributions deductions: $2,504 (3% of AGI, reported on 30.5% of returns)
Here:
$2,504
State:
$3,923
Here:
3.2% of AGI
State:
3.3% of AGI
(% of AGI for various income ranges: 0.7% for AGIs below $10k, 0.8% for AGIs $10k-25k, 1.0% for AGIs $25k-50k, 2.0% for AGIs $50k-75k, 2.3% for AGIs $75k-100k, 2.3% for AGIs over 100k)
Total tax: $5,526 (reported on 73.9% of returns)
93436:
$5,526
State:
$10,761
(% of AGI for various income ranges: 3.3% for AGIs below $10k, 3.7% for AGIs $10k-25k, 6.1% for AGIs $25k-50k, 8.4% for AGIs $50k-75k, 9.9% for AGIs $75k-100k, 14.9% for AGIs over 100k)
Earned income credit: $1,759 (reported on 16.2% of returns)
Here:
$1,759
State:
$1,763
Percentage of individuals using paid preparers for their 2004 taxes: 64.6%
Here:
65%
State:
66%
(% for various income ranges: 55.0% for AGIs below $10k, 66.9% for AGIs $10k-25k, 66.1% for AGIs $25k-50k, 65.8% for AGIs $50k-75k, 65.4% for AGIs $75k-100k, 68.6% for AGIs over 100k)
Likely homosexual households (counted as self-reported same-sex unmarried-partner households)
Lesbian couples: 0.1% of all households
Gay men: 0.1% of all households
Household received Food Stamps/SNAP in the past 12 months: 3,712 Household did not receive Food Stamps/SNAP in the past 12 months: 15,029
Women who had a birth in the past 12 months: 503 (365 now married, 138 unmarried) Women who did not have a birth in the past 12 months: 11,053 (4,668 now married, 6,373 unmarried)
Housing units in zip code 93436 with a mortgage: 6,499 (600 second mortgage, 467 both second mortgage and home equity loan) Houses without a mortgage: 93
Median monthly owner costs for units with a mortgage: $2,101 Median monthly owner costs for units without a mortgage: $622
Residents with income below the poverty level in 2022:
This zip code:
14.6%
Whole state:
12.2%
Residents with income below 50% of the poverty level in 2022:
This zip code:
7.8%
Whole state:
6.2%
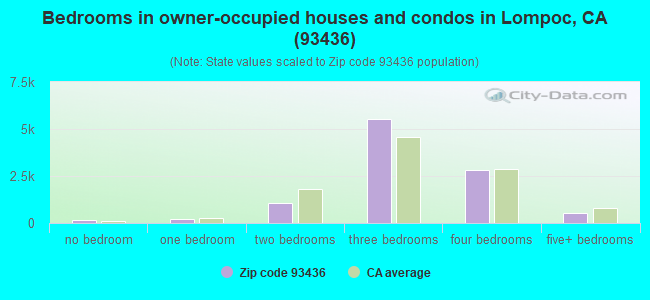
Median number of rooms in houses and condos:
Here:
5.9
State:
6.0
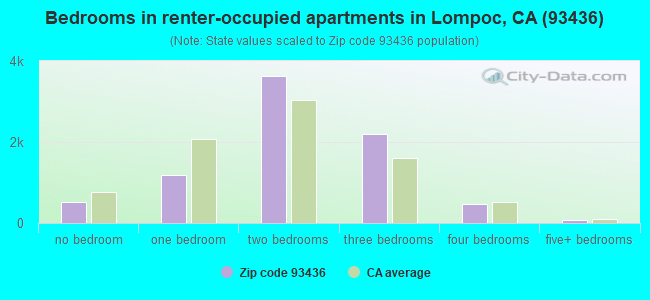
Median number of rooms in apartments:
Here:
4.2
State:
3.9
Notable locations in this zip code not listed on our city pages
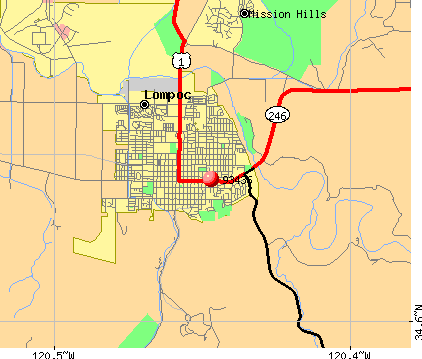
Notable locations in zip code 93436: Jalama Ranch (A), Parks-Lead Siding (B), Village Country Club (C), Post (D), Rancho de los Llanitos (E), Rancho San Julian (F), La Salle Stables (G), Bella Cavalli Farms (H), Acin Farms (I), Lompoc City Landfill (J), Cojo Ranch (K), White Hills Siding (L), Four Corners (M), Point Conception Lighthouse (N), Santa Barbara County Building (O), Lompoc Museum Associates Research Library (P), Lompoc Museum (Q), Lompoc Civic Center (R), Lompoc Civic Auditorium (S), Lompoc City Hall (T). Display/hide their locations on the map
Shopping Centers: Westside Shopping Center (1), Vons Shopping Center (2), Vandenberg Village Shopping Center (3), North Side Shopping Center (4), Mission Plaza Shopping Center (5), Mission Hills Shopping Center (6), Lompoc Shopping Center (7), Lompoc Plaza Shopping Center (8), Lompoc North Shopping Center (9). Display/hide their locations on the map
Churches in zip code 93436 include: Abundant Life Fellowship Church (A), The Church of Jesus Christ of Latter Day Saints (B), First Apostolic Church (C), First Christian Church (D), First Presbyterian Church (E), Iglesia Pueble de Dios (F), Mission Hills Baptist Church (G), North Avenue Baptist Church (H), Peace Lutheran Church (I). Display/hide their locations on the map
Creeks: Gaviotito Creek (A), Gasper Creek (B), Espada Creek (C), Escondido Creek (D), El Jaro Creek (E), El Callejon Creek (F), Atascoso Creek (G), Ytias Creek (H), San Miguelito Creek (I). Display/hide their locations on the map
Parks in zip code 93436 include: Anderson Recreation Center (1), Beattie Park (2), College Park (3), Ingram Park (4), Ken Adam Park (5), Pioneer Park (6), Thompson Park (7), Westvale Park (8), Manville Park (9). Display/hide their locations on the map
6,997 married couples with children.
4,521 single-parent households (1,634 men, 2,887 women).
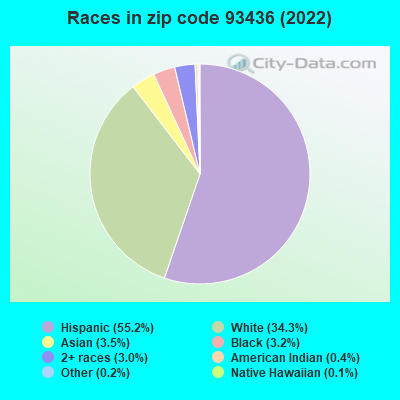
57.9% of residents of 93436 zip code speak English at home.
36.6% of residents speak Spanish at home (58% very well, 19% well, 17% not well, 7% not at all).
1.3% of residents speak other Indo-European language at home (85% very well, 10% well, 5% not well).
2.8% of residents speak Asian or Pacific Island language at home (68% very well, 17% well, 15% not well, 1% not at all).
0.9% of residents speak other language at home (62% very well, 23% well, 5% not well, 9% not at all).
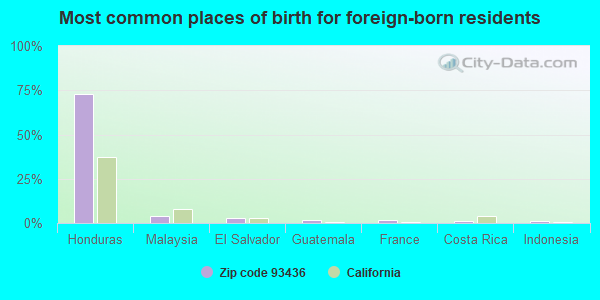
Foreign born population: 11,470 (20.8%) (39.4% of them are naturalized citizens)
This zip code:
20.8%
Whole state:
26.7%
73%Honduras
4%Malaysia
3%El Salvador
2%Guatemala
1%France
1%Costa Rica
1%Indonesia
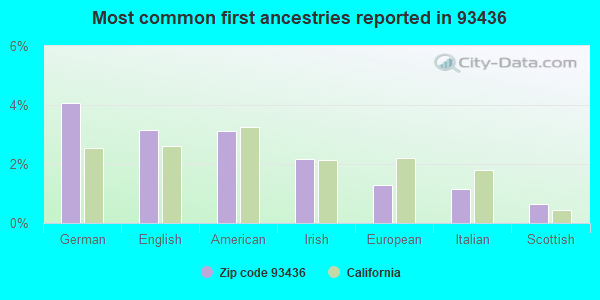
4%German
3%English
3%American
2%Irish
1%European
1%Italian
1%Scottish
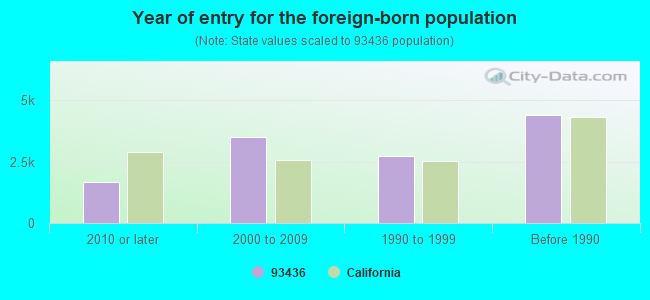
Year of entry for the foreign-born population
1,6852010 or later
3,4882000 to 2009
2,7431990 to 1999
4,404Before 1990
Major facilities with environmental interests located in this zip code:
CELITE CORPORATION (2500 MIGUELITO ROAD in LOMPOC, CA)
AIR MAJOR (AIRS/AFS) STATE MASTER (California - Hazardous Waste Tracking) - HAZARDOU WASTE PROGRAM COMPLIANCE ACTIVITY (Tracking inspections of insecticide, fungicide, and rodenticide, and toxic substances) CRITERIA AND HAZARDOUS AIR POLLUTANT INVENTORY (Inventory of air pollution sources) AIR MAJOR ("Best Available" air pollution technologies tracking) Large Quantity Generators, more that 1000 kg of hazardous waste/month (Resource Conservation and Recovery Act (tracking hazardous waste)) - notification TRI REPORTER (Tracking of toxic chemicals releasing facilities) Business SIC classification: MISCELLANEOUS NONMETALLIC MINERALS, EXCEPT FUELS; MINERALS AND EARTHS, GROUND OR OTHERWISE TREATED; NONMETALLIC MINERAL PRODUCTS; REFUSE SYSTEMS Alternative names: CELITE CORP (DBA MANVILLE CORP), CELITE CORPORATION LOMPOC PLAN, CELITE CORP LOMPOC PLANT, CELITE CORP (DBA MANVILLE CORP), CELITE CORPORATION (LOMPOC PLANT), MANVILLE CORP., MANVILLE PRODUCTS CORP
LOMPOC OIL & GAS PLANT (3602 HARRIS GRADE ROAD in LOMPOC, CA)
AIR MAJOR (AIRS/AFS) OIL CONTROL (Facility Response Plan for oil discharge) STATE MASTER (California - Hazardous Waste Tracking) - HAZARDOU WASTE PROGRAM CRITERIA AND HAZARDOUS AIR POLLUTANT INVENTORY (Inventory of air pollution sources) AIR MAJOR ("Best Available" air pollution technologies tracking) HAZARDOUS WASTE BIENNIAL REPORTER (Resource Conservation and Recovery Act (tracking hazardous waste)) Small Quantity Generators, between 100 kg and 1000 kg of hazardous waste/month (Resource Conservation and Recovery Act (tracking hazardous waste)) Business SIC and NAICS classification: CRUDE PETROLEUM AND NATURAL GAS Organizations: NUEVO ENERGY COMPANY (CONTACT/GENERAL)
, PXP (CONTACT/OPERATOR)
Alternative names: LOG P, NUEVO - LOMPOC/PT. PED, NUEVO-LOMPOC/PT.PED-OIL & GAS PLANT, TORCH OPERATING CO. - LOMPOC OIL AND GAS PLANT, TORCH OPERATING CO HSP, TORCH OPERATING CO. - LOMPOC OIL AND GAS PLANT, TORCH OPER. CO. - PT. PEDERNALES
LOMPOC HONDA (1224 NORTH H STREET in LOMPOC, CA)
STATE MASTER (California - Hazardous Waste Tracking) - HAZARDOU WASTE PROGRAM Small Quantity Generators, between 100 kg and 1000 kg of hazardous waste/month (Resource Conservation and Recovery Act (tracking hazardous waste)) - notification Small Quantity Generators, between 100 kg and 1000 kg of hazardous waste/month (Resource Conservation and Recovery Act (tracking hazardous waste)) - notification Organizations: BURGER, HAD (CONTACT/OWNER)
, HAD BURGER (CONTACT/OWNER)
LOMPOC WASTEWATER PLANT (1801 W CENTRAL AVE in LOMPOC, CA)
STATE MASTER (California - Hazardous Waste Tracking) - HAZARDOU WASTE PROGRAM CRITERIA AND HAZARDOUS AIR POLLUTANT INVENTORY (Inventory of air pollution sources) National Pollutant Discharge Elimination System MAJOR (Tracking pollutant discharge elimination systems) - permit Small Quantity Generators, between 100 kg and 1000 kg of hazardous waste/month (Resource Conservation and Recovery Act (tracking hazardous waste)) - notification Business SIC classification: SEWERAGE SYSTEMS Business NAICS classification: SEWAGE TREATMENT FACILITIES. Organizations: LOMPOC, CITY OF (CONTACT/OWNER)
, CITY OF LOMPOC (CONTACT/OWNER)
Alternative names: LOMPOC, CITY OF, LOMPOC REGIONAL WASTEWATER TREATMENT FAC, LOMPOC REGIONAL WWTP
EQUILON ENTERPRISES (1000 N H ST in LOMPOC, CA) . Federal Facility
STATE MASTER (California - Hazardous Waste Tracking) - HAZARDOU WASTE PROGRAM Small Quantity Generators, between 100 kg and 1000 kg of hazardous waste/month (Resource Conservation and Recovery Act (tracking hazardous waste)) - notification Organizations: USA GASOLINE CORPORATION (CONTACT/OPERATOR)
Alternative names: SHELL OIL CO
JIFFY LUBE #0658 (503 N H ST in LOMPOC, CA)
Small Quantity Generators, between 100 kg and 1000 kg of hazardous waste/month (Resource Conservation and Recovery Act (tracking hazardous waste)) - notification STATE MASTER (California - Used Oil Recycling System ) - USED OIL RECYCLING, USED OIL PROGRAM Organizations: PETRILLI EDWARD (CONTACT/OWNER)
Alternative names: JIFFY LUBE #658
LOMPOC HOSPITAL DIST (508 E HICKORY AVE in LOMPOC, CA)
STATE MASTER (California - Hazardous Waste Tracking) - HAZARDOU WASTE PROGRAM CRITERIA AND HAZARDOUS AIR POLLUTANT INVENTORY (Inventory of air pollution sources) Small Quantity Generators, between 100 kg and 1000 kg of hazardous waste/month (Resource Conservation and Recovery Act (tracking hazardous waste)) - notification Business SIC classification: GENERAL MEDICAL AND SURGICAL HOSPITALS Alternative names: LOMPOC HEALTHCARE DISTRICT, LOMPOC HOSPITAL DISTRICT
LOMPOC VALLEY FORD (1201 N H ST in LOMPOC, CA)
STATE MASTER (California - Hazardous Waste Tracking) - HAZARDOU WASTE PROGRAM Small Quantity Generators, between 100 kg and 1000 kg of hazardous waste/month (Resource Conservation and Recovery Act (tracking hazardous waste)) - notification
FILLMORE (LEONORA) ELEMENTARY (1211 E. PINE AVE. in LOMPOC, CA)
(National Center for Education Statistics) - STATE ID-6045645 Organizations: LOMPOC UNIFIED (SCHOOL DISTRICT)
HAPGOOD (ARTHUR) ELEMENTARY (324 SOUTH A ST. in LOMPOC, CA)
(National Center for Education Statistics) - STATE ID-6045561 Organizations: LOMPOC UNIFIED (SCHOOL DISTRICT)
LA CANADA ELEMENTARY (620 W. NORTH AVE. in LOMPOC, CA)
(National Center for Education Statistics) - STATE ID-6045611 Organizations: LOMPOC UNIFIED (SCHOOL DISTRICT)
LA HONDA ELEMENTARY (1213 NORTH A ST. in LOMPOC, CA)
(National Center for Education Statistics) - STATE ID-6045629 Organizations: LOMPOC UNIFIED (SCHOOL DISTRICT)
LOMPOC MIDDLE (234 SOUTH N ST. in LOMPOC, CA)
(National Center for Education Statistics) - STATE ID-6060016 Organizations: LOMPOC UNIFIED (SCHOOL DISTRICT)
Housing units lacking complete plumbing facilities: 1.3% Housing units lacking complete kitchen facilities: 2.3%
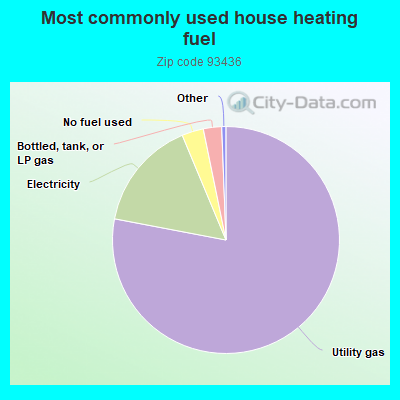
78.0%Utility gas
15.7%Electricity
3.1%No fuel used
2.6%Bottled, tank, or LP gas
Population in 1990: 49,960. Population change in the 1990s: +1,776 (+3.6%).
Place of birth for U.S.-born residents:
This state: 33,399
Northeast: 2,004
Midwest: 2,524
South: 2,543
West: 2,077
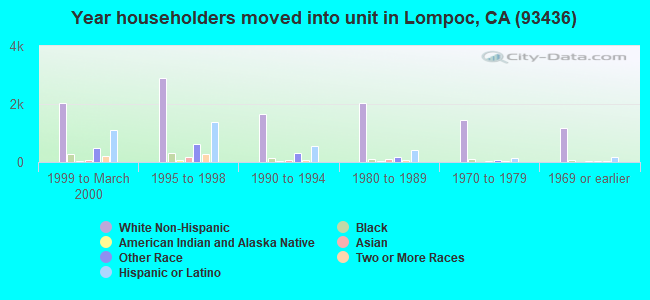
54% of the 93436 zip code residents lived in the same house 5 years ago. Out of people who lived in different houses, 72% lived in this county. Out of people who lived in different counties, 50% lived in California.
85% of the 93436 zip code residents lived in the same house 1 year ago. Out of people who lived in different houses, 63% moved from this county. Out of people who lived in different houses, 24% moved from different county within same state. Out of people who lived in different houses, 7% moved from different state. Out of people who lived in different houses, 4% moved from abroad.
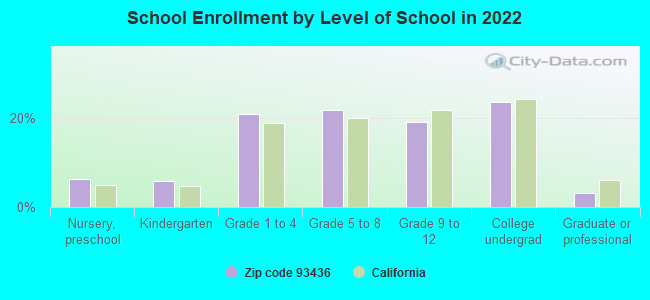
Private vs. public school enrollment:
Students in private schools in grades 1 to 8 (elementary and middle school): 421
Here:
6.6%
California:
10.5%
Students in private schools in grades 9 to 12 (high school): 71
Here:
2.5%
California:
8.5%
Students in private undergraduate colleges: 257
Here:
7.2%
California:
15.9%
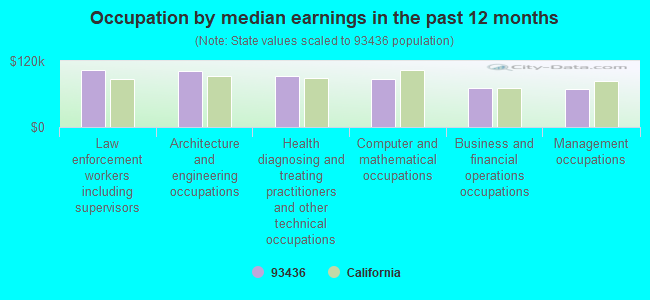
Occupation by median earnings in the past 12 months ($)
103,383Law enforcement workers including supervisors
102,437Architecture and engineering occupations
92,699Health diagnosing and treating practitioners and other technical occupations
88,072Computer and mathematical occupations
70,079Business and financial operations occupations
68,538Management occupations
Companies with biggest federal contracts located in this zip code (LOMPOC, CA):
LIFE OPTIONS, VOCATIONAL AND R (116 N I ST) : $24,572,862 in 33 contractsfrom 1999 to 2006
Contracts for Food Services by Air Force Signed by year:2000: $1,290,259; 2001: $6,045,161; 2002: $3,797,948; 2003: $3,576,588; 2004: $3,319,093; 2005: $3,605,706; 2006: $147,360.
Biggest contracts:
$3,876,465 with Air Force for Food Services. Signed on 2001-10-16. Completion date: 2002-09-30.
$3,872,948, same as above.Signed on 2002-10-01. Completion date: 2003-09-30.
$3,820,590, same as above.Signed on 2003-10-01. Completion date: 2004-09-30.
$3,606,438, same as above.Signed on 2005-10-01. Completion date: 2006-09-30.
AIR PROPERTY MAINTENANCE COMPA (3910 CONSTELLATION RD SUIT; small business) : $13,363,619 in 294 contractsfrom 1999 to 2006
Contracts for Landscaping/Groundskeeping Services, Maintenance, Repair or Alteration of Real Property -- Hospitals and Infirmaries, Maintenance, Repair or Alteration of Real Property -- Miscellaneous Buildings, Maintenance, Repair or Alteration of Real Property -- Troop Housing Facilities, and moreby Air Force, Navy, United States Coast Guard (disused code: now 7008) Signed by year:2000: $1,157,134; 2001: $553,906; 2002: $1,825,802; 2003: $2,212,816; 2004: $3,673,209; 2005: $3,171,107; 2006: $747,645.
Biggest contracts:
$1,038,018 with Air Force for Landscaping/Groundskeeping Services. Taking place in KS. Signed on 2004-11-01. Completion date: 2005-09-30.
$1,031,414 with Air Force for Landscaping/Groundskeeping Services. Taking place in TX. Signed on 2005-10-01. Completion date: 2008-09-30.
$883,441 with Air Force for Landscaping/Groundskeeping Services. Taking place in KS. Signed on 2005-10-01. Completion date: 2006-09-30.
$654,004 with Navy for Maintenance, Repair or Alteration of Real Property -- Hospitals and Infirmaries. Signed on 2002-09-30. Completion date: 2003-04-15.
SPACEPORT SYSTEMS INTERNATIONA (3769 CONSTELLATION ROAD) : $7,801,202 in 37 contractsfrom 1999 to 2006
Contracts for Defense Missile and Space Systems -- Management and Support (R&D), Services -- Basic Research (R&D), Space Vehicle Handling and Servicing Equipment, Space Vehicles, and moreby Air Force, NASA Signed by year:2000: $1,582,026; 2001: $297,365; 2002: $497,000; 2003: $0; 2004: $3,848,963; 2005: $655,135; 2006: $15,822.
Biggest contracts:
$793,294 with Air Force for Defense Missile and Space Systems -- Management and Support (R&D). Signed on 2004-06-10. Completion date: 2005-06-15.
$750,000, same as above.Signed on 2004-03-23. Completion date: 2005-06-15.
$750,000, same as above.Signed on 2004-05-25. Completion date: 2005-06-15.
$674,891 with Air Force for Services -- Basic Research (R&D). Signed on 1999-11-08. Completion date: 2000-06-30.
U-TECH SERVICES CORPORATION (1015 NORTH A ST; small business) 1000 employees, $0 revenue. : $4,670,779 in 16 contractsfrom 1999 to 2001
Contracts for Telephone and/or Communications Services (includes Telegraph, Telex, and Cablevision Services), ADP Facility Operation and Maintenance Services, Maintenance, Repair and Rebuilding of Equipment -- Miscellaneous, Engineering and Technical Services, and moreby Air Force Signed by year:2000: $1,861,144; 2001: $1,684,882; 2002: $0; 2003: $0; 2004: $0; 2005: $0; 2006: $0.
Biggest contracts:
$1,474,818 with Air Force for Telephone and/or Communications Services (includes Telegraph, Telex, and Cablevision Services). Signed on 2001-10-01. Completion date: 2001-09-30.
$442,807 with Air Force for ADP Facility Operation and Maintenance Services. Taking place in OK. Signed on 1999-12-28. Completion date: 2000-03-31.
$420,946, same as above.Signed on 1999-12-03. Completion date: 1999-12-31.
$360,000 with Air Force for Maintenance, Repair and Rebuilding of Equipment -- Miscellaneous. Signed on 2000-09-30. Completion date: 2001-09-30.
NORTH COAST CONSTRUCTION (216 WEST WALNUT; small business) : $2,998,308 in 17 contractsfrom 2002 to 2006
Contracts for Maintenance, Repair or Alteration of Real Property -- Other Administrative Facilities and Service Buildings, Construction of Structures and Facilities -- Miscellaneous Buildings, Construction of Structures and Facilities -- Other Administrative Facilities and Service Buildings, Construction of Structures and Facilities -- Other Non-Building Facilities, and moreby Air Force, Army Signed by year:2000: $0; 2001: $0; 2002: $704,135; 2003: $827,252; 2004: $1,440,180; 2005: -$6,660; 2006: $33,401.
Biggest contracts:
$699,833 with Air Force for Maintenance, Repair or Alteration of Real Property -- Other Administrative Facilities and Service Buildings. Signed on 2002-07-19. Completion date: 2003-03-17.
$689,534 with Air Force for Construction of Structures and Facilities -- Miscellaneous Buildings. Signed on 2004-12-21. Completion date: 2005-10-17.
$618,122 with Army for Construction of Structures and Facilities -- Other Administrative Facilities and Service Buildings. Signed on 2004-04-01. Completion date: 2005-06-24.
$527,384 with Air Force for Construction of Structures and Facilities -- Other Non-Building Facilities. Signed on 2003-06-02. Completion date: 2004-01-28.
BUREAU OF PRISONS (3600 GUARD RD) : $2,770,248 in 35 contractsfrom 1999 to 2001
Contracts for Hardware, Commercial, Electric Portable and Hand Lighting Equipment, Miscellaneous Electric Power and Distribution Equipment, Cable, Cord, and Wire Assemblies: Communications Equipment, and moreby Defense Logistics Agency Signed by year:2000: $1,623,105; 2001: $644,066; 2002: $0; 2003: $0; 2004: $0; 2005: $0; 2006: $0.
Biggest contracts:
$367,520 with Defense Logistics Agency for Hardware, Commercial. Signed on 2000-03-12. Completion date: 2000-08-19.
$280,832 with Defense Logistics Agency for Electric Portable and Hand Lighting Equipment. Signed on 2000-09-05. Completion date: 2001-07-06.
$211,350 with Defense Logistics Agency for Hardware, Commercial. Signed on 2000-12-18. Completion date: 2001-06-21.
$199,320, same as above.Signed on 2000-08-08. Completion date: 2001-02-07.
UNICOR FEDERAL PRISON INDUSTRI (3600 GUARD RD) : $1,276,357 in 47 contractsfrom 2001 to 2006
Contracts for Antennas, Waveguides, and Related Equipment, Hardware, Commercial, Food, Oils and Fats, Miscellaneous Electric Power and Distribution Equipment, and moreby Defense Logistics Agency, Bureau of Prisoners/Federal Prison System, Air Force, Army, and others Signed by year:2000: $0; 2001: $4,502; 2002: $487,834; 2003: $165,107; 2004: $135,302; 2005: $191,708; 2006: $291,904.
Biggest contracts:
$334,455 with Defense Logistics Agency for Antennas, Waveguides, and Related Equipment. Signed on 2002-02-27. Completion date: 2003-05-23.
$137,816 with Defense Logistics Agency for Hardware, Commercial. Signed on 2006-05-16. Completion date: 2006-12-12.
$98,112 with Bureau of Prisoners/Federal Prison System for Food, Oils and Fats. Signed on 2003-10-17. Effective on 2003-10-01. Completion date: 2004-09-30.
$94,149 with Air Force for Miscellaneous Electric Power and Distribution Equipment. Signed on 2006-02-23. Completion date: 2006-10-31.
MOONSPACE CORPORATION (245A BURTON MESA DRIVE; small business) : $720,610 in 5 contractsfrom 1999 to 2002
Contracts for Library Services by Air Force Signed by year:2000: $289,438; 2001: $110,586; 2002: $110,586; 2003: $0; 2004: $0; 2005: $0; 2006: $0.
Biggest contracts:
$219,438 with Air Force for Library Services. Signed on 2000-10-01. Completion date: 2001-09-30.
$210,000, same as above.Signed on 1999-10-28. Completion date: 2000-09-30.
$110,586, same as above.Signed on 2002-03-21. Completion date: 2002-09-30.
$110,586, same as above.Signed on 2001-10-01. Completion date: 2002-03-31.
CITYAPPLIANCE SALES AND SVC (224 NORTH A ST; small business) : $460,027 in 7 contractsfrom 2001 to 2005
Contracts for Maintenance, Repair and Rebuilding of Equipment -- Household and Commercial Furnishings and Appliances, Maintenance, Repair and Rebuilding of Equipment -- Railway Equipment by Air Force Signed by year:2000: $0; 2001: $69,778; 2002: $58,692; 2003: $93,930; 2004: $124,863; 2005: $112,764; 2006: $0.
Biggest contracts:
$125,739 with Air Force for Maintenance, Repair and Rebuilding of Equipment -- Household and Commercial Furnishings and Appliances. Signed on 2003-10-01. Completion date: 2004-09-30.
$124,863, same as above.Signed on 2004-10-01. Completion date: 2005-09-30.
$112,764, same as above.Signed on 2005-10-01. Completion date: 2006-09-30.
$58,692 with Air Force for Maintenance, Repair and Rebuilding of Equipment -- Railway Equipment. Signed on 2002-11-08. Completion date: 2003-09-30.
ROBINSON'S DRYCLEANERS (1202 W OCEAN AVE; small business) : $258,201 in 2 contractsin 2005
$182,446 with Air Force for Laundry and DryCleaning Services. Signed on 2005-10-01. Completion date: 2006-09-30.
$75,755, same as above.Signed on 2005-04-01. Completion date: 2005-09-30.
Top industries in this zip code by the number of employees in 2005:
2005 - 2018 National Fire Incident Reporting System (NFIRS) incidents
According to the data from the years 2005 - 2018 the average number of fires per year is 153. The highest number of reported fire incidents - 194 took place in 2017, and the least - 116 in 2014. The data has a growing trend.
When looking into fire subcategories, the most incidents belonged to: Outside Fires (57.1%), and Structure Fires (27.5%).
Fire incident types reported to NFIRS in Zip Code 93436
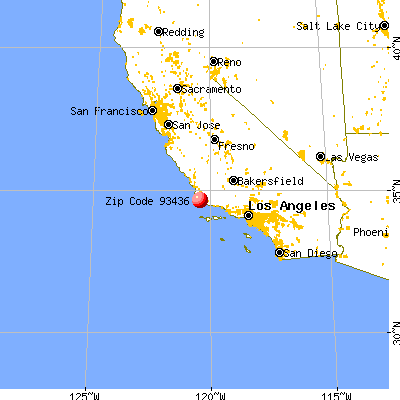


 Nearest zip codes: 93427, 93440, 93437, 93455, 93463, 93429.


 According to the data from the years 2005 - 2018 the average number of fires per year is 153. The highest number of reported fire incidents - 194 took place in 2017, and the least - 116 in 2014. The data has a growing trend.
 When looking into fire subcategories, the most incidents belonged to: Outside Fires (57.1%), and Structure Fires (27.5%).