Estimated zip code population in 2022: 14,044 Zip code population in 2010: 11,880 Zip code population in 2000: 9,160
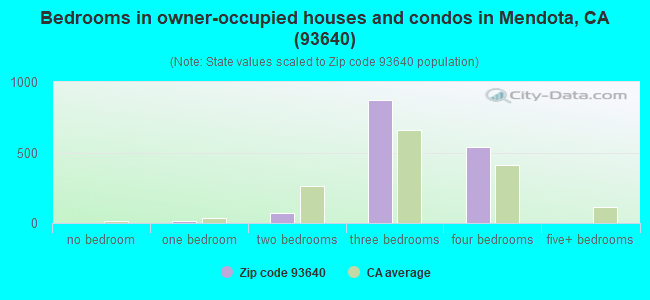
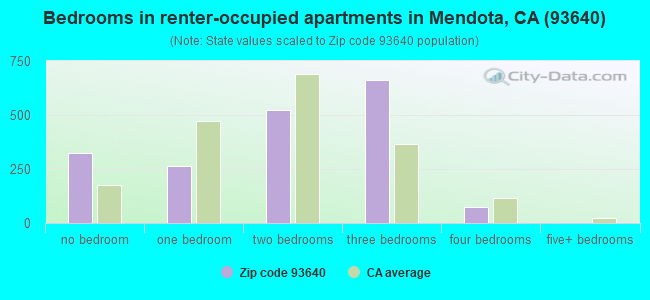
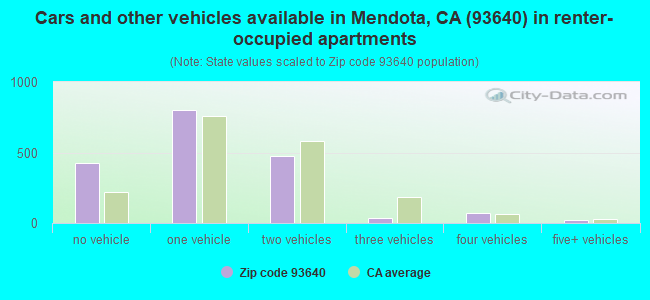
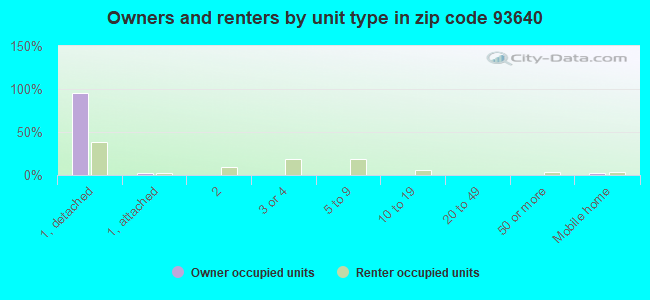
Houses and condos: 3,514 Renter-occupied apartments: 1,835
% of renters here:
55%
State:
44%
March 2022 cost of living index in zip code 93640: 96.0 (near average, U.S. average is 100)
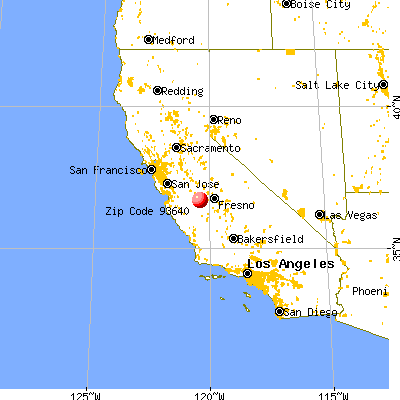
Land area: 113.1 sq. mi. Water area: 1.4 sq. mi.
Population density: 124 people per square mile
(very low).
OSM Map
General Map
Google Map
MSN Map
OSM Map
General Map
Google Map
MSN Map
OSM Map
General Map
Google Map
MSN Map
OSM Map
General Map
Google Map
MSN Map
Please wait while loading the map...
Real estate property taxes paid for housing units in 2022:
This zip code:
0.6% ($1,480)
California:
0.7% ($4,831)
Median real estate property taxes paid for housing units with mortgages in 2022: $1,514 (0.6%) Median real estate property taxes paid for housing units with no mortgage in 2022: $1,209 (0.5%)
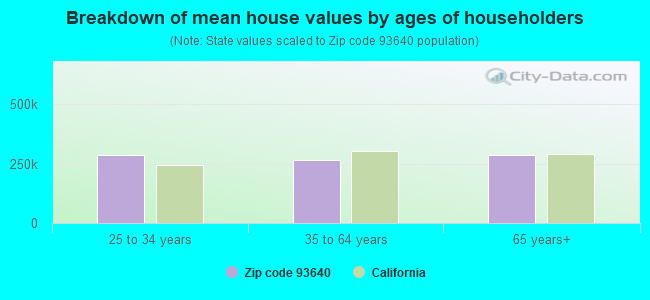
Estimated median house/condo value in 2022: $260,387
93640:
$260,387
California:
$715,900
According to our research of California and other state lists, there were 7 registered sex offenders living in 93640 zip code as of April 27, 2024. The ratio of all residents to sex offenders in zip code 93640 is 1,834 to 1. The ratio of registered sex offenders to all residents in this zip code is much lower than the state average.
Median resident age:
This zip code:
27.5 years
California median age:
37.9 years
Average household size:
This zip code:
3.9 people
California:
2.8 people
Averages for the 2020 tax year for zip code 93640, filed in 2021:
Average Adjusted Gross Income (AGI) in 2020: $31,947 (Individual Income Tax Returns)
Here:
$31,947
State:
$95,910
Salary/wage: $23,314 (reported on 91.5% of returns)
Here:
$23,314
State:
$77,331
(% of AGI for various income ranges: 2830.5% for AGIs below $25k, 5510.8% for AGIs $25k-50k, 8712.9% for AGIs $50k-75k, 10357.8% for AGIs $75k-100k, 24233.3% for AGIs $100k-200k)
Taxable interest for individuals: $175 (reported on 10.1% of returns)
This zip code:
$175
California:
$2,294
(% of AGI for various income ranges: 1.1% for AGIs below $25k, 3.0% for AGIs $25k-50k, 3.4% for AGIs $50k-75k, 8.9% for AGIs $75k-100k, 160.0% for AGIs $100k-200k)
Ordinary dividends: $1,675 (reported on 0.6% of returns)
Here:
$1,675
State:
$10,949
(% of AGI for various income ranges: 1.2% for AGIs below $25k, 15.4% for AGIs $50k-75k)
Net capital gain/loss in AGI: +$1,850 (reported on 0.9% of returns)
Here:
+$1,850
State:
+$49,306
(% of AGI for various income ranges: 10.5% for AGIs $25k-50k)
Profit/loss from business: +$11,316 (reported on 6.0% of returns)
Here:
+$11,316
State:
+$15,671
(% of AGI for various income ranges: 65.5% for AGIs below $25k, 185.0% for AGIs $25k-50k, 312.6% for AGIs $50k-75k, 618.9% for AGIs $75k-100k)
Total itemized deductions: $24,917 (reported on 0.9% of returns)
Here:
$24,917
State:
$39,517
(% of AGI for various income ranges: 51.0% for AGIs $25k-50k, 272.6% for AGIs $50k-75k)
Charity contributions: $2,925 (reported on 0.6% of returns)
Here:
$2,925
State:
$12,598
(% of AGI for various income ranges: 2.5% for AGIs below $25k, 26.0% for AGIs $50k-75k)
Taxes paid: $6,000 (reported on 1.1% of returns)
93640:
$6,000
State:
$8,807
(% of AGI for various income ranges: 15.5% for AGIs $25k-50k, 73.1% for AGIs $50k-75k)
Earned income credit: $2,547 (reported on 34.7% of returns)
Here:
$2,547
State:
$2,074
(% of AGI for various income ranges: 280.8% for AGIs below $25k, 247.4% for AGIs $25k-50k, 9.4% for AGIs $50k-75k)
Percentage of individuals using paid preparers for their 2020 taxes: 86.9%
Here:
87%
State:
92%
(% for various income ranges: 83.0% for AGIs below $25k, 89.2% for AGIs $25k-50k, 93.2% for AGIs $50k-75k, 93.3% for AGIs $75k-100k, 87.5% for AGIs $100k-200k)
Averages for the 2012 tax year for zip code 93640, filed in 2013:
Average Adjusted Gross Income (AGI) in 2012: $24,845 (Individual Income Tax Returns)
Here:
$24,845
State:
$72,726
Salary/wage: $19,304 (reported on 96.1% of returns)
Here:
$19,304
State:
$59,079
(% of AGI for various income ranges: 79.1% for AGIs below $25k, 80.0% for AGIs $25k-50k, 87.1% for AGIs $50k-75k, 111.2% for AGIs $75k-100k)
Taxable interest for individuals: $319 (reported on 7.8% of returns)
This zip code:
$319
California:
$2,146
(% of AGI for various income ranges: 1.9% for AGIs $75k-100k)
Profit/loss from business: +$10,210 (reported on 5.6% of returns)
Here:
+$10,210
State:
+$17,064
(% of AGI for various income ranges: 2.9% for AGIs below $25k, 2.0% for AGIs $25k-50k, 3.7% for AGIs $50k-75k)
Total itemized deductions: $25,008 (31% of AGI, reported on 4.8% of returns)
Here:
$25,008
State:
$34,004
Here:
31.1% of AGI
State:
22.7% of AGI
(% of AGI for various income ranges: 0.9% for AGIs below $25k, 2.9% for AGIs $25k-50k, 8.2% for AGIs $50k-75k, 13.0% for AGIs $75k-100k, 27.1% for AGIs $100k-200k)
Charity contributions: $1,374 (reported on 3.5% of returns)
Here:
$1,374
State:
$4,659
(% of AGI for various income ranges: 0.1% for AGIs $25k-50k, 0.5% for AGIs $50k-75k, 2.5% for AGIs $75k-100k)
Taxes paid: $4,700 (reported on 4.8% of returns)
93640:
$4,700
State:
$14,448
(% of AGI for various income ranges: 0.1% for AGIs below $25k, 0.6% for AGIs $25k-50k, 1.7% for AGIs $50k-75k, 3.3% for AGIs $75k-100k, 4.7% for AGIs $100k-200k)
Earned income credit: $2,723 (reported on 42.2% of returns)
Here:
$2,723
State:
$2,286
(% of AGI for various income ranges: 8.4% for AGIs below $25k, 3.1% for AGIs $25k-50k)
Percentage of individuals using paid preparers for their 2012 taxes: 75.6%
Here:
76%
State:
64%
(% for various income ranges: 73.4% for AGIs below $25k, 80.4% for AGIs $25k-50k, 76.2% for AGIs $50k-75k, 80.0% for AGIs $75k-100k, 66.7% for AGIs $100k-200k)
Averages for the 2004 tax year for zip code 93640, filed in 2005:
Average Adjusted Gross Income (AGI) in 2004: $20,412 (Individual Income Tax Returns)
Here:
$20,412
State:
$58,600
Salary/wage: $16,638 (reported on 97.1% of returns)
Here:
$16,638
State:
$49,455
(% of AGI for various income ranges: 86.2% for AGIs below $10k, 79.3% for AGIs $10k-25k, 85.3% for AGIs $25k-50k, 84.1% for AGIs $50k-75k, 80.1% for AGIs $75k-100k, 29.8% for AGIs over 100k)
Taxable interest for individuals: $719 (reported on 9.7% of returns)
This zip code:
$719
California:
$2,365
(% of AGI for various income ranges: 0.2% for AGIs below $10k, 0.2% for AGIs $10k-25k, 0.3% for AGIs $25k-50k, 0.6% for AGIs $50k-75k, 0.1% for AGIs $75k-100k, 2.2% for AGIs over 100k)
Taxable dividends: $788 (reported on 0.8% of returns)
Here:
$788
State:
$4,746
Net capital gain/loss: +$5,206 (reported on 0.8% of returns)
Here:
+$5,206
State:
+$23,418
Profit/loss from business: +$7,794 (reported on 5.1% of returns)
Here:
+$7,794
State:
+$16,826
(% of AGI for various income ranges: 2.5% for AGIs below $10k, 1.9% for AGIs $10k-25k, 2.4% for AGIs $25k-50k, 2.9% for AGIs $50k-75k)
IRA payment deduction: $2,273 (reported on 0.3% of returns)
93640:
$2,273
California:
$3,192
Total itemized deductions: $15,042 (24% of AGI, reported on 4.7% of returns)
Here:
$15,042
State:
$28,113
Here:
23.8% of AGI
State:
25.3% of AGI
(% of AGI for various income ranges: 1.2% for AGIs $10k-25k, 4.2% for AGIs $25k-50k, 7.9% for AGIs $50k-75k, 12.7% for AGIs $75k-100k, 10.7% for AGIs over 100k)
Charity contributions deductions: $1,344 (2% of AGI, reported on 3.9% of returns)
Here:
$1,344
State:
$3,923
Here:
2.1% of AGI
State:
3.3% of AGI
(% of AGI for various income ranges: 0.1% for AGIs $10k-25k, 0.3% for AGIs $25k-50k, 0.9% for AGIs $50k-75k, 1.3% for AGIs $75k-100k, 0.6% for AGIs over 100k)
Total tax: $1,971 (reported on 37.0% of returns)
93640:
$1,971
State:
$10,761
(% of AGI for various income ranges: 0.8% for AGIs below $10k, 1.6% for AGIs $10k-25k, 3.4% for AGIs $25k-50k, 7.7% for AGIs $50k-75k, 9.3% for AGIs $75k-100k, 15.1% for AGIs over 100k)
Earned income credit: $2,251 (reported on 53.3% of returns)
Here:
$2,251
State:
$1,763
Percentage of individuals using paid preparers for their 2004 taxes: 54.7%
Here:
55%
State:
66%
(% for various income ranges: 47.9% for AGIs below $10k, 51.4% for AGIs $10k-25k, 68.1% for AGIs $25k-50k, 73.8% for AGIs $50k-75k, 77.4% for AGIs $75k-100k, 85.7% for AGIs over 100k)
Household received Food Stamps/SNAP in the past 12 months: 1,163 Household did not receive Food Stamps/SNAP in the past 12 months: 2,327
Women who had a birth in the past 12 months: 162 (135 now married, 27 unmarried) Women who did not have a birth in the past 12 months: 3,030 (1,134 now married, 1,899 unmarried)
Housing units in zip code 93640 with a mortgage: 1,163 (5 second mortgage, 5 home equity loan) Median monthly owner costs for units with a mortgage: $1,373 Median monthly owner costs for units without a mortgage: $483
Residents with income below the poverty level in 2022:
This zip code:
34.0%
Whole state:
12.2%
Residents with income below 50% of the poverty level in 2022:
This zip code:
17.9%
Whole state:
6.2%
Median number of rooms in houses and condos:
Here:
5.4
State:
6.0
Median number of rooms in apartments:
Here:
4.0
State:
3.9
Notable locations in this zip code not listed on our city pages
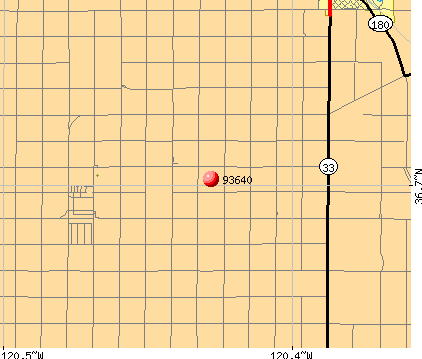
Notable locations in zip code 93640: Coit Ranch (A), Murietta Farm (B), Mowry Ranch (C), Helm Ranch (D), Yearout Ranch (E), Mendota Community Center (F), Mendota City Hall (G), Fresno County Fire Protection District Station 96 Mendota (H). Display/hide their locations on the map
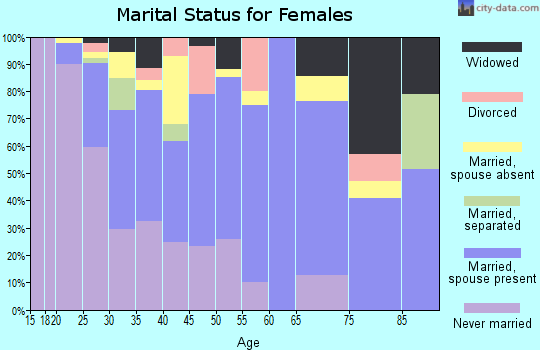
3,045 married couples with children.
1,367 single-parent households (337 men, 1,030 women).
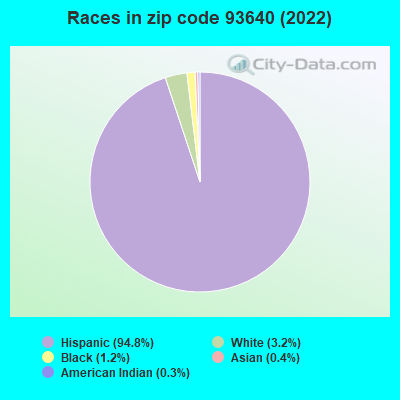
15.7% of residents of 93640 zip code speak English at home.
84.4% of residents speak Spanish at home (33% very well, 15% well, 15% not well, 37% not at all).
0.1% of residents speak other Indo-European language at home (100% very well).
0.3% of residents speak Asian or Pacific Island language at home (100% very well).
1.7% of residents speak other language at home (5% very well, 8% well, 88% not well).
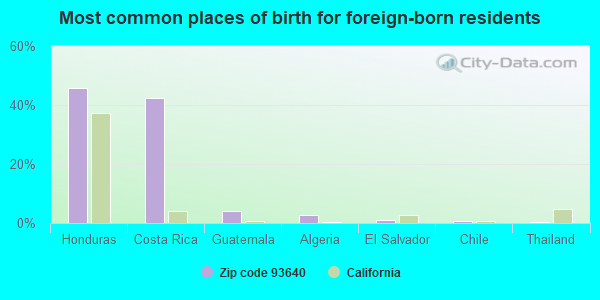
Foreign born population: 7,441 (53.0%) (16.5% of them are naturalized citizens)
This zip code:
53.0%
Whole state:
26.7%
46%Honduras
42%Costa Rica
4%Guatemala
3%Algeria
1%El Salvador
1%Chile
0%Thailand
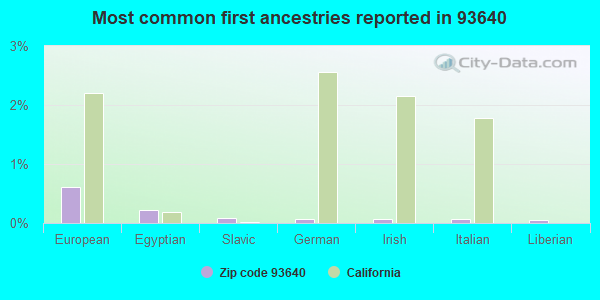
1%European
0%Egyptian
0%Slavic
0%German
0%Irish
0%Italian
0%Liberian
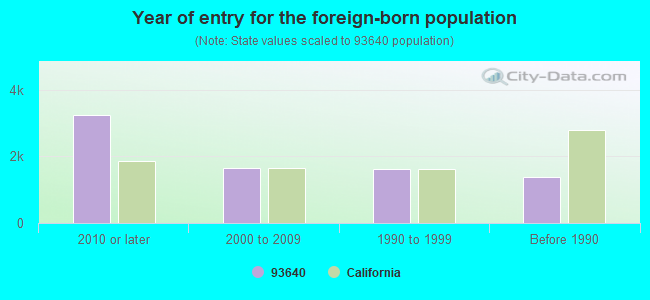
Year of entry for the foreign-born population
3,2362010 or later
1,6562000 to 2009
1,6081990 to 1999
1,383Before 1990
Facilities with environmental interests located in this zip code:
MCCABE ELEMENTARY (250 S. DERRICK ST. in MENDOTA, CA)
(National Center for Education Statistics) - STATE ID-6006969 Organizations: MENDOTA UNIFIED (SCHOOL DISTRICT)
MCCABE JUNIOR HIGH (250 S. DERRICK ST. in MENDOTA, CA)
(National Center for Education Statistics) - STATE ID-6006977 Organizations: MENDOTA UNIFIED (SCHOOL DISTRICT)
MENDOTA COMMUNITY DAY (241 SMOOT AVE. in MENDOTA, CA)
(National Center for Education Statistics) - STATE ID-1030725 Organizations: MENDOTA UNIFIED (SCHOOL DISTRICT)
MENDOTA CONTINUATION HIGH (211 SMOOT in MENDOTA, CA)
(National Center for Education Statistics) - STATE ID-1030261 Organizations: MENDOTA UNIFIED (SCHOOL DISTRICT)
MENDOTA HIGH (1200 BELMONT ST. in MENDOTA, CA)
(National Center for Education Statistics) - STATE ID-1030493 Organizations: MENDOTA UNIFIED (SCHOOL DISTRICT)
AES MENDOTA (400 GUILLEN PARKWAY in MENDOTA, CA)
AIR MAJOR (AIRS/AFS) CRITERIA AND HAZARDOUS AIR POLLUTANT INVENTORY (Inventory of air pollution sources) Small Quantity Generators, between 100 kg and 1000 kg of hazardous waste/month (Resource Conservation and Recovery Act (tracking hazardous waste)) Business SIC classification: ELECTRIC SERVICES Alternative names: MENDOTA BIOMASS POWER
ALTA VISTA GIN/MURRIETA FARMS (5854 SOUTH SAN DIEGO in MENDOTA, CA)
AIR SYNTHETIC MINOR (AIRS/AFS) CRITERIA AND HAZARDOUS AIR POLLUTANT INVENTORY (Inventory of air pollution sources) Business SIC classification: COTTON GINNING
INTERAGENCY TREATMENT CTR (ADAMS AVE AND THE SAN LUIS in MENDOTA, CA)
Small Quantity Generators, between 100 kg and 1000 kg of hazardous waste/month (Resource Conservation and Recovery Act (tracking hazardous waste)) Organizations: QUANC IND INC BILL COTTON PRES (CONTACT/OWNER)
MENDOTA CITY (ADJACENT TO EAST MENDOTA; T13S in MENDOTA, CA)
CRITERIA AND HAZARDOUS AIR POLLUTANT INVENTORY (Inventory of air pollution sources) Business SIC classification: REFUSE SYSTEMS Business NAICS classification: SOLID WASTE LANDFILL.
Housing units lacking complete plumbing facilities: 1.4% Housing units lacking complete kitchen facilities: 1.3%
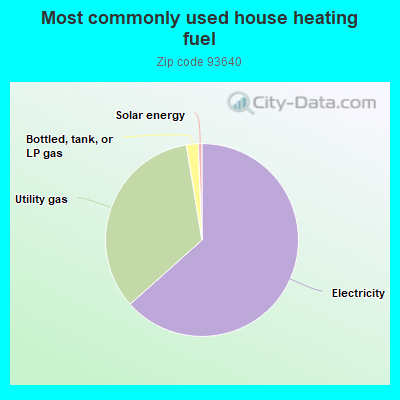
63.4%Electricity
34.0%Utility gas
2.0%Bottled, tank, or LP gas
0.6%Solar energy
Population in 1990: 8,839. Population change in the 1990s: +321 (+3.6%).
Place of birth for U.S.-born residents:
This state: 5,898
Northeast: 150
Midwest: 66
South: 250
West: 150
63% of the 93640 zip code residents lived in the same house 5 years ago. Out of people who lived in different houses, 83% lived in this county. Out of people who lived in different counties, 50% lived in California.
92% of the 93640 zip code residents lived in the same house 1 year ago. Out of people who lived in different houses, 11% moved from this county. Out of people who lived in different houses, 87% moved from different county within same state. Out of people who lived in different houses, 5% moved from different state. Out of people who lived in different houses, 2% moved from abroad.
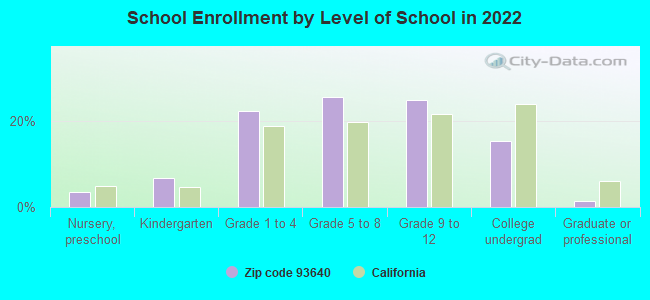
Private vs. public school enrollment:
Students in private schools in grades 1 to 8 (elementary and middle school):
Here:
0.0%
California:
10.5%
Students in private schools in grades 9 to 12 (high school): 24
Here:
2.2%
California:
8.5%
Students in private undergraduate colleges: 22
Here:
3.4%
California:
15.9%
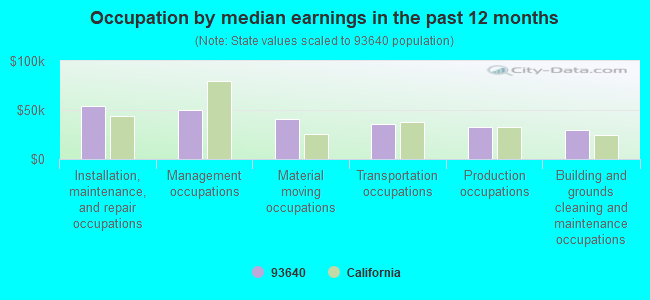
Occupation by median earnings in the past 12 months ($)
54,055Installation, maintenance, and repair occupations
50,162Management occupations
40,563Material moving occupations
36,184Transportation occupations
32,596Production occupations
29,848Building and grounds cleaning and maintenance occupations
Top industries in this zip code by the number of employees in 2005:
Health Care and Social Assistance: All Other Outpatient Care Centers (20-49 employees: 1 establishment)
Utilities: Fossil Fuel Electric Power Generation (20-49: 1)
Wholesale Trade: Fresh Fruit and Vegetable Merchant Wholesalers (20-49: 1)
Accommodation and Food Services: Limited-Service Restaurants (10-19: 1)
Utilities: Water Supply and Irrigation Systems (10-19: 1)
People in group quarters in 2010:
22 people in workers' group living quarters and job corps centers
People in group quarters in 2000:
135 people in agriculture workers' dormitories on farms
7 people in other noninstitutional group quarters
2 people in unknown juvenile institutions
Fatal accident statistics in 2014:
Fatal accident count: 2
Vehicles involved in fatal accidents: 5
Fatal accidents caused by drunken drivers: 1
Fatalities: 2
Persons involved in fatal accidents: 7
Pedestrians involved in fatal accidents: 1
Fatal accident statistics in 2012:
Fatal accident count: 1
Vehicles involved in fatal accidents: 2
Fatal accidents caused by drunken drivers: 0
Fatalities: 3
Persons involved in fatal accidents: 4
Pedestrians involved in fatal accidents: 0
Home Mortgage Disclosure Act Aggregated Statistics For Year 2009 (Based on 8 partial tracts)
A) FHA, FSA/RHS & VA Home Purchase Loans
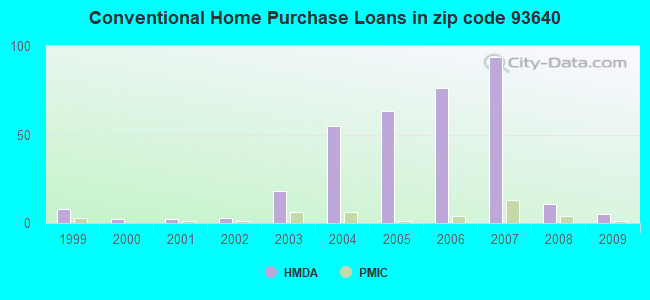
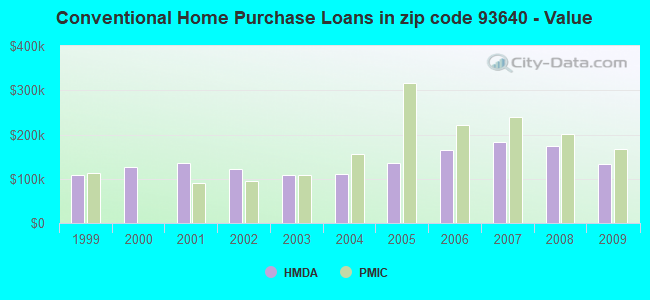
B) Conventional Home Purchase Loans
C) Refinancings
D) Home Improvement Loans
F) Non-occupant Loans on < 5 Family Dwellings (A B C & D)
G) Loans On Manufactured Home Dwelling (A B C & D)
Number
Average Value
Number
Average Value
Number
Average Value
Number
Average Value
Number
Average Value
Number
Average Value
LOANS ORIGINATED
28
$119,454
5
$133,584
9
$157,104
0
$0
2
$76,170
1
$96,010
APPLICATIONS APPROVED, NOT ACCEPTED
2
$99,865
1
$76,110
3
$134,400
0
$0
1
$114,210
0
$0
APPLICATIONS DENIED
13
$116,053
4
$117,915
16
$130,818
4
$47,848
2
$108,825
1
$153,460
APPLICATIONS WITHDRAWN
4
$124,465
1
$185,320
3
$174,280
1
$37,180
0
$0
0
$0
FILES CLOSED FOR INCOMPLETENESS
2
$154,600
0
$0
1
$159,320
0
$0
0
$0
0
$0
Aggregated Statistics For Year 2008 (Based on 8 partial tracts)
A) FHA, FSA/RHS & VA Home Purchase Loans
B) Conventional Home Purchase Loans
C) Refinancings
D) Home Improvement Loans
F) Non-occupant Loans on < 5 Family Dwellings (A B C & D)
G) Loans On Manufactured Home Dwelling (A B C & D)
Number
Average Value
Number
Average Value
Number
Average Value
Number
Average Value
Number
Average Value
Number
Average Value
LOANS ORIGINATED
6
$175,657
11
$174,878
15
$152,074
3
$66,950
5
$132,478
0
$0
APPLICATIONS APPROVED, NOT ACCEPTED
0
$0
1
$179,190
14
$133,554
1
$91,520
2
$156,940
0
$0
APPLICATIONS DENIED
3
$210,433
5
$211,346
44
$156,589
9
$77,521
5
$178,458
2
$79,325
APPLICATIONS WITHDRAWN
0
$0
3
$185,447
9
$147,343
1
$70,880
2
$131,410
0
$0
FILES CLOSED FOR INCOMPLETENESS
0
$0
1
$217,140
4
$196,635
0
$0
1
$154,060
0
$0
Aggregated Statistics For Year 2007 (Based on 8 partial tracts)
A) FHA, FSA/RHS & VA Home Purchase Loans
B) Conventional Home Purchase Loans
C) Refinancings
D) Home Improvement Loans
E) Loans on Dwellings For 5+ Families
F) Non-occupant Loans on < 5 Family Dwellings (A B C & D)
G) Loans On Manufactured Home Dwelling (A B C & D)
Number
Average Value
Number
Average Value
Number
Average Value
Number
Average Value
Number
Average Value
Number
Average Value
Number
Average Value
LOANS ORIGINATED
1
$214,300
94
$182,620
80
$167,681
13
$104,881
0
$0
12
$157,599
1
$129,490
APPLICATIONS APPROVED, NOT ACCEPTED
1
$96,980
22
$154,281
23
$164,424
4
$124,885
0
$0
5
$201,524
0
$0
APPLICATIONS DENIED
1
$217,090
52
$186,673
100
$182,007
15
$69,921
1
$307,690
10
$233,873
1
$190,860
APPLICATIONS WITHDRAWN
0
$0
20
$165,527
30
$178,330
4
$135,775
0
$0
2
$151,570
0
$0
FILES CLOSED FOR INCOMPLETENESS
0
$0
10
$162,525
17
$193,923
0
$0
0
$0
2
$136,335
0
$0
Aggregated Statistics For Year 2006 (Based on 8 partial tracts)
B) Conventional Home Purchase Loans
C) Refinancings
D) Home Improvement Loans
E) Loans on Dwellings For 5+ Families
F) Non-occupant Loans on < 5 Family Dwellings (A B C & D)
G) Loans On Manufactured Home Dwelling (A B C & D)
Number
Average Value
Number
Average Value
Number
Average Value
Number
Average Value
Number
Average Value
Number
Average Value
LOANS ORIGINATED
76
$164,656
116
$146,872
16
$101,111
0
$0
21
$159,221
1
$113,270
APPLICATIONS APPROVED, NOT ACCEPTED
28
$149,603
37
$153,805
6
$82,078
0
$0
6
$190,708
1
$92,460
APPLICATIONS DENIED
31
$155,494
95
$141,987
27
$96,513
1
$135,810
11
$168,081
2
$69,545
APPLICATIONS WITHDRAWN
28
$170,664
69
$148,992
5
$159,648
0
$0
7
$139,804
0
$0
FILES CLOSED FOR INCOMPLETENESS
4
$143,115
23
$154,726
1
$139,140
0
$0
4
$126,532
0
$0
Aggregated Statistics For Year 2005 (Based on 8 partial tracts)
A) FHA, FSA/RHS & VA Home Purchase Loans
B) Conventional Home Purchase Loans
C) Refinancings
D) Home Improvement Loans
E) Loans on Dwellings For 5+ Families
F) Non-occupant Loans on < 5 Family Dwellings (A B C & D)
G) Loans On Manufactured Home Dwelling (A B C & D)
Number
Average Value
Number
Average Value
Number
Average Value
Number
Average Value
Number
Average Value
Number
Average Value
Number
Average Value
LOANS ORIGINATED
1
$93,790
63
$135,093
106
$128,948
10
$93,206
1
$3,564,730
34
$145,824
2
$135,680
APPLICATIONS APPROVED, NOT ACCEPTED
0
$0
23
$117,433
24
$96,504
0
$0
0
$0
6
$121,203
1
$46,900
APPLICATIONS DENIED
0
$0
23
$141,475
79
$125,705
22
$101,529
1
$120,590
10
$154,567
2
$83,025
APPLICATIONS WITHDRAWN
1
$159,170
19
$141,856
64
$134,547
9
$203,556
0
$0
9
$134,751
0
$0
FILES CLOSED FOR INCOMPLETENESS
0
$0
1
$143,350
12
$120,582
1
$95,930
0
$0
0
$0
0
$0
Aggregated Statistics For Year 2004 (Based on 8 partial tracts)
A) FHA, FSA/RHS & VA Home Purchase Loans
B) Conventional Home Purchase Loans
C) Refinancings
D) Home Improvement Loans
E) Loans on Dwellings For 5+ Families
F) Non-occupant Loans on < 5 Family Dwellings (A B C & D)
G) Loans On Manufactured Home Dwelling (A B C & D)
Number
Average Value
Number
Average Value
Number
Average Value
Number
Average Value
Number
Average Value
Number
Average Value
Number
Average Value
LOANS ORIGINATED
6
$105,088
55
$110,475
65
$98,215
7
$66,267
1
$252,520
21
$98,138
1
$68,450
APPLICATIONS APPROVED, NOT ACCEPTED
1
$130,630
10
$121,869
30
$101,548
2
$92,150
0
$0
7
$84,170
0
$0
APPLICATIONS DENIED
0
$0
16
$140,348
81
$100,209
8
$91,081
0
$0
4
$84,425
2
$115,300
APPLICATIONS WITHDRAWN
4
$100,698
8
$117,360
51
$105,101
2
$76,810
0
$0
6
$134,842
0
$0
FILES CLOSED FOR INCOMPLETENESS
0
$0
1
$85,380
9
$99,226
0
$0
0
$0
0
$0
0
$0
Aggregated Statistics For Year 2003 (Based on 8 partial tracts)
A) FHA, FSA/RHS & VA Home Purchase Loans
B) Conventional Home Purchase Loans
C) Refinancings
D) Home Improvement Loans
F) Non-occupant Loans on < 5 Family Dwellings (A B C & D)
Number
Average Value
Number
Average Value
Number
Average Value
Number
Average Value
Number
Average Value
LOANS ORIGINATED
8
$79,948
18
$109,289
70
$93,764
2
$43,135
8
$80,344
APPLICATIONS APPROVED, NOT ACCEPTED
2
$66,465
5
$95,884
17
$93,936
1
$55,070
1
$77,940
APPLICATIONS DENIED
2
$87,795
7
$103,314
44
$103,350
3
$27,393
7
$103,216
APPLICATIONS WITHDRAWN
2
$84,840
4
$88,475
33
$100,119
0
$0
2
$113,850
FILES CLOSED FOR INCOMPLETENESS
0
$0
1
$55,660
5
$66,748
0
$0
0
$0
Aggregated Statistics For Year 2002 (Based on 2 partial tracts)
B) Conventional Home Purchase Loans
C) Refinancings
D) Home Improvement Loans
F) Non-occupant Loans on < 5 Family Dwellings (A B C & D)
Number
Average Value
Number
Average Value
Number
Average Value
Number
Average Value
LOANS ORIGINATED
3
$122,380
8
$143,412
1
$80,520
1
$50,060
APPLICATIONS APPROVED, NOT ACCEPTED
0
$0
1
$151,440
0
$0
0
$0
APPLICATIONS DENIED
3
$74,817
3
$122,170
1
$46,520
0
$0
APPLICATIONS WITHDRAWN
0
$0
3
$107,637
0
$0
0
$0
FILES CLOSED FOR INCOMPLETENESS
0
$0
1
$100,550
0
$0
0
$0
Aggregated Statistics For Year 2001 (Based on 2 partial tracts)
A) FHA, FSA/RHS & VA Home Purchase Loans
B) Conventional Home Purchase Loans
C) Refinancings
D) Home Improvement Loans
Number
Average Value
Number
Average Value
Number
Average Value
Number
Average Value
LOANS ORIGINATED
1
$60,490
2
$134,650
7
$122,866
1
$39,010
APPLICATIONS APPROVED, NOT ACCEPTED
0
$0
1
$48,400
2
$118,695
0
$0
APPLICATIONS DENIED
0
$0
2
$124,845
5
$94,662
1
$5,010
APPLICATIONS WITHDRAWN
0
$0
0
$0
4
$156,032
0
$0
FILES CLOSED FOR INCOMPLETENESS
0
$0
0
$0
1
$103,260
0
$0
Aggregated Statistics For Year 2000 (Based on 2 partial tracts)
B) Conventional Home Purchase Loans
C) Refinancings
D) Home Improvement Loans
Number
Average Value
Number
Average Value
Number
Average Value
LOANS ORIGINATED
2
$125,890
2
$83,855
1
$66,750
APPLICATIONS APPROVED, NOT ACCEPTED
1
$100,750
1
$83,440
0
$0
APPLICATIONS DENIED
1
$74,890
4
$68,265
1
$16,060
APPLICATIONS WITHDRAWN
0
$0
2
$110,140
0
$0
FILES CLOSED FOR INCOMPLETENESS
0
$0
1
$65,500
0
$0
Aggregated Statistics For Year 1999 (Based on 3 partial tracts)
A) FHA, FSA/RHS & VA Home Purchase Loans
B) Conventional Home Purchase Loans
C) Refinancings
D) Home Improvement Loans
F) Non-occupant Loans on < 5 Family Dwellings (A B C & D)
2006 - 2018 National Fire Incident Reporting System (NFIRS) incidents
Based on the data from the years 2006 - 2018 the average number of fires per year is 92. The highest number of fire incidents - 155 took place in 2017, and the least - 19 in 2006. The data has a rising trend.
When looking into fire subcategories, the most reports belonged to: Outside Fires (65.5%), and Mobile Property/Vehicle Fires (16.1%).
Fire incident types reported to NFIRS in Zip Code 93640


 Nearest zip codes: 93668, 93622, 93608, 93660, 93630, 93665.


 Based on the data from the years 2006 - 2018 the average number of fires per year is 92. The highest number of fire incidents - 155 took place in 2017, and the least - 19 in 2006. The data has a rising trend.
 When looking into fire subcategories, the most reports belonged to: Outside Fires (65.5%), and Mobile Property/Vehicle Fires (16.1%).