Estimated zip code population in 2022: 30,222 Zip code population in 2010: 29,776 Zip code population in 2000: 25,906
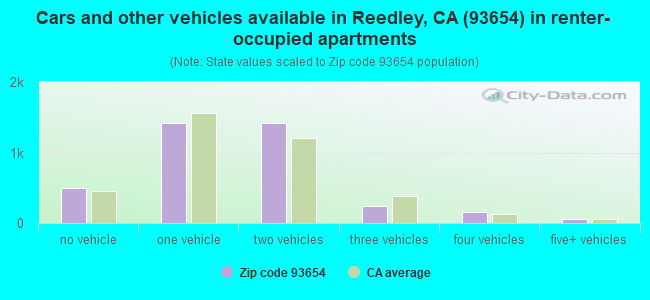
Houses and condos: 9,213 Renter-occupied apartments: 3,787
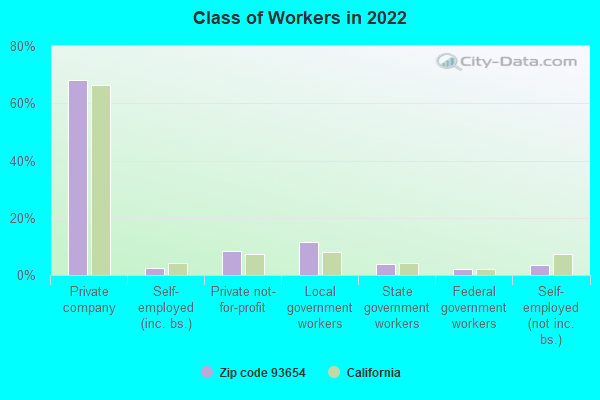
% of renters here:
43%
State:
44%
March 2022 cost of living index in zip code 93654: 95.5 (near average, U.S. average is 100)
Land area: 98.6 sq. mi. Water area: 0.5 sq. mi.
Population density: 307 people per square mile
(very low).
OSM Map
General Map
Google Map
MSN Map
OSM Map
General Map
Google Map
MSN Map
OSM Map
General Map
Google Map
MSN Map
OSM Map
General Map
Google Map
MSN Map
Please wait while loading the map...
Real estate property taxes paid for housing units in 2022:
This zip code:
0.7% ($2,363)
California:
0.7% ($4,831)
Median real estate property taxes paid for housing units with mortgages in 2022: $2,725 (0.8%) Median real estate property taxes paid for housing units with no mortgage in 2022: $1,801 (0.6%)
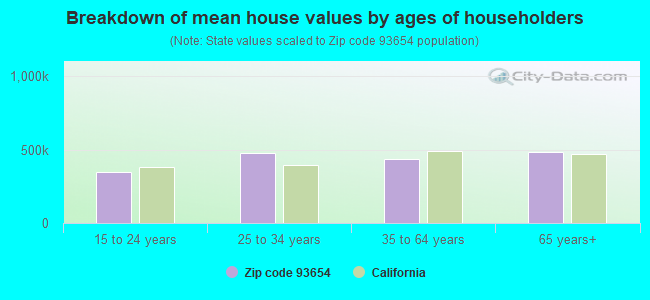
Estimated median house/condo value in 2022: $327,709
93654:
$327,709
California:
$715,900
According to our research of California and other state lists, there were 41 registered sex offenders living in 93654 zip code as of April 27, 2024. The ratio of all residents to sex offenders in zip code 93654 is 778 to 1. The ratio of registered sex offenders to all residents in this zip code is near the state average.
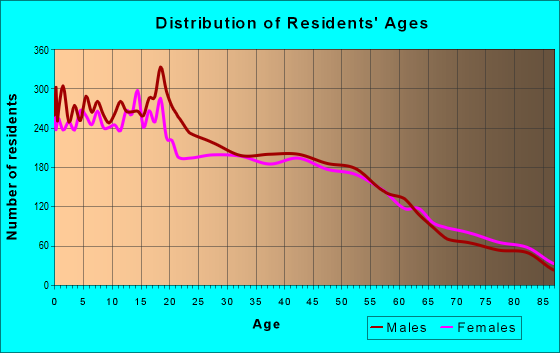
Median resident age:
This zip code:
32.7 years
California median age:
37.9 years
Average household size:
This zip code:
3.4 people
California:
2.8 people
Averages for the 2020 tax year for zip code 93654, filed in 2021:
Average Adjusted Gross Income (AGI) in 2020: $48,682 (Individual Income Tax Returns)
Here:
$48,682
State:
$95,910
Salary/wage: $40,020 (reported on 86.7% of returns)
Here:
$40,020
State:
$77,331
(% of AGI for various income ranges: 1683.0% for AGIs below $25k, 4590.1% for AGIs $25k-50k, 7978.6% for AGIs $50k-75k, 11435.1% for AGIs $75k-100k, 22918.9% for AGIs $100k-200k, 94577.5% for AGIs over 200k)
Taxable interest for individuals: $1,316 (reported on 24.3% of returns)
This zip code:
$1,316
California:
$2,294
(% of AGI for various income ranges: 12.4% for AGIs below $25k, 11.0% for AGIs $25k-50k, 41.9% for AGIs $50k-75k, 70.4% for AGIs $75k-100k, 190.2% for AGIs $100k-200k, 4745.0% for AGIs over 200k)
Ordinary dividends: $5,973 (reported on 6.7% of returns)
Here:
$5,973
State:
$10,949
(% of AGI for various income ranges: 8.9% for AGIs below $25k, 18.1% for AGIs $25k-50k, 42.4% for AGIs $50k-75k, 97.2% for AGIs $75k-100k, 296.3% for AGIs $100k-200k, 5640.0% for AGIs over 200k)
Net capital gain/loss in AGI: +$16,888 (reported on 7.1% of returns)
Here:
+$16,888
State:
+$49,306
(% of AGI for various income ranges: 4.1% for AGIs below $25k, 16.0% for AGIs $25k-50k, 54.6% for AGIs $50k-75k, 214.9% for AGIs $75k-100k, 727.6% for AGIs $100k-200k, 26240.0% for AGIs over 200k)
Profit/loss from business: +$12,407 (reported on 10.2% of returns)
Here:
+$12,407
State:
+$15,671
(% of AGI for various income ranges: 66.9% for AGIs below $25k, 76.8% for AGIs $25k-50k, 217.7% for AGIs $50k-75k, 400.5% for AGIs $75k-100k, 875.2% for AGIs $100k-200k, 10790.0% for AGIs over 200k)
Taxable individual retirement arrangement distribution: $14,748 (reported on 3.9% of returns)
93654:
$14,748
California:
$23,505
(% of AGI for various income ranges: 27.2% for AGIs below $25k, 35.6% for AGIs $25k-50k, 105.4% for AGIs $50k-75k, 222.3% for AGIs $75k-100k, 509.1% for AGIs $100k-200k, 2920.0% for AGIs over 200k)
Total itemized deductions: $31,995 (reported on 6.2% of returns)
Here:
$31,995
State:
$39,517
(% of AGI for various income ranges: 41.3% for AGIs below $25k, 97.1% for AGIs $25k-50k, 330.0% for AGIs $50k-75k, 778.2% for AGIs $75k-100k, 1909.8% for AGIs $100k-200k, 14852.5% for AGIs over 200k)
Charity contributions: $10,281 (reported on 5.0% of returns)
Here:
$10,281
State:
$12,598
(% of AGI for various income ranges: 2.2% for AGIs below $25k, 14.1% for AGIs $25k-50k, 63.8% for AGIs $50k-75k, 177.7% for AGIs $75k-100k, 485.4% for AGIs $100k-200k, 6265.0% for AGIs over 200k)
Taxes paid: $7,439 (reported on 6.0% of returns)
93654:
$7,439
State:
$8,807
(% of AGI for various income ranges: 4.3% for AGIs below $25k, 17.4% for AGIs $25k-50k, 77.4% for AGIs $50k-75k, 190.4% for AGIs $75k-100k, 506.7% for AGIs $100k-200k, 2752.5% for AGIs over 200k)
Earned income credit: $2,435 (reported on 25.1% of returns)
Here:
$2,435
State:
$2,074
(% of AGI for various income ranges: 153.1% for AGIs below $25k, 140.7% for AGIs $25k-50k, 3.9% for AGIs $50k-75k)
Percentage of individuals using paid preparers for their 2020 taxes: 87.8%
Here:
88%
State:
92%
(% for various income ranges: 85.4% for AGIs below $25k, 86.4% for AGIs $25k-50k, 89.8% for AGIs $50k-75k, 94.0% for AGIs $75k-100k, 93.4% for AGIs $100k-200k, 95.7% for AGIs over 200k)
Averages for the 2012 tax year for zip code 93654, filed in 2013:
Average Adjusted Gross Income (AGI) in 2012: $44,790 (Individual Income Tax Returns)
Here:
$44,790
State:
$72,726
Salary/wage: $32,729 (reported on 88.3% of returns)
Here:
$32,729
State:
$59,079
(% of AGI for various income ranges: 78.8% for AGIs below $25k, 79.4% for AGIs $25k-50k, 78.3% for AGIs $50k-75k, 75.9% for AGIs $75k-100k, 75.3% for AGIs $100k-200k, 17.2% for AGIs over 200k)
Taxable interest for individuals: $2,530 (reported on 24.3% of returns)
This zip code:
$2,530
California:
$2,146
(% of AGI for various income ranges: 0.5% for AGIs below $25k, 0.6% for AGIs $25k-50k, 0.8% for AGIs $50k-75k, 0.6% for AGIs $75k-100k, 1.1% for AGIs $100k-200k, 3.6% for AGIs over 200k)
Ordinary dividends: $4,203 (reported on 7.8% of returns)
Here:
$4,203
State:
$9,308
(% of AGI for various income ranges: 0.5% for AGIs below $25k, 0.4% for AGIs $25k-50k, 0.9% for AGIs $50k-75k, 0.5% for AGIs $75k-100k, 1.3% for AGIs $100k-200k, 0.8% for AGIs over 200k)
Net capital gain/loss in AGI: +$107,863 (reported on 6.5% of returns)
Here:
+$107,863
State:
+$30,460
(% of AGI for various income ranges: 0.2% for AGIs $25k-50k, 0.4% for AGIs $50k-75k, 0.4% for AGIs $75k-100k, 1.4% for AGIs $100k-200k, 70.1% for AGIs over 200k)
Profit/loss from business: +$13,077 (reported on 10.9% of returns)
Here:
+$13,077
State:
+$17,064
(% of AGI for various income ranges: 4.9% for AGIs below $25k, 2.9% for AGIs $25k-50k, 1.6% for AGIs $50k-75k, 4.1% for AGIs $75k-100k, 4.0% for AGIs $100k-200k, 2.1% for AGIs over 200k)
Taxable individual retirement arrangement distribution: $11,568 (reported on 5.3% of returns)
93654:
$11,568
California:
$19,557
(% of AGI for various income ranges: 1.0% for AGIs below $25k, 1.4% for AGIs $25k-50k, 1.7% for AGIs $50k-75k, 1.5% for AGIs $75k-100k, 2.1% for AGIs $100k-200k, 0.7% for AGIs over 200k)
Self-employment retirement plans: $18,267 (reported on 0.2% of returns)
93654:
$18,267
California:
$24,530
Total itemized deductions: $23,645 (21% of AGI, reported on 21.5% of returns)
Here:
$23,645
State:
$34,004
Here:
21.0% of AGI
State:
22.7% of AGI
(% of AGI for various income ranges: 4.9% for AGIs below $25k, 8.1% for AGIs $25k-50k, 14.3% for AGIs $50k-75k, 18.0% for AGIs $75k-100k, 18.5% for AGIs $100k-200k, 8.5% for AGIs over 200k)
Charity contributions: $4,568 (reported on 18.0% of returns)
Here:
$4,568
State:
$4,659
(% of AGI for various income ranges: 0.4% for AGIs below $25k, 0.9% for AGIs $25k-50k, 2.2% for AGIs $50k-75k, 2.9% for AGIs $75k-100k, 3.4% for AGIs $100k-200k, 1.8% for AGIs over 200k)
Taxes paid: $6,811 (reported on 21.5% of returns)
93654:
$6,811
State:
$14,448
(% of AGI for various income ranges: 0.7% for AGIs below $25k, 1.7% for AGIs $25k-50k, 3.3% for AGIs $50k-75k, 4.9% for AGIs $75k-100k, 6.3% for AGIs $100k-200k, 3.5% for AGIs over 200k)
Earned income credit: $2,674 (reported on 33.1% of returns)
Here:
$2,674
State:
$2,286
(% of AGI for various income ranges: 9.3% for AGIs below $25k, 2.4% for AGIs $25k-50k)
Percentage of individuals using paid preparers for their 2012 taxes: 66.4%
Here:
66%
State:
64%
(% for various income ranges: 64.6% for AGIs below $25k, 65.2% for AGIs $25k-50k, 69.1% for AGIs $50k-75k, 70.1% for AGIs $75k-100k, 75.0% for AGIs $100k-200k, 86.7% for AGIs over 200k)
Averages for the 2004 tax year for zip code 93654, filed in 2005:
Average Adjusted Gross Income (AGI) in 2004: $32,204 (Individual Income Tax Returns)
Here:
$32,204
State:
$58,600
Salary/wage: $28,785 (reported on 87.9% of returns)
Here:
$28,785
State:
$49,455
(% of AGI for various income ranges: 2119.3% for AGIs below $10k, 79.4% for AGIs $10k-25k, 82.6% for AGIs $25k-50k, 81.7% for AGIs $50k-75k, 80.3% for AGIs $75k-100k, 56.6% for AGIs over 100k)
Taxable interest for individuals: $1,727 (reported on 32.7% of returns)
This zip code:
$1,727
California:
$2,365
(% of AGI for various income ranges: 98.0% for AGIs below $10k, 1.3% for AGIs $10k-25k, 1.3% for AGIs $25k-50k, 1.2% for AGIs $50k-75k, 1.1% for AGIs $75k-100k, 2.8% for AGIs over 100k)
Taxable dividends: $2,775 (reported on 12.1% of returns)
Here:
$2,775
State:
$4,746
(% of AGI for various income ranges: 53.8% for AGIs below $10k, 0.7% for AGIs $10k-25k, 0.6% for AGIs $25k-50k, 0.6% for AGIs $50k-75k, 0.7% for AGIs $75k-100k, 2.0% for AGIs over 100k)
Net capital gain/loss: +$14,689 (reported on 10.8% of returns)
Here:
+$14,689
State:
+$23,418
(% of AGI for various income ranges: 251.3% for AGIs below $10k, 0.2% for AGIs $10k-25k, 1.7% for AGIs $25k-50k, 1.9% for AGIs $50k-75k, 2.5% for AGIs $75k-100k, 14.4% for AGIs over 100k)
Profit/loss from business: +$12,254 (reported on 11.1% of returns)
Here:
+$12,254
State:
+$16,826
(% of AGI for various income ranges: 67.7% for AGIs below $10k, 3.6% for AGIs $10k-25k, 3.0% for AGIs $25k-50k, 3.0% for AGIs $50k-75k, 3.4% for AGIs $75k-100k, 7.1% for AGIs over 100k)
IRA payment deduction: $3,275 (reported on 1.8% of returns)
93654:
$3,275
California:
$3,192
(% of AGI for various income ranges: 0.1% for AGIs $10k-25k, 0.2% for AGIs $25k-50k, 0.2% for AGIs $50k-75k, 0.2% for AGIs $75k-100k, 0.2% for AGIs over 100k)
Self-employed pension: $15,773 (reported on 0.2% of returns)
Here:
$15,773
California:
$17,688
Total itemized deductions: $18,275 (26% of AGI, reported on 23.9% of returns)
Here:
$18,275
State:
$28,113
Here:
25.6% of AGI
State:
25.3% of AGI
(% of AGI for various income ranges: 219.5% for AGIs below $10k, 5.3% for AGIs $10k-25k, 11.4% for AGIs $25k-50k, 16.5% for AGIs $50k-75k, 18.8% for AGIs $75k-100k, 15.8% for AGIs over 100k)
Charity contributions deductions: $3,787 (5% of AGI, reported on 21.4% of returns)
Here:
$3,787
State:
$3,923
Here:
5.2% of AGI
State:
3.3% of AGI
(% of AGI for various income ranges: 14.6% for AGIs below $10k, 0.8% for AGIs $10k-25k, 1.7% for AGIs $25k-50k, 3.0% for AGIs $50k-75k, 3.8% for AGIs $75k-100k, 3.7% for AGIs over 100k)
Total tax: $4,799 (reported on 56.6% of returns)
93654:
$4,799
State:
$10,761
(% of AGI for various income ranges: 52.7% for AGIs below $10k, 2.5% for AGIs $10k-25k, 4.9% for AGIs $25k-50k, 7.8% for AGIs $50k-75k, 9.7% for AGIs $75k-100k, 16.5% for AGIs over 100k)
Earned income credit: $2,139 (reported on 34.5% of returns)
Here:
$2,139
State:
$1,763
Percentage of individuals using paid preparers for their 2004 taxes: 64.4%
Here:
64%
State:
66%
(% for various income ranges: 56.4% for AGIs below $10k, 61.3% for AGIs $10k-25k, 68.0% for AGIs $25k-50k, 73.0% for AGIs $50k-75k, 69.7% for AGIs $75k-100k, 82.6% for AGIs over 100k)
Household received Food Stamps/SNAP in the past 12 months: 1,847 Household did not receive Food Stamps/SNAP in the past 12 months: 7,034
Women who had a birth in the past 12 months: 624 (366 now married, 259 unmarried) Women who did not have a birth in the past 12 months: 6,566 (3,101 now married, 3,443 unmarried)
Housing units in zip code 93654 with a mortgage: 2,981 (246 second mortgage, 28 home equity loan, 122 both second mortgage and home equity loan) Houses without a mortgage: 34
Median monthly owner costs for units with a mortgage: $1,858 Median monthly owner costs for units without a mortgage: $627
Residents with income below the poverty level in 2022:
This zip code:
15.8%
Whole state:
12.2%
Residents with income below 50% of the poverty level in 2022:
This zip code:
10.1%
Whole state:
6.2%
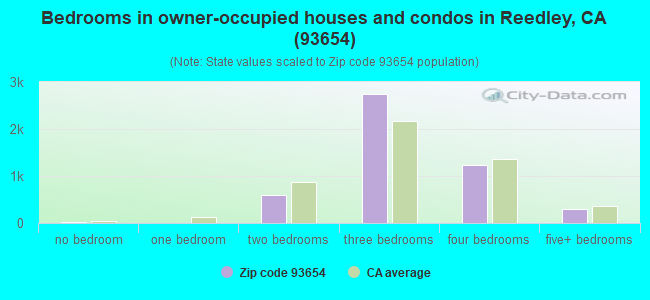
Median number of rooms in houses and condos:
Here:
6.0
State:
6.0
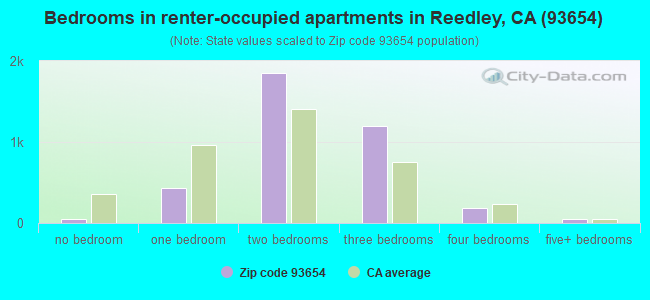
Median number of rooms in apartments:
Here:
4.3
State:
3.9
Notable locations in this zip code not listed on our city pages
Notable locations in zip code 93654: Lassotovitch Ranch (A), Ketscher Ranch (B), Kaktus Korner (C), Reedley Womens Club (D), Reedley Opera House Complex (E), Reedley City Hall (F), Reedley Branch Fresno County Free Library (G), Kings River Community College Library (H), First Mennonite Church Library (I), Watsons Antique Farm Museum (J), Sequoia Safety Council Ambulance Reedley Station (K), Reedley Fire Department (L). Display/hide their locations on the map
Churches in zip code 93654 include: Armenian Apostolic Church (A), Christ Lutheran Church (B), Church of Christ (C), Church of the Nazarene (D), Community Christian Fellowship Church (E), Cornerstone Community Church (F), Ebenezer Lutheran Church (G), Episcopal Church of the Good Shepherd (H), Evangelical Free Church of Reedley (I). Display/hide their locations on the map
Parks in zip code 93654 include: Wahtoke Park (1), Camacho Park (2), Cricket Hollow Park (3), Monument Hill Park (4), Pioneer Park (5). Display/hide their locations on the map
5,208 married couples with children.
2,047 single-parent households (516 men, 1,531 women).
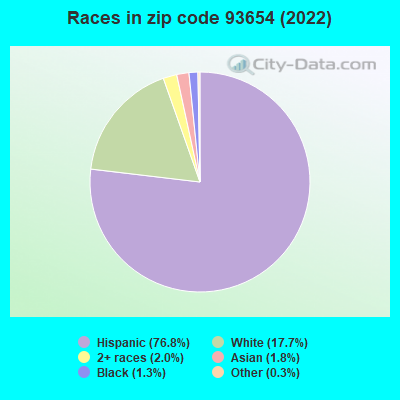
40.9% of residents of 93654 zip code speak English at home.
57.7% of residents speak Spanish at home (49% very well, 19% well, 15% not well, 17% not at all).
0.7% of residents speak other Indo-European language at home (28% very well, 72% well).
1.0% of residents speak Asian or Pacific Island language at home (82% very well, 15% well, 2% not well).
0.1% of residents speak other language at home (38% very well, 62% not well).
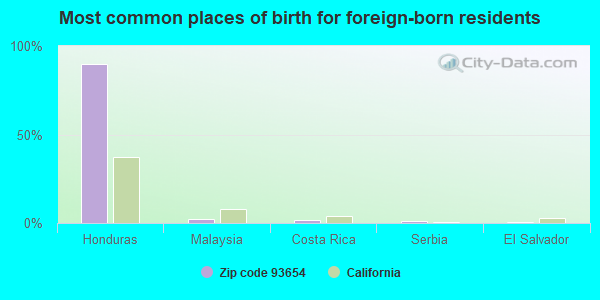
Foreign born population: 8,591 (28.4%) (33.7% of them are naturalized citizens)
This zip code:
28.4%
Whole state:
26.7%
90%Honduras
2%Malaysia
2%Costa Rica
1%Serbia
0%El Salvador
0%Brazil
0%Romania
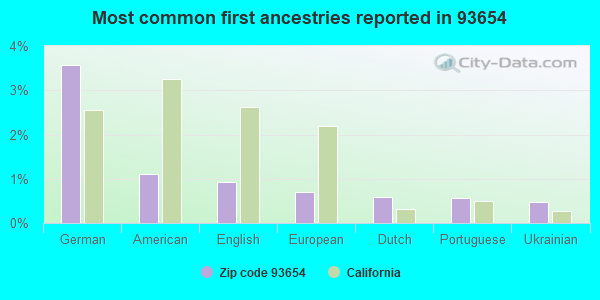
4%German
1%American
1%English
1%European
1%Dutch
1%Portuguese
0%Ukrainian
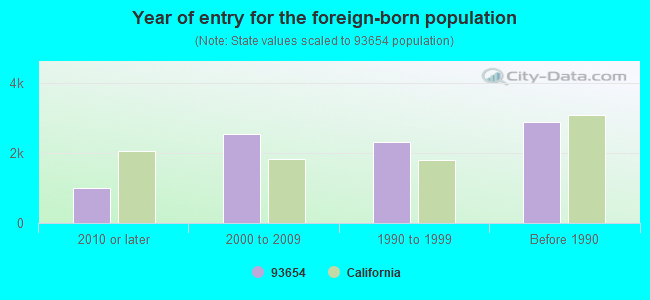
Year of entry for the foreign-born population
9912010 or later
2,5462000 to 2009
2,3261990 to 1999
2,895Before 1990
Major facilities with environmental interests located in this zip code:
GUARDIAN INDUSTRIES (1485 E CURTIS AVE in REEDLEY, CA)
AIR SYNTHETIC MINOR (AIRS/AFS) STATE MASTER (California - Hazardous Waste Tracking) - HAZARDOU WASTE PROGRAM (Integrated Compliance Information System) - ICIS-09-2000-0431, FORMAL ENFORCEMENT ACTION, ICIS-09-2001-0022, CRITERIA AND HAZARDOUS AIR POLLUTANT INVENTORY (Inventory of air pollution sources) Large Quantity Generators, more that 1000 kg of hazardous waste/month (Resource Conservation and Recovery Act (tracking hazardous waste)) - notification TRI REPORTER (Tracking of toxic chemicals releasing facilities) Business SIC classification: FURNITURE AND FIXTURES; GLASS PRODUCTS, MADE OF PURCHASED GLASS; ELECTROPLATING, PLATING, POLISHING, ANODIZING, AND COLORING Organizations: GUARDIAN FABRICATION INC (CONTACT/OWNER)
Alternative names: BUCHMIN INDUSTRIES, GUARDIAN FABRICATION, GUARDIAN IND - REEDLY PLT
KINGS RIVER CLEANERS (1340 S "G" in REEDLEY, CA)
STATE MASTER (California - Hazardous Waste Tracking) - HAZARDOU WASTE PROGRAM Small Quantity Generators, between 100 kg and 1000 kg of hazardous waste/month (Resource Conservation and Recovery Act (tracking hazardous waste)) - notification Small Quantity Generators, between 100 kg and 1000 kg of hazardous waste/month (Resource Conservation and Recovery Act (tracking hazardous waste)) - notification Organizations: LOUIE MARTINES (CONTACT/OWNER)
, LOUIE MARTINEZ (CONTACT/OWNER)
KINGS CANYON USD DIST COMPLEX (675 W MANNING AVE in REEDLEY, CA)
STATE MASTER (California - Hazardous Waste Tracking) - HAZARDOU WASTE PROGRAM COMPLIANCE ACTIVITY (Tracking inspections of insecticide, fungicide, and rodenticide, and toxic substances) Small Quantity Generators, between 100 kg and 1000 kg of hazardous waste/month (Resource Conservation and Recovery Act (tracking hazardous waste)) - notification Alternative names: KINGS CANYON JOINT USD, KINGS CANYON UNIFIED SD
ENNS PONTIAC BUICK & GMC (1307 G ST in REEDLEY, CA)
STATE MASTER (California - Hazardous Waste Tracking) - HAZARDOU WASTE PROGRAM Small Quantity Generators, between 100 kg and 1000 kg of hazardous waste/month (Resource Conservation and Recovery Act (tracking hazardous waste)) - notification Organizations: HAROLD ENNS (CONTACT/OWNER)
MAXCO SUPPLY INC (343 E DINUBA AVE in REEDLEY, CA)
STATE MASTER (California - Hazardous Waste Tracking) - HAZARDOU WASTE PROGRAM Small Quantity Generators, between 100 kg and 1000 kg of hazardous waste/month (Resource Conservation and Recovery Act (tracking hazardous waste)) - notification Organizations: MAX FLAMMING (CONTACT/OWNER)
GROUNDWATER TREATMENT FACILITY (995 N REED AVE in REEDLEY, CA)
National Pollutant Discharge Elimination System NON-MAJOR (Tracking pollutant discharge elimination systems) - permit Large Quantity Generators, more that 1000 kg of hazardous waste/month (Resource Conservation and Recovery Act (tracking hazardous waste)) Business SIC classification: SANITARY SERVICES Organizations: STATE CENTER COMMUNITY COLLEGE DISTRICT (CONTACT/OPERATOR)
, STATE CTR COMM COLLEGE DIST (CONTACT/OWNER)
Alternative names: REEDLEY COLLEGE, STATE CTR COMM COLLEGE DIST
MARTENS CHEVROLET AND OLDSMOBILE (1050 I ST in REEDLEY, CA)
STATE MASTER (California - Hazardous Waste Tracking) - HAZARDOU WASTE PROGRAM Small Quantity Generators, between 100 kg and 1000 kg of hazardous waste/month (Resource Conservation and Recovery Act (tracking hazardous waste)) - notification Organizations: JEREMY H MARTENS (CONTACT/OWNER)
ALTA ELEMENTARY (21771 E. PARLIER AVE. in REEDLEY, CA)
(National Center for Education Statistics) - STATE ID-6006738 Organizations: KINGS CANYON JOINT UNIFIED (SCHOOL DISTRICT)
GENERAL GRANT MIDDLE (360 N. EAST AVE. in REEDLEY, CA)
(National Center for Education Statistics) - STATE ID-6006761 Organizations: KINGS CANYON JOINT UNIFIED (SCHOOL DISTRICT)
GREAT WESTERN ELEMENTARY (5051 S. FRANKWOOD AVE. in REEDLEY, CA)
(National Center for Education Statistics) - STATE ID-6088959 Organizations: KINGS CANYON JOINT UNIFIED (SCHOOL DISTRICT)
JEFFERSON ELEMENTARY (1037 E. DUFF AVE. in REEDLEY, CA)
(National Center for Education Statistics) - STATE ID-6006787 Organizations: KINGS CANYON JOINT UNIFIED (SCHOOL DISTRICT)
LINCOLN ELEMENTARY (374 E. NORTH AVE. in REEDLEY, CA)
(National Center for Education Statistics) - STATE ID-6006803 Organizations: KINGS CANYON JOINT UNIFIED (SCHOOL DISTRICT)
MOUNTAIN VIEW (ALTER.) (477 W. MANNING AVE. in REEDLEY, CA)
(National Center for Education Statistics) - STATE ID-1030378 Organizations: KINGS CANYON JOINT UNIFIED (SCHOOL DISTRICT)
Housing units lacking complete plumbing facilities: 1.7% Housing units lacking complete kitchen facilities: 2.5%
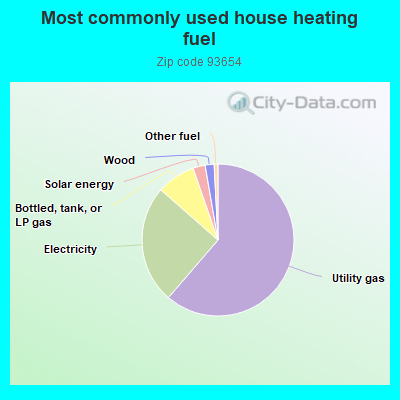
61.2%Utility gas
25.1%Electricity
8.2%Bottled, tank, or LP gas
2.6%Solar energy
1.9%Wood
0.8%Other fuel
Population in 1990: 22,370. Population change in the 1990s: +3,536 (+15.8%).
Place of birth for U.S.-born residents:
This state: 19,519
Northeast: 123
Midwest: 504
South: 813
West: 421
60% of the 93654 zip code residents lived in the same house 5 years ago. Out of people who lived in different houses, 77% lived in this county. Out of people who lived in different counties, 50% lived in California.
96% of the 93654 zip code residents lived in the same house 1 year ago. Out of people who lived in different houses, 76% moved from this county. Out of people who lived in different houses, 22% moved from different county within same state. Out of people who lived in different houses, 1% moved from different state. Out of people who lived in different houses, 6% moved from abroad.
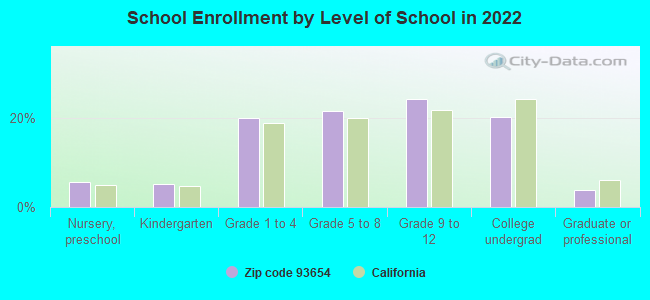
Private vs. public school enrollment:
Students in private schools in grades 1 to 8 (elementary and middle school): 366
Here:
10.1%
California:
10.5%
Students in private schools in grades 9 to 12 (high school): 152
Here:
7.2%
California:
8.5%
Students in private undergraduate colleges: 171
Here:
9.8%
California:
15.9%
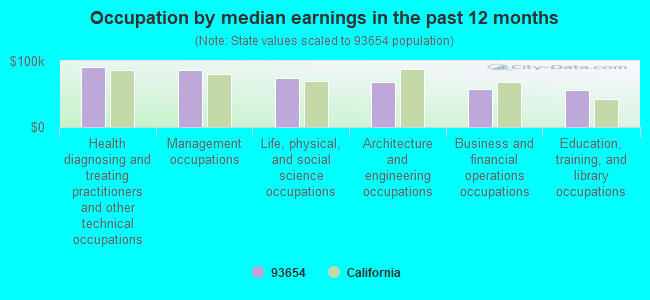
Occupation by median earnings in the past 12 months ($)
90,627Health diagnosing and treating practitioners and other technical occupations
86,723Management occupations
74,838Life, physical, and social science occupations
68,559Architecture and engineering occupations
58,221Business and financial operations occupations
56,107Education, training, and library occupations
Companies with federal contracts located in this zip code:
ZWEIGLE SEPTIC SERVICE (5272 S FRANKWOOD in REEDLEY, CA; small business) : $32,151 in 13 contractsfrom 2002 to 2006
Contracts for Waste Treatment and Storage, Other Housekeeping Services by Army, U.S. Army Corps of Engineers - civil program financing only Signed by year:2000: $0; 2001: $0; 2002: $25,305; 2003: $51,132; 2004: -$82,888; 2005: $51,652; 2006: -$13,050.
Biggest contracts:
$25,826 with Army for Waste Treatment and Storage. Signed on 2005-03-18. Completion date: 2004-09-30.
$25,826 with U.S. Army Corps of Engineers - civil program financing only for Waste Treatment and Storage. Signed on 2005-03-18. Completion date: 2004-09-30.
$25,566, same as above.Signed on 2003-11-19. Completion date: 2003-09-30.
$25,566 with Army for Waste Treatment and Storage. Signed on 2003-11-19. Completion date: 2003-09-30.
Cartozian's Air Conditioning & heat (925 G. Street in Reedley, CA; small business)
$5,500 with Agricultural Research Service for Heat Exchangers and Steam Condensers. Signed on 2004-05-05. Completion date: 2004-06-01.
Top industries in this zip code by the number of employees in 2005:
Health Care and Social Assistance: General Medical and Surgical Hospitals (250-499 employees: 1 establishment)
Health Care and Social Assistance: Continuing Care Retirement Communities (100-249: 2)
2005 - 2018 National Fire Incident Reporting System (NFIRS) incidents
Based on the data from the years 2005 - 2018 the average number of fires per year is 51. The highest number of fire incidents - 77 took place in 2017, and the least - 3 in 2005. The data has a rising trend.
When looking into fire subcategories, the most reports belonged to: Outside Fires (49.6%), and Structure Fires (23.4%).
Fire incident types reported to NFIRS in Zip Code 93654


 Nearest zip codes: 93646, 93648, 93666, 93618, 93657, 93616.
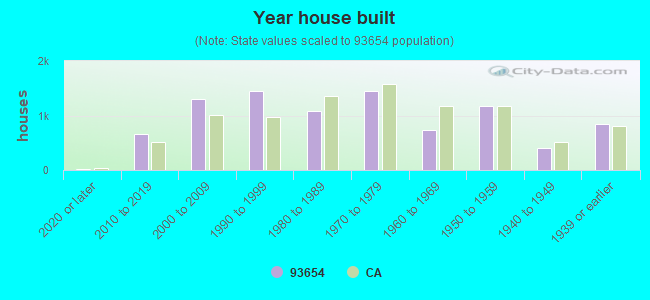


 Based on the data from the years 2005 - 2018 the average number of fires per year is 51. The highest number of fire incidents - 77 took place in 2017, and the least - 3 in 2005. The data has a rising trend.
 When looking into fire subcategories, the most reports belonged to: Outside Fires (49.6%), and Structure Fires (23.4%).