Estimated zip code population in 2022: 4,716 Zip code population in 2010: 4,282 Zip code population in 2000: 3,615
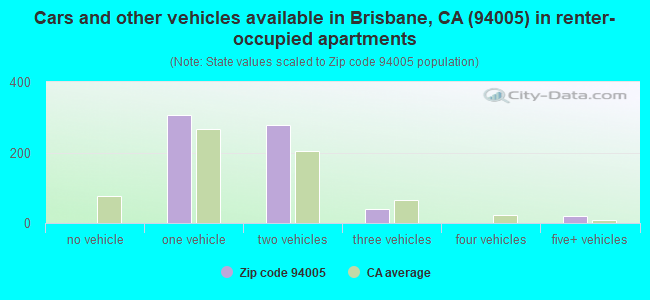
Houses and condos: 2,145 Renter-occupied apartments: 641
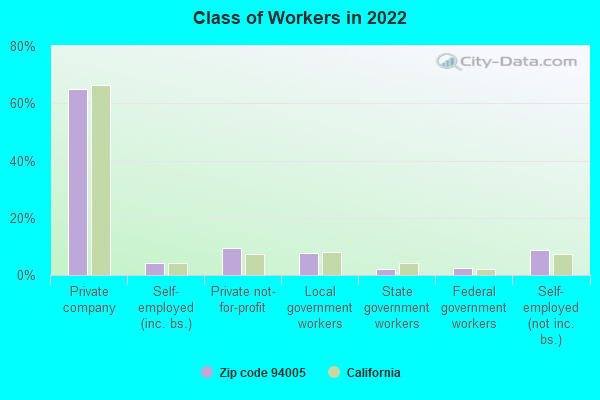
% of renters here:
33%
State:
44%
March 2022 cost of living index in zip code 94005: 130.0 (high, U.S. average is 100)
Land area: 4.4 sq. mi. Water area: 0.2 sq. mi.
Population density: 1,073 people per square mile
(low).
OSM Map
General Map
Google Map
MSN Map
OSM Map
General Map
Google Map
MSN Map
OSM Map
General Map
Google Map
MSN Map
OSM Map
General Map
Google Map
MSN Map
Please wait while loading the map...
Real estate property taxes paid for housing units in 2022:
This zip code:
0.6% ($7,754)
California:
0.7% ($4,831)
Median real estate property taxes paid for housing units with mortgages in 2022: $8,616 (0.8%) Median real estate property taxes paid for housing units with no mortgage in 2022: $3,855 (0.3%)
Business Search- 14 Million verified businesses
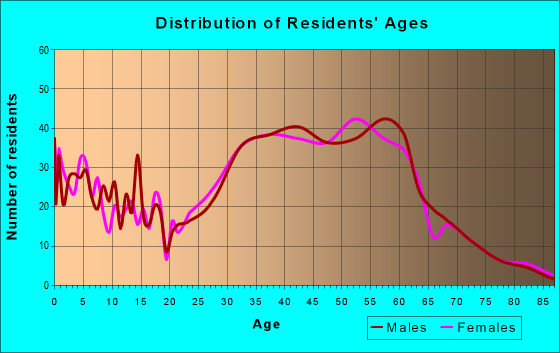
Males: 2,348
(49.8%)
Females: 2,368
(50.2%)
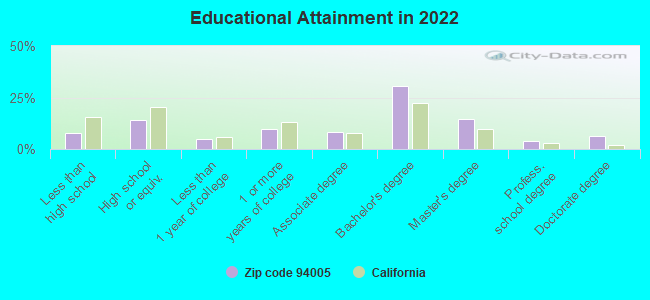
For population 25 years and over in 94005:
High school or higher: 92.9%
Bachelor's degree or higher: 55.7%
Graduate or professional degree: 24.8%
Unemployed: 8.0%
Mean travel time to work (commute): 28.1 minutes
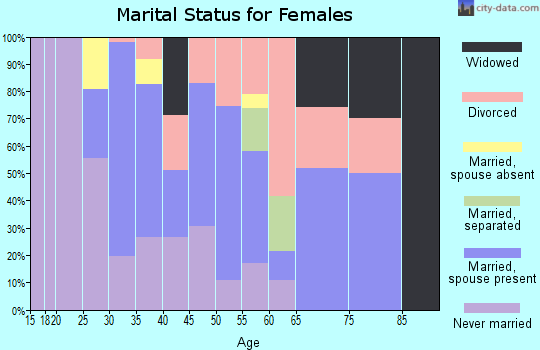
For population 15 years and over in 94005:
Never married: 30.1%
Now married: 46.7%
Separated: 2.1%
Widowed: 4.5%
Divorced: 16.6%
Zip code 94005 compared to state average:
Median house value above state average.
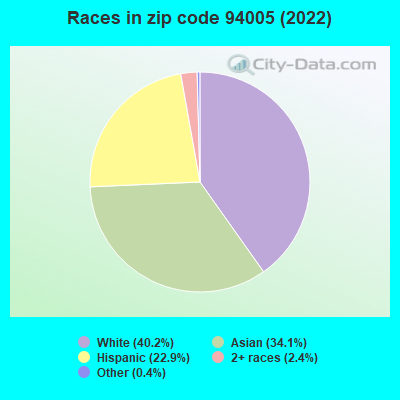
Black race population percentage significantly below state average.
Hispanic race population percentage below state average.
Median age above state average.
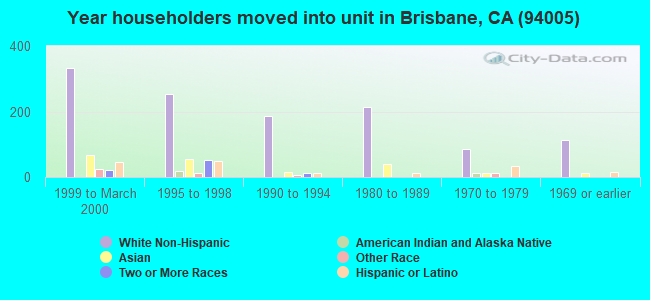
Length of stay since moving in significantly above state average.
Percentage of population with a bachelor's degree or higher above state average.
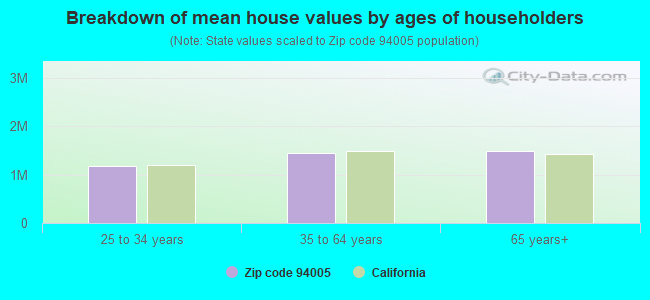
Estimated median house/condo value in 2022: $1,214,413
94005:
$1,214,413
California:
$715,900
According to our research of California and other state lists, there were 2 registered sex offenders living in 94005 zip code as of April 28, 2024. The ratio of all residents to sex offenders in zip code 94005 is 2,317 to 1. The ratio of registered sex offenders to all residents in this zip code is much lower than the state average.
Median resident age:
This zip code:
43.6 years
California median age:
37.9 years
Average household size:
This zip code:
2.4 people
California:
2.8 people
Averages for the 2020 tax year for zip code 94005, filed in 2021:
Average Adjusted Gross Income (AGI) in 2020: $154,133 (Individual Income Tax Returns)
Here:
$154,133
State:
$95,910
Salary/wage: $145,973 (reported on 77.4% of returns)
Here:
$145,973
State:
$77,331
(% of AGI for various income ranges: 1365.8% for AGIs below $25k, 3682.6% for AGIs $25k-50k, 7478.9% for AGIs $50k-75k, 10829.2% for AGIs $75k-100k, 20073.7% for AGIs $100k-200k, 136009.3% for AGIs over 200k)
Taxable interest for individuals: $1,778 (reported on 50.8% of returns)
This zip code:
$1,778
California:
$2,294
(% of AGI for various income ranges: 43.3% for AGIs below $25k, 53.5% for AGIs $25k-50k, 35.8% for AGIs $50k-75k, 174.6% for AGIs $75k-100k, 179.6% for AGIs $100k-200k, 906.4% for AGIs over 200k)
Ordinary dividends: $4,957 (reported on 38.5% of returns)
Here:
$4,957
State:
$10,949
(% of AGI for various income ranges: 64.6% for AGIs below $25k, 118.7% for AGIs $25k-50k, 156.8% for AGIs $50k-75k, 275.4% for AGIs $75k-100k, 467.8% for AGIs $100k-200k, 1757.9% for AGIs over 200k)
Net capital gain/loss in AGI: +$35,253 (reported on 34.9% of returns)
Here:
+$35,253
State:
+$49,306
(% of AGI for various income ranges: 121.2% for AGIs below $25k, 153.9% for AGIs $25k-50k, 207.4% for AGIs $50k-75k, 364.6% for AGIs $75k-100k, 1069.3% for AGIs $100k-200k, 19016.4% for AGIs over 200k)
Profit/loss from business: +$27,821 (reported on 21.0% of returns)
Here:
+$27,821
State:
+$15,671
(% of AGI for various income ranges: 265.8% for AGIs below $25k, 405.7% for AGIs $25k-50k, 634.2% for AGIs $50k-75k, 736.2% for AGIs $75k-100k, 1153.3% for AGIs $100k-200k, 5641.4% for AGIs over 200k)
Taxable individual retirement arrangement distribution: $24,024 (reported on 8.3% of returns)
94005:
$24,024
California:
$23,505
(% of AGI for various income ranges: 60.4% for AGIs below $25k, 134.3% for AGIs $25k-50k, 235.8% for AGIs $50k-75k, 556.2% for AGIs $75k-100k, 464.8% for AGIs $100k-200k, 1546.4% for AGIs over 200k)
Self-employed (Keogh) retirement plans: $24,300 (reported on 2.0% of returns)
94005:
$24,300
California:
$30,163
(% of AGI for various income ranges: 191.3% for AGIs $25k-50k, 553.6% for AGIs over 200k)
Total itemized deductions: $37,115 (reported on 25.8% of returns)
Here:
$37,115
State:
$39,517
(% of AGI for various income ranges: 384.6% for AGIs below $25k, 508.7% for AGIs $25k-50k, 593.7% for AGIs $50k-75k, 1142.3% for AGIs $75k-100k, 2130.7% for AGIs $100k-200k, 9761.4% for AGIs over 200k)
Charity contributions: $8,228 (reported on 18.7% of returns)
Here:
$8,228
State:
$12,598
(% of AGI for various income ranges: 21.2% for AGIs below $25k, 47.4% for AGIs $50k-75k, 84.6% for AGIs $75k-100k, 214.1% for AGIs $100k-200k, 2170.0% for AGIs over 200k)
Taxes paid: $8,952 (reported on 25.8% of returns)
94005:
$8,952
State:
$8,807
(% of AGI for various income ranges: 53.8% for AGIs below $25k, 67.4% for AGIs $25k-50k, 167.4% for AGIs $50k-75k, 310.8% for AGIs $75k-100k, 627.0% for AGIs $100k-200k, 2228.6% for AGIs over 200k)
Earned income credit: $1,725 (reported on 4.8% of returns)
Here:
$1,725
State:
$2,074
(% of AGI for various income ranges: 43.3% for AGIs below $25k, 44.8% for AGIs $25k-50k)
Percentage of individuals using paid preparers for their 2020 taxes: 89.3%
Here:
89%
State:
92%
(% for various income ranges: 87.5% for AGIs below $25k, 86.8% for AGIs $25k-50k, 90.6% for AGIs $50k-75k, 84.0% for AGIs $75k-100k, 88.9% for AGIs $100k-200k, 94.5% for AGIs over 200k)
Averages for the 2012 tax year for zip code 94005, filed in 2013:
Average Adjusted Gross Income (AGI) in 2012: $106,087 (Individual Income Tax Returns)
Here:
$106,087
State:
$72,726
Salary/wage: $100,471 (reported on 84.0% of returns)
Here:
$100,471
State:
$59,079
(% of AGI for various income ranges: 63.5% for AGIs below $25k, 75.5% for AGIs $25k-50k, 76.5% for AGIs $50k-75k, 81.2% for AGIs $75k-100k, 83.2% for AGIs $100k-200k, 78.7% for AGIs over 200k)
Taxable interest for individuals: $1,122 (reported on 52.3% of returns)
This zip code:
$1,122
California:
$2,146
(% of AGI for various income ranges: 1.2% for AGIs below $25k, 0.5% for AGIs $25k-50k, 0.7% for AGIs $50k-75k, 0.7% for AGIs $75k-100k, 0.5% for AGIs $100k-200k, 0.5% for AGIs over 200k)
Ordinary dividends: $3,878 (reported on 30.5% of returns)
Here:
$3,878
State:
$9,308
(% of AGI for various income ranges: 2.6% for AGIs below $25k, 1.3% for AGIs $25k-50k, 1.2% for AGIs $50k-75k, 0.8% for AGIs $75k-100k, 1.1% for AGIs $100k-200k, 1.1% for AGIs over 200k)
Net capital gain/loss in AGI: +$10,392 (reported on 25.4% of returns)
Here:
+$10,392
State:
+$30,460
(% of AGI for various income ranges: 0.4% for AGIs $50k-75k, 0.1% for AGIs $75k-100k, 1.6% for AGIs $100k-200k, 4.4% for AGIs over 200k)
Profit/loss from business: +$21,502 (reported on 20.3% of returns)
Here:
+$21,502
State:
+$17,064
(% of AGI for various income ranges: 17.5% for AGIs below $25k, 8.2% for AGIs $25k-50k, 6.4% for AGIs $50k-75k, 2.1% for AGIs $75k-100k, 3.7% for AGIs $100k-200k, 3.1% for AGIs over 200k)
Taxable individual retirement arrangement distribution: $18,437 (reported on 7.4% of returns)
94005:
$18,437
California:
$19,557
(% of AGI for various income ranges: 2.7% for AGIs below $25k, 1.8% for AGIs $25k-50k, 1.6% for AGIs $50k-75k, 2.2% for AGIs $75k-100k, 1.2% for AGIs $100k-200k, 0.9% for AGIs over 200k)
Self-employment retirement plans: $16,220 (reported on 2.0% of returns)
94005:
$16,220
California:
$24,530
Total itemized deductions: $31,352 (19% of AGI, reported on 51.6% of returns)
Here:
$31,352
State:
$34,004
Here:
19.1% of AGI
State:
22.7% of AGI
(% of AGI for various income ranges: 16.3% for AGIs below $25k, 12.2% for AGIs $25k-50k, 14.6% for AGIs $50k-75k, 16.2% for AGIs $75k-100k, 17.0% for AGIs $100k-200k, 14.3% for AGIs over 200k)
Charity contributions: $2,792 (reported on 34.4% of returns)
Here:
$2,792
State:
$4,659
(% of AGI for various income ranges: 0.7% for AGIs below $25k, 0.7% for AGIs $25k-50k, 0.7% for AGIs $50k-75k, 1.1% for AGIs $75k-100k, 1.2% for AGIs $100k-200k, 0.8% for AGIs over 200k)
Taxes paid: $15,928 (reported on 51.6% of returns)
94005:
$15,928
State:
$14,448
(% of AGI for various income ranges: 4.7% for AGIs below $25k, 3.3% for AGIs $25k-50k, 4.4% for AGIs $50k-75k, 6.5% for AGIs $75k-100k, 7.7% for AGIs $100k-200k, 9.4% for AGIs over 200k)
Earned income credit: $1,384 (reported on 7.4% of returns)
Here:
$1,384
State:
$2,286
(% of AGI for various income ranges: 3.0% for AGIs below $25k, 0.4% for AGIs $25k-50k)
Percentage of individuals using paid preparers for their 2012 taxes: 59.0%
Here:
59%
State:
64%
(% for various income ranges: 49.1% for AGIs below $25k, 55.8% for AGIs $25k-50k, 57.1% for AGIs $50k-75k, 57.1% for AGIs $75k-100k, 64.9% for AGIs $100k-200k, 72.2% for AGIs over 200k)
Averages for the 2004 tax year for zip code 94005, filed in 2005:
Average Adjusted Gross Income (AGI) in 2004: $81,076 (Individual Income Tax Returns)
Here:
$81,076
State:
$58,600
Salary/wage: $79,479 (reported on 84.3% of returns)
Here:
$79,479
State:
$49,455
(% of AGI for various income ranges: 121.7% for AGIs below $10k, 67.2% for AGIs $10k-25k, 82.4% for AGIs $25k-50k, 87.0% for AGIs $50k-75k, 91.3% for AGIs $75k-100k, 80.7% for AGIs over 100k)
Taxable interest for individuals: $1,307 (reported on 58.3% of returns)
This zip code:
$1,307
California:
$2,365
(% of AGI for various income ranges: 13.7% for AGIs below $10k, 2.3% for AGIs $10k-25k, 1.3% for AGIs $25k-50k, 0.9% for AGIs $50k-75k, 0.7% for AGIs $75k-100k, 0.8% for AGIs over 100k)
Taxable dividends: $2,411 (reported on 32.3% of returns)
Here:
$2,411
State:
$4,746
(% of AGI for various income ranges: 8.4% for AGIs below $10k, 2.1% for AGIs $10k-25k, 0.9% for AGIs $25k-50k, 1.1% for AGIs $50k-75k, 0.5% for AGIs $75k-100k, 0.9% for AGIs over 100k)
Net capital gain/loss: +$16,305 (reported on 24.8% of returns)
Here:
+$16,305
State:
+$23,418
(% of AGI for various income ranges: 7.9% for AGIs below $10k, -0.5% for AGIs $10k-25k, -0.3% for AGIs $25k-50k, 0.5% for AGIs $50k-75k, 0.4% for AGIs $75k-100k, 7.8% for AGIs over 100k)
Profit/loss from business: +$18,670 (reported on 19.4% of returns)
Here:
+$18,670
State:
+$16,826
(% of AGI for various income ranges: 11.7% for AGIs below $10k, 13.3% for AGIs $10k-25k, 6.9% for AGIs $25k-50k, 5.7% for AGIs $50k-75k, 3.4% for AGIs $75k-100k, 3.6% for AGIs over 100k)
IRA payment deduction: $3,261 (reported on 2.8% of returns)
94005:
$3,261
California:
$3,192
(% of AGI for various income ranges: 0.5% for AGIs $10k-25k, 0.3% for AGIs $25k-50k, 0.3% for AGIs $50k-75k, 0.0% for AGIs over 100k)
Self-employed pension: $13,721 (reported on 2.5% of returns)
Here:
$13,721
California:
$17,688
(% of AGI for various income ranges: 0.9% for AGIs $10k-25k, 0.7% for AGIs $50k-75k, 0.5% for AGIs over 100k)
Total itemized deductions: $26,137 (21% of AGI, reported on 51.9% of returns)
Here:
$26,137
State:
$28,113
Here:
20.7% of AGI
State:
25.3% of AGI
(% of AGI for various income ranges: 53.0% for AGIs below $10k, 17.3% for AGIs $10k-25k, 15.6% for AGIs $25k-50k, 18.2% for AGIs $50k-75k, 21.5% for AGIs $75k-100k, 15.5% for AGIs over 100k)
Charity contributions deductions: $2,527 (2% of AGI, reported on 38.6% of returns)
Here:
$2,527
State:
$3,923
Here:
2.0% of AGI
State:
3.3% of AGI
(% of AGI for various income ranges: 0.7% for AGIs below $10k, 1.2% for AGIs $10k-25k, 1.0% for AGIs $25k-50k, 1.2% for AGIs $50k-75k, 1.2% for AGIs $75k-100k, 1.2% for AGIs over 100k)
Total tax: $14,607 (reported on 87.4% of returns)
94005:
$14,607
State:
$10,761
(% of AGI for various income ranges: 6.3% for AGIs below $10k, 6.7% for AGIs $10k-25k, 8.8% for AGIs $25k-50k, 11.4% for AGIs $50k-75k, 11.7% for AGIs $75k-100k, 18.9% for AGIs over 100k)
Earned income credit: $1,065 (reported on 5.1% of returns)
Here:
$1,065
State:
$1,763
Percentage of individuals using paid preparers for their 2004 taxes: 59.7%
Here:
60%
State:
66%
(% for various income ranges: 49.8% for AGIs below $10k, 59.8% for AGIs $10k-25k, 58.4% for AGIs $25k-50k, 59.0% for AGIs $50k-75k, 60.6% for AGIs $75k-100k, 66.0% for AGIs over 100k)
Household received Food Stamps/SNAP in the past 12 months: 65 Household did not receive Food Stamps/SNAP in the past 12 months: 1,831
Women who had a birth in the past 12 months: 66 (35 now married, 31 unmarried) Women who did not have a birth in the past 12 months: 960 (334 now married, 628 unmarried)
Housing units in zip code 94005 with a mortgage: 909 (157 second mortgage, 140 both second mortgage and home equity loan) Houses without a mortgage: 68
Median monthly owner costs for units with a mortgage: $3,710 Median monthly owner costs for units without a mortgage: $805
Residents with income below the poverty level in 2022:
This zip code:
5.1%
Whole state:
12.2%
Residents with income below 50% of the poverty level in 2022:
This zip code:
1.5%
Whole state:
6.2%
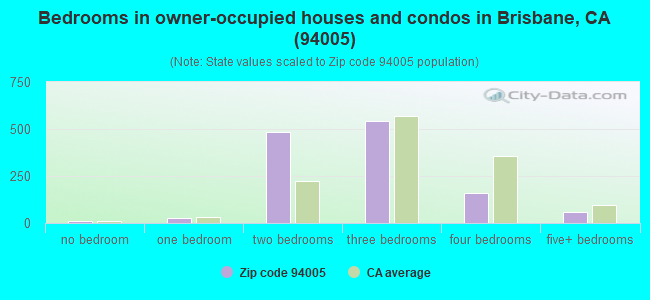
Median number of rooms in houses and condos:
Here:
5.5
State:
6.0
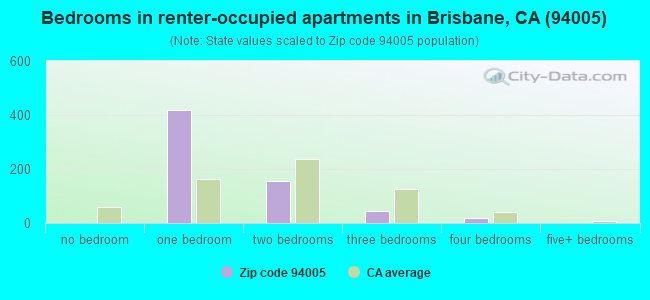
Median number of rooms in apartments:
Here:
3.0
State:
3.9
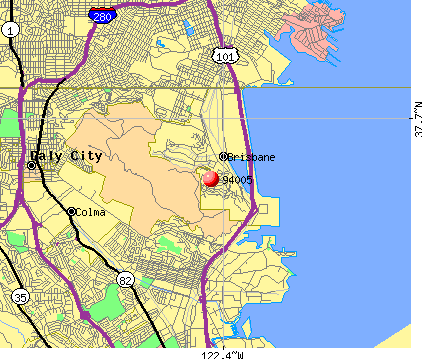
Notable locations in this zip code not listed on our city pages
Notable locations in zip code 94005: Sierra Point Marina (A), Brisbane Branch San Mateo County Library (B), North County Fire Authority Station 81 (C). Display/hide their locations on the map
In group quarters: 9 (-1 institutionalized population)
Size of family households: 438 2-persons, 185 3-persons, 271 4-persons, 130 5-persons, 13 6-persons, 37 7-or-more-persons
Size of nonfamily households: 759 1-person, 88 2-persons, 14 3-persons
550 married couples with children.
258 single-parent households (57 men, 201 women).
61.4% of residents of 94005 zip code speak English at home.
8.8% of residents speak Spanish at home (80% very well, 10% well, 10% not well).
2.7% of residents speak other Indo-European language at home (100% very well).
24.7% of residents speak Asian or Pacific Island language at home (48% very well, 24% well, 24% not well, 3% not at all).
1.9% of residents speak other language at home (76% very well, 24% well).
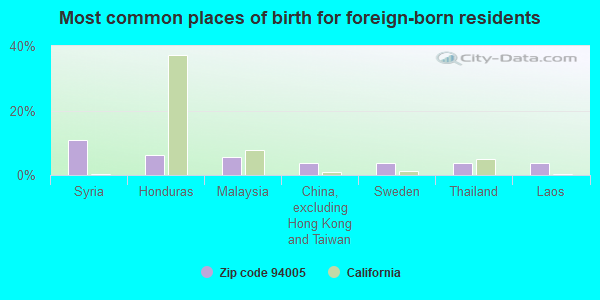
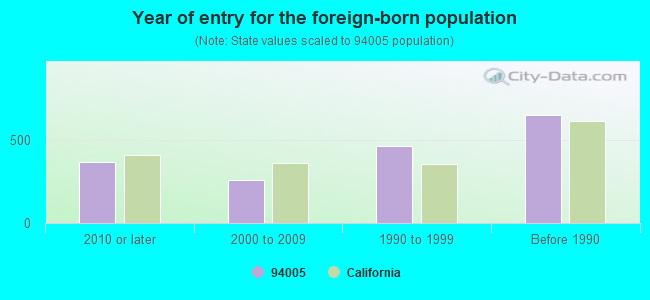
Foreign born population: 1,579 (33.5%) (67.7% of them are naturalized citizens)
This zip code:
33.5%
Whole state:
26.7%
11%Syria
6%Honduras
6%Malaysia
4%China, excluding Hong Kong and Taiwan
4%Sweden
4%Thailand
4%Laos
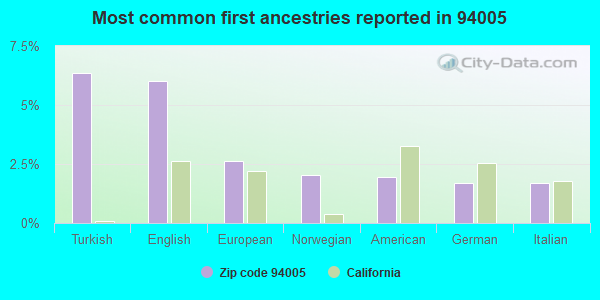
6%Turkish
6%English
3%European
2%Norwegian
2%American
2%German
2%Italian
Year of entry for the foreign-born population
3672010 or later
2592000 to 2009
4591990 to 1999
647Before 1990
Major facilities with environmental interests located in this zip code:
FONG BROTHERS PRINTING INCORPORATED (320 VALLEY DRIVE in BRISBANE, CA)
STATE MASTER (California - Hazardous Waste Tracking) - HAZARDOU WASTE PROGRAM CRITERIA AND HAZARDOUS AIR POLLUTANT INVENTORY (Inventory of air pollution sources) Small Quantity Generators, between 100 kg and 1000 kg of hazardous waste/month (Resource Conservation and Recovery Act (tracking hazardous waste)) - notification Business SIC classification: COMMERCIAL PRINTING
CHARLES SCHWAB COMPANY INCORPORATED (280 VALLEY DRIVE in BRISBANE, CA)
STATE MASTER (California - Hazardous Waste Tracking) - HAZARDOU WASTE PROGRAM CRITERIA AND HAZARDOUS AIR POLLUTANT INVENTORY (Inventory of air pollution sources) Small Quantity Generators, between 100 kg and 1000 kg of hazardous waste/month (Resource Conservation and Recovery Act (tracking hazardous waste)) Business SIC classification: SECURITY BROKERS, DEALERS, AND FLOTATION COMPANIES
INTERMUNE BRISBANE FACILITY (3280 BAYSHORE BLVD in BRISBANE, CA)
STATE MASTER (California - Hazardous Waste Tracking) - HAZARDOU WASTE PROGRAM Small Quantity Generators, between 100 kg and 1000 kg of hazardous waste/month (Resource Conservation and Recovery Act (tracking hazardous waste)) - notification Organizations: W SCOTT HARKONEN PRES C E O (CONTACT/OWNER)
Alternative names: INTERMUNE, INC
L D TRUCK AND EQUIPMENT REPAIR (374 INDUSTRIAL WAY in BRISBANE, CA)
STATE MASTER (California - Hazardous Waste Tracking) - HAZARDOU WASTE PROGRAM Small Quantity Generators, between 100 kg and 1000 kg of hazardous waste/month (Resource Conservation and Recovery Act (tracking hazardous waste)) - notification Organizations: ABEL PEREZ (CONTACT/OWNER)
CHEVRON USA INC BRISBANE CA TERM (OLD COUNTRY RD in BRISBANE, CA)
STATE MASTER (California - Hazardous Waste Tracking) - HAZARDOU WASTE PROGRAM Small Quantity Generators, between 100 kg and 1000 kg of hazardous waste/month (Resource Conservation and Recovery Act (tracking hazardous waste)) Alternative names: CHEVRON 1001273 BRISBANE
LIPMAN MIDDLE (1 SOLANO ST. in BRISBANE, CA)
(National Center for Education Statistics) - STATE ID-6043509 Organizations: BRISBANE ELEMENTARY (SCHOOL DISTRICT)
GEORGE RICE AND SONS (455 VALLEY DR in BRISBANE, CA)
(Resource Conservation and Recovery Act (tracking hazardous waste)) Organizations: GEORGE RICE & SONS DIV OF WORLD COLOR (CONTACT/OWNER)
AGFA DIVISION OF MILES INC (60 PARK LANE in BRISBANE, CA)
(Resource Conservation and Recovery Act (tracking hazardous waste))
HERNANDEZ AUTOMOTIVE SVC (23 INDUSTRIAL WAY in BRISBANE, CA)
Small Quantity Generators, between 100 kg and 1000 kg of hazardous waste/month (Resource Conservation and Recovery Act (tracking hazardous waste)) Organizations: TONY HERNANDEZ (CONTACT/OWNER)
K-I CHEMICAL USA INC (25 PARK LN in BRISBANE, CA)
COMPLIANCE ACTIVITY (Tracking inspections of insecticide, fungicide, and rodenticide, and toxic substances) Business SIC classification: CHEMICALS AND ALLIED PRODUCTS; FARM SUPPLIES
KURT R STERN PAINTING CO (UNIT 27 NORTHHILL in BRISBANE, CA)
Small Quantity Generators, between 100 kg and 1000 kg of hazardous waste/month (Resource Conservation and Recovery Act (tracking hazardous waste)) - notification
355 BRISBANE PARTNERS (355 VALLEY DR UNIT A in BRISBANE, CA)
Small Quantity Generators, between 100 kg and 1000 kg of hazardous waste/month (Resource Conservation and Recovery Act (tracking hazardous waste)) - notification
ADVANCE CARBON PRODUCTS INC (171 INDUSTRIAL WAY in BRISBANE, CA)
Small Quantity Generators, between 100 kg and 1000 kg of hazardous waste/month (Resource Conservation and Recovery Act (tracking hazardous waste)) - notification Business NAICS classification: CARBON AND GRAPHITE PRODUCT MANUFACTURING.
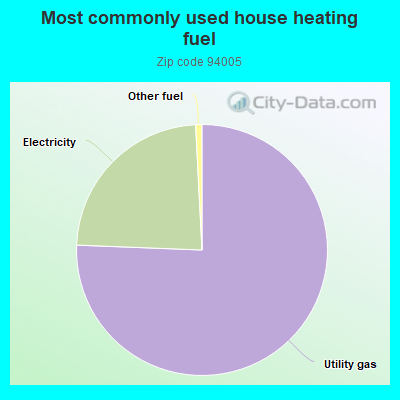
75.7%Utility gas
23.6%Electricity
0.8%Other fuel
Population in 1990: 2,952. Population change in the 1990s: +663 (+22.5%).
Place of birth for U.S.-born residents:
This state: 2,232
Northeast: 269
Midwest: 91
South: 204
West: 178
52% of the 94005 zip code residents lived in the same house 5 years ago. Out of people who lived in different houses, 36% lived in this county. Out of people who lived in different counties, 50% lived in California.
93% of the 94005 zip code residents lived in the same house 1 year ago. Out of people who lived in different houses, 21% moved from this county. Out of people who lived in different houses, 38% moved from different county within same state. Out of people who lived in different houses, 47% moved from different state.
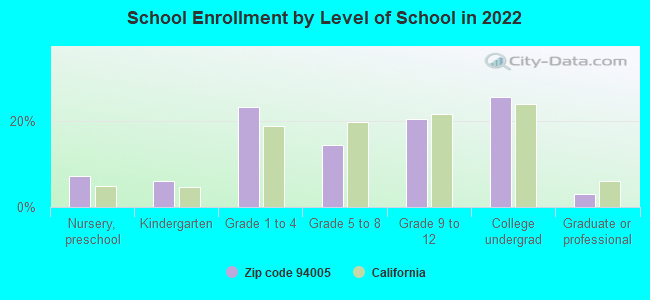
Private vs. public school enrollment:
Students in private schools in grades 1 to 8 (elementary and middle school): 102
Here:
23.3%
California:
10.5%
Students in private schools in grades 9 to 12 (high school): 63
Here:
27.1%
California:
8.5%
Students in private undergraduate colleges:
Here:
0.0%
California:
15.9%
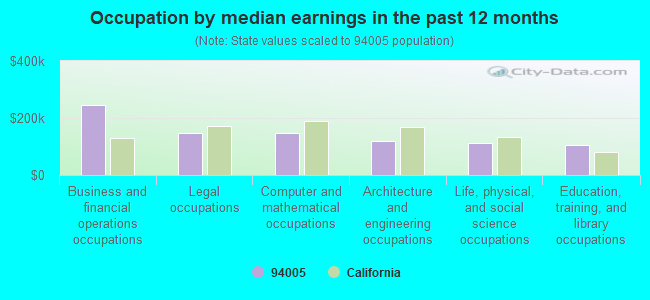
Occupation by median earnings in the past 12 months ($)
247,175Business and financial operations occupations
147,079Legal occupations
146,808Computer and mathematical occupations
120,793Architecture and engineering occupations
112,253Life, physical, and social science occupations
104,493Education, training, and library occupations
Companies with federal contracts located in this zip code (BRISBANE, CA):
ALIPHCOM (8000 MARINA BLVD; small business) : $2,186,514 in 6 contractsfrom 2002 to 2004
Contracts for Other Sciences Not Elsewhere Classified -- Advanced Development (R&D), Other Defense -- Advanced Development (R&D) by Navy, Department of Defense Signed by year:2000: $0; 2001: $0; 2002: $451,600; 2003: $1,119,700; 2004: $615,214; 2005: $0; 2006: $0.
Biggest contracts:
$515,500 with Navy for Other Sciences Not Elsewhere Classified -- Advanced Development (R&D). Signed on 2003-01-30. Completion date: 2003-01-30.
$470,000, same as above.Signed on 2003-06-25. Completion date: 2005-09-30.
$451,600 with Department of Defense for Other Defense -- Advanced Development (R&D). Signed on 2002-05-15. Completion date: 2002-09-18.
$347,365 with Navy for Other Sciences Not Elsewhere Classified -- Advanced Development (R&D). Signed on 2004-06-10. Completion date: 2005-09-30.
CUTERA INC (3240 BAYSHORE BLVD; small business) : $697,400 in 8 contractsfrom 2002 to 2005
Contracts for Medical and Surgical Instruments, Equipment, and Supplies, X-Ray Equipment and Supplies: Medical, Dental, Veterinary, Installation of Equipment -- Medical, Dental, and Veterinary Equipment and Supplies, Maintenance, Repair and Rebuilding of Equipment -- Medical, Dental, and Veterinary Equipment and Supplies by Army, Defense Logistics Agency, Minerals Management Service, Navy, and others Signed by year:2000: $0; 2001: $0; 2002: $99,900; 2003: $92,000; 2004: $19,000; 2005: $486,500; 2006: $0.
Biggest contracts:
$350,000 with Army for Medical and Surgical Instruments, Equipment, and Supplies. Signed on 2005-09-20. Completion date: 2005-10-20.
$127,000 with Defense Logistics Agency for X-Ray Equipment and Supplies: Medical, Dental, Veterinary. Signed on 2005-01-25. Completion date: 2005-02-01.
$99,900 with Minerals Management Service for Installation of Equipment -- Medical, Dental, and Veterinary Equipment and Supplies. Signed on 2002-12-15. Completion date: 2003-02-15.
$92,000 with Army for Medical and Surgical Instruments, Equipment, and Supplies. Taking place in GA. Signed on 2003-09-29. Completion date: 2003-10-31.
MACHINERY & EQUIPMENT COMPANY, (3401 BAYSHORE BLVD; small business)
$79,390 with Army for Laboratory Equipment and Supplies. Signed on 2005-05-17. Completion date: 2005-06-01.
HERRING & ROBINSON (100 NORTH HILL DRIVE #5; small business) : $11,419 in 3 contractsfrom 2004 to 2006
$7,890 with Air Force for Print/Binding Services. Signed on 2005-10-01. Completion date: 2006-09-30.
$6,819 with Air Force for Maintenance, Repair and Rebuilding of Equipment -- Books, Maps, and Other Publications. Signed on 2004-10-01. Completion date: 2005-09-30.
-$3,290 with Air Force for Print/Binding Services. Signed on 2006-06-19. Completion date: 2006-09-30.
Top industries in this zip code by the number of employees in 2005:
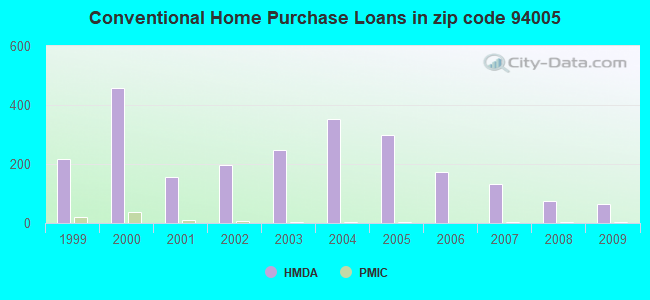
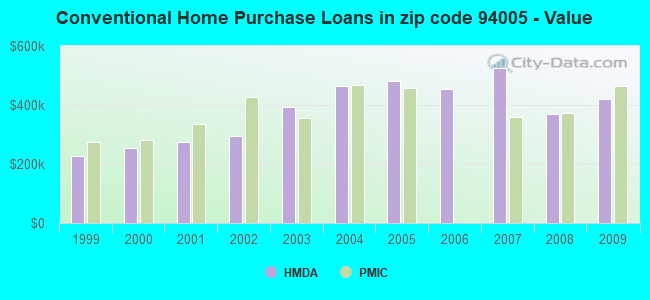
Detailed PMIC statistics for the following Tracts:6001.00
2005 - 2018 National Fire Incident Reporting System (NFIRS) incidents
According to the data from the years 2005 - 2018 the average number of fire incidents per year is 51. The highest number of fire incidents - 82 took place in 2005, and the least - 31 in 2018. The data has a decreasing trend.
When looking into fire subcategories, the most incidents belonged to: Outside Fires (53.1%), and Structure Fires (28.1%).
Fire incident types reported to NFIRS in Zip Code 94005


 Nearest zip codes: 94134, 94080, 94014, 94112, 94124, 94110.
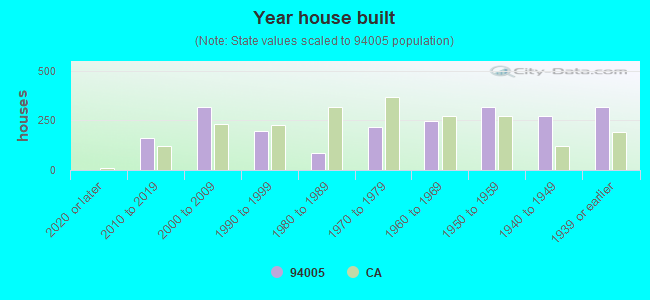


 According to the data from the years 2005 - 2018 the average number of fire incidents per year is 51. The highest number of fire incidents - 82 took place in 2005, and the least - 31 in 2018. The data has a decreasing trend.
 When looking into fire subcategories, the most incidents belonged to: Outside Fires (53.1%), and Structure Fires (28.1%).