Estimated zip code population in 2022: 64,584 Zip code population in 2010: 60,927 Zip code population in 2000: 63,317
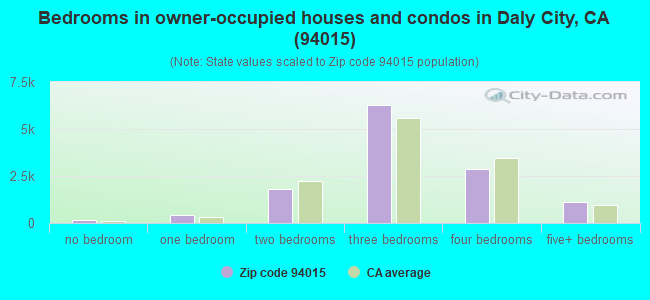
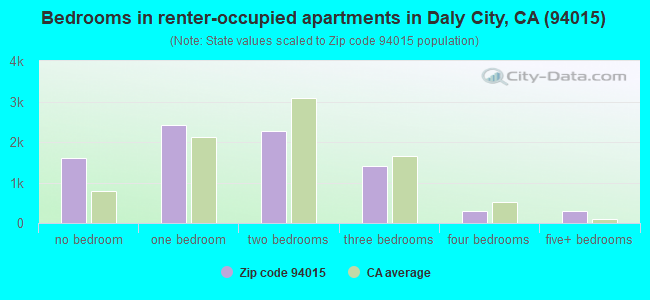
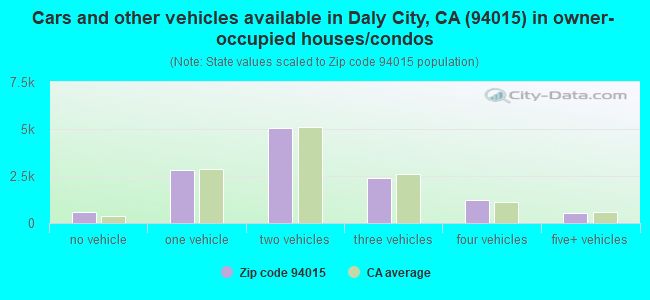
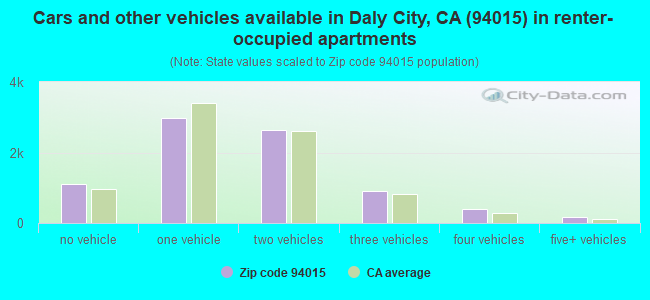
Houses and condos: 22,353 Renter-occupied apartments: 8,206
% of renters here:
39%
State:
44%
March 2022 cost of living index in zip code 94015: 132.2 (high, U.S. average is 100)
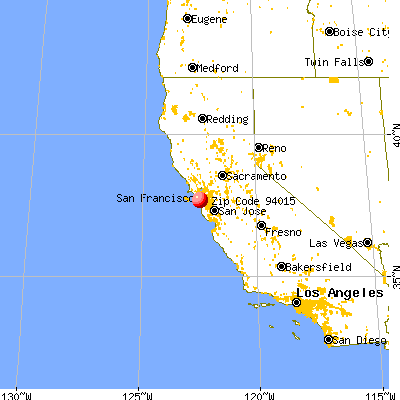
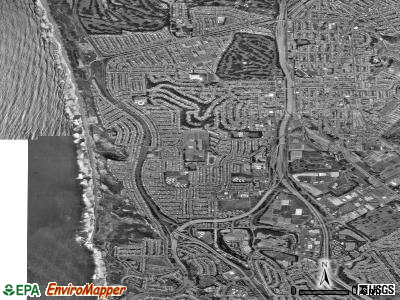
Land area: 5.8 sq. mi. Water area: 0.0 sq. mi.
Population density: 11,206 people per square mile
(high).
OSM Map
General Map
Google Map
MSN Map
OSM Map
General Map
Google Map
MSN Map
OSM Map
General Map
Google Map
MSN Map
OSM Map
General Map
Google Map
MSN Map
Please wait while loading the map...
Real estate property taxes paid for housing units in 2022:
This zip code:
0.5% ($6,026)
California:
0.7% ($4,831)
Median real estate property taxes paid for housing units with mortgages in 2022: $6,818 (0.6%) Median real estate property taxes paid for housing units with no mortgage in 2022: $4,532 (0.4%)
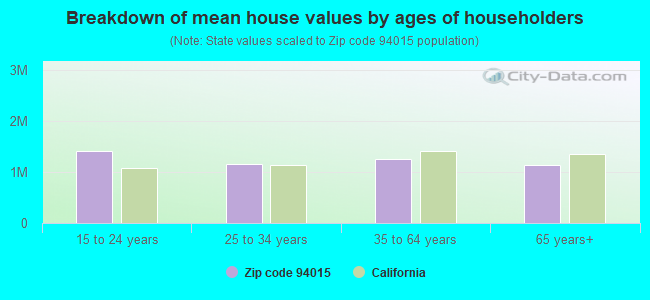
Estimated median house/condo value in 2022: $1,212,784
94015:
$1,212,784
California:
$715,900
According to our research of California and other state lists, there were 38 registered sex offenders living in 94015 zip code as of April 27, 2024. The ratio of all residents to sex offenders in zip code 94015 is 1,727 to 1. The ratio of registered sex offenders to all residents in this zip code is lower than the state average.
Median resident age:
This zip code:
41.4 years
California median age:
37.9 years
Average household size:
This zip code:
3.1 people
California:
2.8 people
Averages for the 2020 tax year for zip code 94015, filed in 2021:
Average Adjusted Gross Income (AGI) in 2020: $79,566 (Individual Income Tax Returns)
Here:
$79,566
State:
$95,910
Salary/wage: $73,532 (reported on 81.0% of returns)
Here:
$73,532
State:
$77,331
(% of AGI for various income ranges: 1193.9% for AGIs below $25k, 3886.7% for AGIs $25k-50k, 7124.7% for AGIs $50k-75k, 10766.8% for AGIs $75k-100k, 20395.6% for AGIs $100k-200k, 88374.8% for AGIs over 200k)
Taxable interest for individuals: $1,292 (reported on 36.2% of returns)
This zip code:
$1,292
California:
$2,294
(% of AGI for various income ranges: 25.3% for AGIs below $25k, 29.6% for AGIs $25k-50k, 48.8% for AGIs $50k-75k, 93.8% for AGIs $75k-100k, 154.4% for AGIs $100k-200k, 626.0% for AGIs over 200k)
Ordinary dividends: $3,692 (reported on 22.0% of returns)
Here:
$3,692
State:
$10,949
(% of AGI for various income ranges: 31.1% for AGIs below $25k, 30.9% for AGIs $25k-50k, 60.7% for AGIs $50k-75k, 127.7% for AGIs $75k-100k, 272.2% for AGIs $100k-200k, 1555.5% for AGIs over 200k)
Net capital gain/loss in AGI: +$13,105 (reported on 20.9% of returns)
Here:
+$13,105
State:
+$49,306
(% of AGI for various income ranges: 13.7% for AGIs below $25k, 38.7% for AGIs $25k-50k, 85.4% for AGIs $50k-75k, 165.2% for AGIs $75k-100k, 447.5% for AGIs $100k-200k, 10079.8% for AGIs over 200k)
Profit/loss from business: +$11,502 (reported on 15.6% of returns)
Here:
+$11,502
State:
+$15,671
(% of AGI for various income ranges: 222.5% for AGIs below $25k, 205.9% for AGIs $25k-50k, 190.4% for AGIs $50k-75k, 309.3% for AGIs $75k-100k, 407.6% for AGIs $100k-200k, 1835.4% for AGIs over 200k)
Taxable individual retirement arrangement distribution: $17,327 (reported on 6.3% of returns)
94015:
$17,327
California:
$23,505
(% of AGI for various income ranges: 49.9% for AGIs below $25k, 68.7% for AGIs $25k-50k, 118.7% for AGIs $50k-75k, 222.7% for AGIs $75k-100k, 459.4% for AGIs $100k-200k, 1069.1% for AGIs over 200k)
Self-employed (Keogh) retirement plans: $18,446 (reported on 0.4% of returns)
94015:
$18,446
California:
$30,163
(% of AGI for various income ranges: 7.4% for AGIs $25k-50k, 22.8% for AGIs $100k-200k, 208.0% for AGIs over 200k)
Total itemized deductions: $32,596 (reported on 14.5% of returns)
Here:
$32,596
State:
$39,517
(% of AGI for various income ranges: 106.8% for AGIs below $25k, 220.5% for AGIs $25k-50k, 471.0% for AGIs $50k-75k, 851.1% for AGIs $75k-100k, 1883.5% for AGIs $100k-200k, 6880.0% for AGIs over 200k)
Charity contributions: $5,304 (reported on 11.4% of returns)
Here:
$5,304
State:
$12,598
(% of AGI for various income ranges: 4.3% for AGIs below $25k, 30.7% for AGIs $25k-50k, 54.7% for AGIs $50k-75k, 100.7% for AGIs $75k-100k, 224.7% for AGIs $100k-200k, 1065.7% for AGIs over 200k)
Taxes paid: $8,880 (reported on 14.5% of returns)
94015:
$8,880
State:
$8,807
(% of AGI for various income ranges: 23.3% for AGIs below $25k, 55.0% for AGIs $25k-50k, 121.4% for AGIs $50k-75k, 260.9% for AGIs $75k-100k, 562.3% for AGIs $100k-200k, 1654.9% for AGIs over 200k)
Earned income credit: $1,490 (reported on 8.1% of returns)
Here:
$1,490
State:
$2,074
(% of AGI for various income ranges: 48.0% for AGIs below $25k, 34.9% for AGIs $25k-50k, 0.4% for AGIs $50k-75k)
Percentage of individuals using paid preparers for their 2020 taxes: 89.1%
Here:
89%
State:
92%
(% for various income ranges: 86.8% for AGIs below $25k, 90.0% for AGIs $25k-50k, 89.9% for AGIs $50k-75k, 88.4% for AGIs $75k-100k, 89.5% for AGIs $100k-200k, 92.1% for AGIs over 200k)
Averages for the 2012 tax year for zip code 94015, filed in 2013:
Average Adjusted Gross Income (AGI) in 2012: $58,445 (Individual Income Tax Returns)
Here:
$58,445
State:
$72,726
Salary/wage: $55,163 (reported on 84.7% of returns)
Here:
$55,163
State:
$59,079
(% of AGI for various income ranges: 74.9% for AGIs below $25k, 83.5% for AGIs $25k-50k, 80.8% for AGIs $50k-75k, 80.7% for AGIs $75k-100k, 82.4% for AGIs $100k-200k, 69.2% for AGIs over 200k)
Taxable interest for individuals: $891 (reported on 36.5% of returns)
This zip code:
$891
California:
$2,146
(% of AGI for various income ranges: 0.9% for AGIs below $25k, 0.5% for AGIs $25k-50k, 0.5% for AGIs $50k-75k, 0.5% for AGIs $75k-100k, 0.4% for AGIs $100k-200k, 1.0% for AGIs over 200k)
Ordinary dividends: $3,062 (reported on 17.9% of returns)
Here:
$3,062
State:
$9,308
(% of AGI for various income ranges: 1.2% for AGIs below $25k, 0.6% for AGIs $25k-50k, 0.9% for AGIs $50k-75k, 0.8% for AGIs $75k-100k, 0.9% for AGIs $100k-200k, 1.5% for AGIs over 200k)
Net capital gain/loss in AGI: +$5,441 (reported on 13.3% of returns)
Here:
+$5,441
State:
+$30,460
(% of AGI for various income ranges: 0.2% for AGIs $75k-100k, 0.7% for AGIs $100k-200k, 8.6% for AGIs over 200k)
Profit/loss from business: +$13,553 (reported on 13.3% of returns)
Here:
+$13,553
State:
+$17,064
(% of AGI for various income ranges: 9.9% for AGIs below $25k, 3.6% for AGIs $25k-50k, 3.0% for AGIs $50k-75k, 2.1% for AGIs $75k-100k, 1.9% for AGIs $100k-200k, 3.2% for AGIs over 200k)
Taxable individual retirement arrangement distribution: $13,909 (reported on 7.2% of returns)
94015:
$13,909
California:
$19,557
(% of AGI for various income ranges: 2.4% for AGIs below $25k, 1.5% for AGIs $25k-50k, 1.8% for AGIs $50k-75k, 1.8% for AGIs $75k-100k, 1.6% for AGIs $100k-200k, 1.5% for AGIs over 200k)
Self-employment retirement plans: $13,550 (reported on 0.5% of returns)
94015:
$13,550
California:
$24,530
(% of AGI for various income ranges: 0.2% for AGIs below $25k, 0.1% for AGIs $50k-75k, 0.1% for AGIs $100k-200k, 0.3% for AGIs over 200k)
Total itemized deductions: $26,063 (25% of AGI, reported on 32.5% of returns)
Here:
$26,063
State:
$34,004
Here:
25.2% of AGI
State:
22.7% of AGI
(% of AGI for various income ranges: 8.7% for AGIs below $25k, 9.2% for AGIs $25k-50k, 12.7% for AGIs $50k-75k, 14.7% for AGIs $75k-100k, 18.2% for AGIs $100k-200k, 17.1% for AGIs over 200k)
Charity contributions: $2,381 (reported on 26.1% of returns)
Here:
$2,381
State:
$4,659
(% of AGI for various income ranges: 0.4% for AGIs below $25k, 0.7% for AGIs $25k-50k, 1.0% for AGIs $50k-75k, 1.1% for AGIs $75k-100k, 1.4% for AGIs $100k-200k, 1.1% for AGIs over 200k)
Taxes paid: $9,611 (reported on 32.5% of returns)
94015:
$9,611
State:
$14,448
(% of AGI for various income ranges: 2.0% for AGIs below $25k, 2.3% for AGIs $25k-50k, 3.6% for AGIs $50k-75k, 5.2% for AGIs $75k-100k, 7.4% for AGIs $100k-200k, 8.6% for AGIs over 200k)
Earned income credit: $1,669 (reported on 11.2% of returns)
Here:
$1,669
State:
$2,286
(% of AGI for various income ranges: 3.3% for AGIs below $25k, 0.6% for AGIs $25k-50k)
Percentage of individuals using paid preparers for their 2012 taxes: 56.0%
Here:
56%
State:
64%
(% for various income ranges: 52.6% for AGIs below $25k, 55.0% for AGIs $25k-50k, 57.0% for AGIs $50k-75k, 57.1% for AGIs $75k-100k, 61.7% for AGIs $100k-200k, 67.1% for AGIs over 200k)
Averages for the 2004 tax year for zip code 94015, filed in 2005:
Average Adjusted Gross Income (AGI) in 2004: $49,166 (Individual Income Tax Returns)
Here:
$49,166
State:
$58,600
Salary/wage: $45,357 (reported on 85.7% of returns)
Here:
$45,357
State:
$49,455
(% of AGI for various income ranges: 135.8% for AGIs below $10k, 76.5% for AGIs $10k-25k, 85.2% for AGIs $25k-50k, 84.0% for AGIs $50k-75k, 84.8% for AGIs $75k-100k, 68.7% for AGIs over 100k)
Taxable interest for individuals: $1,247 (reported on 47.2% of returns)
This zip code:
$1,247
California:
$2,365
(% of AGI for various income ranges: 6.8% for AGIs below $10k, 2.2% for AGIs $10k-25k, 1.1% for AGIs $25k-50k, 1.1% for AGIs $50k-75k, 1.1% for AGIs $75k-100k, 1.0% for AGIs over 100k)
Taxable dividends: $2,306 (reported on 22.0% of returns)
Here:
$2,306
State:
$4,746
(% of AGI for various income ranges: 4.4% for AGIs below $10k, 1.2% for AGIs $10k-25k, 0.8% for AGIs $25k-50k, 0.8% for AGIs $50k-75k, 0.8% for AGIs $75k-100k, 1.3% for AGIs over 100k)
Net capital gain/loss: +$4,476 (reported on 17.4% of returns)
Here:
+$4,476
State:
+$23,418
(% of AGI for various income ranges: -2.1% for AGIs below $10k, -0.2% for AGIs $10k-25k, -0.2% for AGIs $25k-50k, 0.2% for AGIs $50k-75k, 0.3% for AGIs $75k-100k, 4.5% for AGIs over 100k)
Profit/loss from business: +$13,503 (reported on 11.1% of returns)
Here:
+$13,503
State:
+$16,826
(% of AGI for various income ranges: -20.1% for AGIs below $10k, 6.9% for AGIs $10k-25k, 3.4% for AGIs $25k-50k, 2.5% for AGIs $50k-75k, 2.5% for AGIs $75k-100k, 3.3% for AGIs over 100k)
IRA payment deduction: $3,050 (reported on 3.0% of returns)
94015:
$3,050
California:
$3,192
(% of AGI for various income ranges: 0.5% for AGIs below $10k, 0.3% for AGIs $10k-25k, 0.3% for AGIs $25k-50k, 0.2% for AGIs $50k-75k, 0.1% for AGIs $75k-100k, 0.1% for AGIs over 100k)
Self-employed pension: $12,232 (reported on 0.7% of returns)
Here:
$12,232
California:
$17,688
(% of AGI for various income ranges: 0.0% for AGIs $10k-25k, 0.1% for AGIs $25k-50k, 0.1% for AGIs $50k-75k, 0.1% for AGIs $75k-100k, 0.3% for AGIs over 100k)
Total itemized deductions: $24,368 (28% of AGI, reported on 35.4% of returns)
Here:
$24,368
State:
$28,113
Here:
28.3% of AGI
State:
25.3% of AGI
(% of AGI for various income ranges: 21.4% for AGIs below $10k, 11.1% for AGIs $10k-25k, 13.0% for AGIs $25k-50k, 18.1% for AGIs $50k-75k, 22.0% for AGIs $75k-100k, 19.0% for AGIs over 100k)
Charity contributions deductions: $2,202 (2% of AGI, reported on 30.7% of returns)
Here:
$2,202
State:
$3,923
Here:
2.4% of AGI
State:
3.3% of AGI
(% of AGI for various income ranges: 0.7% for AGIs below $10k, 0.7% for AGIs $10k-25k, 0.9% for AGIs $25k-50k, 1.4% for AGIs $50k-75k, 1.7% for AGIs $75k-100k, 1.6% for AGIs over 100k)
Total tax: $6,296 (reported on 81.4% of returns)
94015:
$6,296
State:
$10,761
(% of AGI for various income ranges: 4.9% for AGIs below $10k, 4.9% for AGIs $10k-25k, 7.7% for AGIs $25k-50k, 9.3% for AGIs $50k-75k, 9.9% for AGIs $75k-100k, 14.3% for AGIs over 100k)
Earned income credit: $1,338 (reported on 9.5% of returns)
Here:
$1,338
State:
$1,763
Percentage of individuals using paid preparers for their 2004 taxes: 57.2%
Here:
57%
State:
66%
(% for various income ranges: 49.1% for AGIs below $10k, 57.1% for AGIs $10k-25k, 57.4% for AGIs $25k-50k, 59.7% for AGIs $50k-75k, 60.2% for AGIs $75k-100k, 62.8% for AGIs over 100k)
Likely homosexual households (counted as self-reported same-sex unmarried-partner households)
Lesbian couples: 0.1% of all households
Gay men: 0.3% of all households
Household received Food Stamps/SNAP in the past 12 months: 1,271 Household did not receive Food Stamps/SNAP in the past 12 months: 19,270
Women who had a birth in the past 12 months: 798 (537 now married, 261 unmarried) Women who did not have a birth in the past 12 months: 14,435 (5,607 now married, 8,832 unmarried)
Housing units in zip code 94015 with a mortgage: 8,273 (1,013 second mortgage, 233 home equity loan, 704 both second mortgage and home equity loan) Houses without a mortgage: 129
Median monthly owner costs for units with a mortgage: $3,273 Median monthly owner costs for units without a mortgage: $764
Residents with income below the poverty level in 2022:
This zip code:
7.4%
Whole state:
12.2%
Residents with income below 50% of the poverty level in 2022:
This zip code:
2.9%
Whole state:
6.2%
Median number of rooms in houses and condos:
Here:
5.7
State:
6.0
Median number of rooms in apartments:
Here:
3.2
State:
3.9
Notable locations in this zip code not listed on our city pages
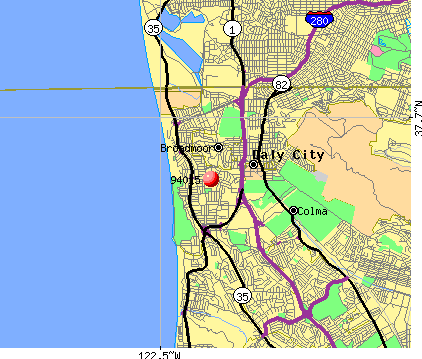
Notable locations in zip code 94015: Lake Merced Country Club (A), Westlake Branch Daly City Public Library (B), North County Fire Authority Station 91 (C), North County Fire Authority Station 95 (D), North County Fire Authority Station 94 (E). Display/hide their locations on the map
Shopping Centers: Serramonte Shopping Center (1), Skyline Plaza Shopping Center (2), Westlake Shopping Center (3), Saint Francis Square Shopping Center (4), Broadmoor Shopping Center (5), King Plaza Shopping Center (6). Display/hide their locations on the map
Parks in zip code 94015 include: Thornton Beach State Park (1), Mussel Rock City Park (2), Northridge City Park (3), Palisades Park (4), Canterbury Tot Lot (5), Hampshire Tot Lot (6), Lysett Tot Lot (7), Longview Park (8), Westlake Park (9). Display/hide their locations on the map
6,603 married couples with children.
1,475 single-parent households (330 men, 1,145 women).
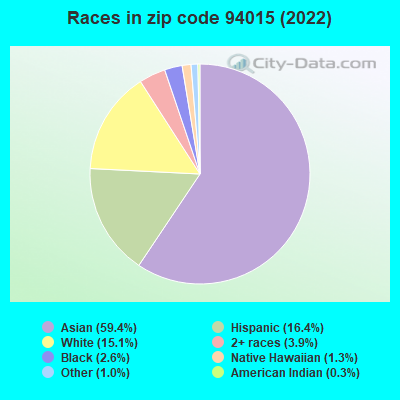
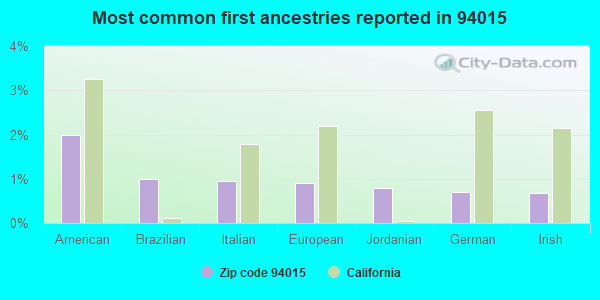
40.9% of residents of 94015 zip code speak English at home.
10.5% of residents speak Spanish at home (68% very well, 14% well, 13% not well, 5% not at all).
4.1% of residents speak other Indo-European language at home (71% very well, 21% well, 8% not well).
43.2% of residents speak Asian or Pacific Island language at home (56% very well, 29% well, 13% not well, 3% not at all).
1.9% of residents speak other language at home (63% very well, 22% well, 11% not well, 4% not at all).
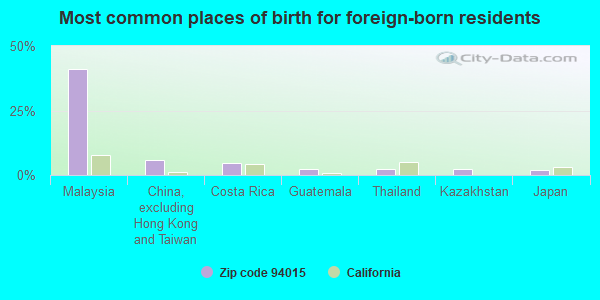
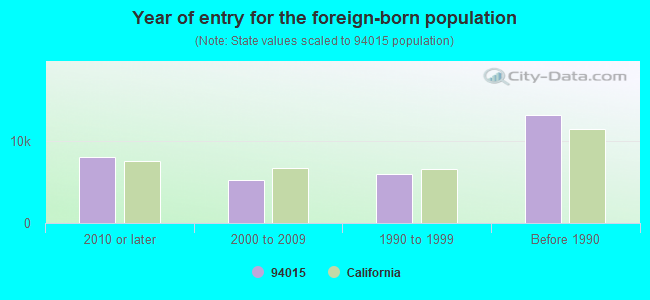
Foreign born population: 30,802 (47.7%) (74.8% of them are naturalized citizens)
Major facilities with environmental interests located in this zip code:
CHEVRON STATION 94632 (410 HICKEY BLVD in DALY CITY, CA)
STATE MASTER (California - Hazardous Waste Tracking) - HAZARDOU WASTE PROGRAM HAZARDOUS WASTE BIENNIAL REPORTER (Resource Conservation and Recovery Act (tracking hazardous waste)) Small Quantity Generators, between 100 kg and 1000 kg of hazardous waste/month (Resource Conservation and Recovery Act (tracking hazardous waste)) - notification Organizations: CHEVRON PRODUCTS CO (CONTACT/OWNER)
Alternative names: CHEVRON USA INC SERV STA #94632
GOMEZ IRON WORKS (1195 HILLSIDE BL in DALY CITY, CA)
STATE MASTER (California - Hazardous Waste Tracking) - HAZARDOU WASTE PROGRAM CRITERIA AND HAZARDOUS AIR POLLUTANT INVENTORY (Inventory of air pollution sources) Small Quantity Generators, between 100 kg and 1000 kg of hazardous waste/month (Resource Conservation and Recovery Act (tracking hazardous waste)) Business SIC classification: ARCHITECTURAL AND ORNAMENTAL METALWORK Business NAICS classification: ORNAMENTAL AND ARCHITECTURAL METAL WORK MANUFACTURING.
KAISER PERMANENTE MEDICAL OFFICES (395 HICKEY BLVD in DALY CITY, CA)
STATE MASTER (California - Hazardous Waste Tracking) - HAZARDOU WASTE PROGRAM Small Quantity Generators, between 100 kg and 1000 kg of hazardous waste/month (Resource Conservation and Recovery Act (tracking hazardous waste)) Organizations: SERRAMONTE CORP CENTER LLC (CONTACT/OWNER)
CHEVRON STATION NO 96982 (892 JOHN DALY BLVD in DALY CITY, CA)
STATE MASTER (California - Hazardous Waste Tracking) - HAZARDOU WASTE PROGRAM Small Quantity Generators, between 100 kg and 1000 kg of hazardous waste/month (Resource Conservation and Recovery Act (tracking hazardous waste)) Organizations: CHEVRON PRODUCTS CO (CONTACT/OWNER)
Alternative names: CHEVRON 96982, CHEVRON USA INC SERV STA #96982
EDISON (THOMAS) ELEMENTARY (1267 SOUTHGATE AVE. in DALY CITY, CA)
(National Center for Education Statistics) - STATE ID-6043871 Organizations: JEFFERSON ELEMENTARY (SCHOOL DISTRICT)
JSD COMMUNITY DAY (699 SERRAMONTE BLVD., RM. 226 in DALY CITY, CA)
(National Center for Education Statistics) - STATE ID-6118335 Organizations: JEFFERSON ELEMENTARY (SCHOOL DISTRICT)
JUNIPERO SERRA ELEMENTARY (151 VICTORIA ST. in DALY CITY, CA)
(National Center for Education Statistics) - STATE ID-6068282 Organizations: SOUTH SAN FRANCISCO UNIFIED (SCHOOL DISTRICT)
H & B TRUCKING (46 SOUTHDALE AVE in DALY CITY, CA)
TRANSPORTER (Resource Conservation and Recovery Act (tracking hazardous waste)) Organizations: BANKS HAROLD W (CONTACT/OWNER)
HOME DEPOT NO HD 1092 (303 E LAKE MERCED BLVD in DALY CITY, CA)
Small Quantity Generators, between 100 kg and 1000 kg of hazardous waste/month (Resource Conservation and Recovery Act (tracking hazardous waste)) Organizations: HOME DEPOT USA INC (CONTACT/OPERATOR)
JOFRAN CLEANERS (950 KING PLAZA UNIT 2 in DALY CITY, CA)
CRITERIA AND HAZARDOUS AIR POLLUTANT INVENTORY (Inventory of air pollution sources) Small Quantity Generators, between 100 kg and 1000 kg of hazardous waste/month (Resource Conservation and Recovery Act (tracking hazardous waste)) - notification Business SIC classification: DRYCLEANING PLANTS, EXCEPT RUG CLEANING Organizations: ROGER JOLOYA (CONTACT/OWNER)
KRAMES COMMUNICATIONS (312 90TH ST in DALY CITY, CA)
Small Quantity Generators, between 100 kg and 1000 kg of hazardous waste/month (Resource Conservation and Recovery Act (tracking hazardous waste)) Organizations: GROLIER (CONTACT/OWNER)
MASTERS AUTOBODY (7031 MISSION STREET in DALY CITY, CA)
CRITERIA AND HAZARDOUS AIR POLLUTANT INVENTORY (Inventory of air pollution sources) Small Quantity Generators, between 100 kg and 1000 kg of hazardous waste/month (Resource Conservation and Recovery Act (tracking hazardous waste)) - notification Business SIC classification: TOP, BODY, AND UPHOLSTERY REPAIR SHOPS AND PAINT SHOPS Organizations: ERIC STEEG (CONTACT/OWNER)
Alternative names: MASTERS AUTO BODY
EXPRESSLY PORTRAITS INC (49 SERRAMONTE CTR in DALY CITY, CA)
Small Quantity Generators, between 100 kg and 1000 kg of hazardous waste/month (Resource Conservation and Recovery Act (tracking hazardous waste)) - notification
Housing units lacking complete plumbing facilities: 0.4% Housing units lacking complete kitchen facilities: 1.1%
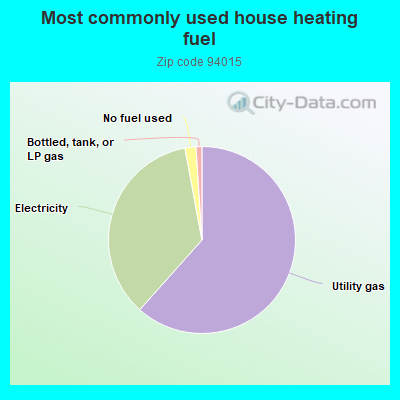
61.3%Utility gas
35.3%Electricity
1.9%No fuel used
1.0%Bottled, tank, or LP gas
Population in 1990: 57,354. Population change in the 1990s: +5,963 (+10.4%).
Place of birth for U.S.-born residents:
This state: 28,638
Northeast: 953
Midwest: 765
South: 1,183
West: 880
61% of the 94015 zip code residents lived in the same house 5 years ago. Out of people who lived in different houses, 43% lived in this county. Out of people who lived in different counties, 50% lived in California.
92% of the 94015 zip code residents lived in the same house 1 year ago. Out of people who lived in different houses, 44% moved from this county. Out of people who lived in different houses, 41% moved from different county within same state. Out of people who lived in different houses, 9% moved from different state. Out of people who lived in different houses, 10% moved from abroad.
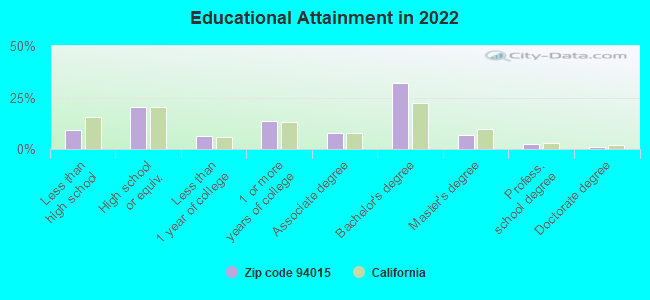
Private vs. public school enrollment:
Students in private schools in grades 1 to 8 (elementary and middle school): 1,241
Here:
28.8%
California:
10.5%
Students in private schools in grades 9 to 12 (high school): 490
Here:
24.6%
California:
8.5%
Students in private undergraduate colleges: 751
Here:
16.1%
California:
15.9%
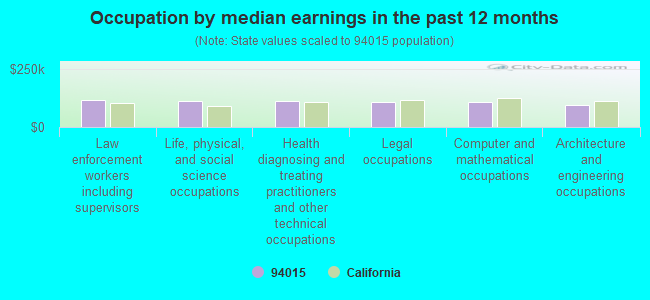
Occupation by median earnings in the past 12 months ($)
117,313Law enforcement workers including supervisors
114,416Life, physical, and social science occupations
112,758Health diagnosing and treating practitioners and other technical occupations
109,206Legal occupations
107,143Computer and mathematical occupations
96,893Architecture and engineering occupations
Top industries in this zip code by the number of employees in 2005:
Health Care and Social Assistance: General Medical and Surgical Hospitals (over 1000 employees: 1 establishment)
2005 - 2018 National Fire Incident Reporting System (NFIRS) incidents
According to the data from the years 2005 - 2018 the average number of fire incidents per year is 143. The highest number of fire incidents - 206 took place in 2009, and the least - 23 in 2018. The data has a decreasing trend.
When looking into fire subcategories, the most incidents belonged to: Structure Fires (58.1%), and Outside Fires (23.7%).
Fire incident types reported to NFIRS in Zip Code 94015


 Nearest zip codes: 94014, 94132, 94112, 94127, 94080, 94116.


 According to the data from the years 2005 - 2018 the average number of fire incidents per year is 143. The highest number of fire incidents - 206 took place in 2009, and the least - 23 in 2018. The data has a decreasing trend.
 When looking into fire subcategories, the most incidents belonged to: Structure Fires (58.1%), and Outside Fires (23.7%).