Estimated zip code population in 2022: 67,797 Zip code population in 2010: 57,349 Zip code population in 2000: 49,948
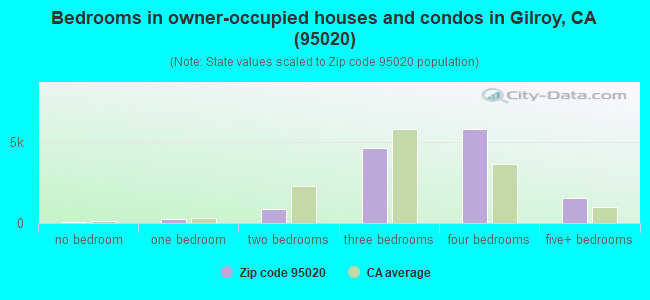
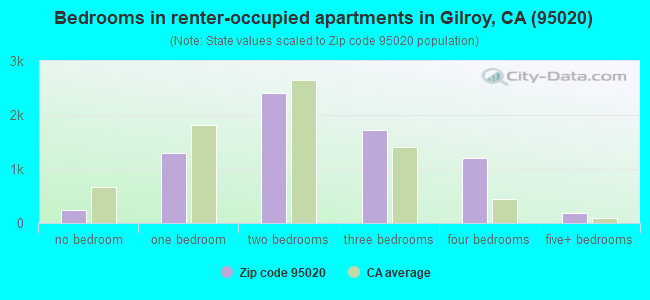
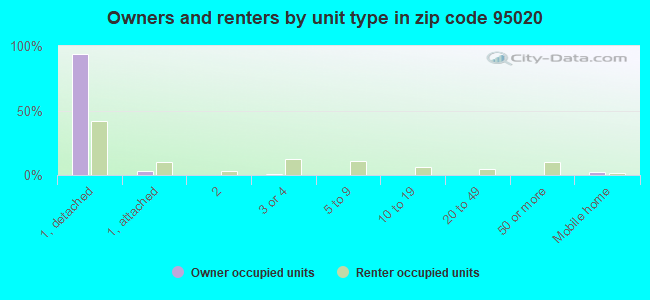
Houses and condos: 20,977 Renter-occupied apartments: 7,065
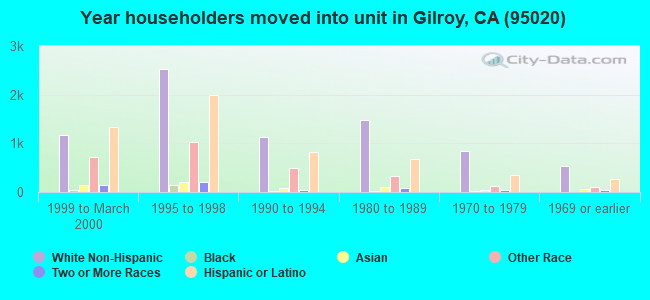
% of renters here:
35%
State:
44%
March 2022 cost of living index in zip code 95020: 121.1 (high, U.S. average is 100)
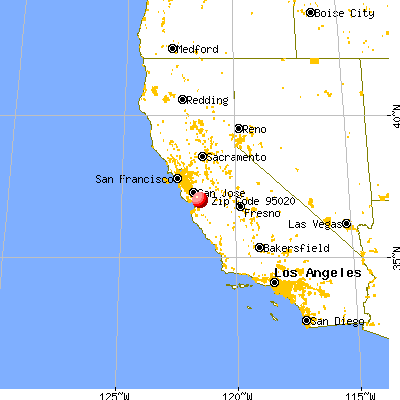
Land area: 156.0 sq. mi. Water area: 0.9 sq. mi.
Population density: 435 people per square mile
(low).
OSM Map
General Map
Google Map
MSN Map
OSM Map
General Map
Google Map
MSN Map
OSM Map
General Map
Google Map
MSN Map
OSM Map
General Map
Google Map
MSN Map
Please wait while loading the map...
Real estate property taxes paid for housing units in 2022:
This zip code:
0.8% ($7,837)
California:
0.7% ($4,831)
Median real estate property taxes paid for housing units with mortgages in 2022: $8,725 (0.8%) Median real estate property taxes paid for housing units with no mortgage in 2022: $5,319 (0.6%)
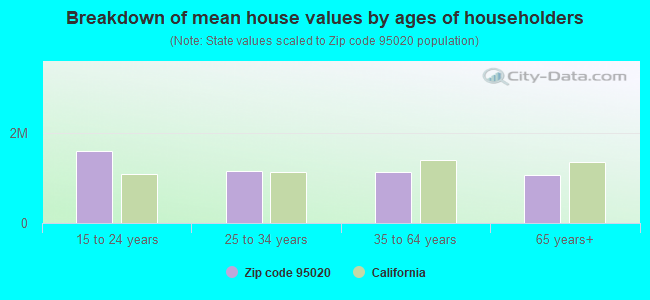
Estimated median house/condo value in 2022: $1,025,041
95020:
$1,025,041
California:
$715,900
According to our research of California and other state lists, there were 100 registered sex offenders living in 95020 zip code as of April 27, 2024. The ratio of all residents to sex offenders in zip code 95020 is 624 to 1. The ratio of registered sex offenders to all residents in this zip code is near the state average.
Median resident age:
This zip code:
36.8 years
California median age:
37.9 years
Average household size:
This zip code:
3.3 people
California:
2.8 people
Averages for the 2020 tax year for zip code 95020, filed in 2021:
Average Adjusted Gross Income (AGI) in 2020: $98,551 (Individual Income Tax Returns)
Here:
$98,551
State:
$95,910
Salary/wage: $84,258 (reported on 84.6% of returns)
Here:
$84,258
State:
$77,331
(% of AGI for various income ranges: 1382.3% for AGIs below $25k, 4323.1% for AGIs $25k-50k, 7857.9% for AGIs $50k-75k, 10981.8% for AGIs $75k-100k, 21202.3% for AGIs $100k-200k, 91187.0% for AGIs over 200k)
Taxable interest for individuals: $1,245 (reported on 34.8% of returns)
This zip code:
$1,245
California:
$2,294
(% of AGI for various income ranges: 12.8% for AGIs below $25k, 17.6% for AGIs $25k-50k, 39.5% for AGIs $50k-75k, 85.5% for AGIs $75k-100k, 99.4% for AGIs $100k-200k, 650.6% for AGIs over 200k)
Ordinary dividends: $5,585 (reported on 17.8% of returns)
Here:
$5,585
State:
$10,949
(% of AGI for various income ranges: 18.8% for AGIs below $25k, 37.7% for AGIs $25k-50k, 72.1% for AGIs $50k-75k, 141.4% for AGIs $75k-100k, 219.1% for AGIs $100k-200k, 1722.3% for AGIs over 200k)
Net capital gain/loss in AGI: +$36,361 (reported on 17.8% of returns)
Here:
+$36,361
State:
+$49,306
(% of AGI for various income ranges: 12.6% for AGIs below $25k, 27.2% for AGIs $25k-50k, 87.6% for AGIs $50k-75k, 151.1% for AGIs $75k-100k, 421.0% for AGIs $100k-200k, 17813.5% for AGIs over 200k)
Profit/loss from business: +$17,944 (reported on 14.9% of returns)
Here:
+$17,944
State:
+$15,671
(% of AGI for various income ranges: 126.3% for AGIs below $25k, 202.1% for AGIs $25k-50k, 243.6% for AGIs $50k-75k, 406.0% for AGIs $75k-100k, 666.2% for AGIs $100k-200k, 3380.3% for AGIs over 200k)
Taxable individual retirement arrangement distribution: $21,563 (reported on 6.2% of returns)
95020:
$21,563
California:
$23,505
(% of AGI for various income ranges: 32.3% for AGIs below $25k, 64.1% for AGIs $25k-50k, 127.1% for AGIs $50k-75k, 323.0% for AGIs $75k-100k, 514.5% for AGIs $100k-200k, 1266.7% for AGIs over 200k)
Self-employed (Keogh) retirement plans: $26,520 (reported on 0.6% of returns)
95020:
$26,520
California:
$30,163
(% of AGI for various income ranges: 15.4% for AGIs $50k-75k, 43.4% for AGIs $100k-200k, 358.3% for AGIs over 200k)
Total itemized deductions: $34,795 (reported on 21.8% of returns)
Here:
$34,795
State:
$39,517
(% of AGI for various income ranges: 113.2% for AGIs below $25k, 214.9% for AGIs $25k-50k, 536.5% for AGIs $50k-75k, 1369.2% for AGIs $75k-100k, 2967.5% for AGIs $100k-200k, 9345.3% for AGIs over 200k)
Charity contributions: $5,584 (reported on 17.3% of returns)
Here:
$5,584
State:
$12,598
(% of AGI for various income ranges: 4.2% for AGIs below $25k, 16.6% for AGIs $25k-50k, 55.8% for AGIs $50k-75k, 120.5% for AGIs $75k-100k, 297.0% for AGIs $100k-200k, 1638.7% for AGIs over 200k)
Taxes paid: $9,388 (reported on 21.7% of returns)
95020:
$9,388
State:
$8,807
(% of AGI for various income ranges: 23.9% for AGIs below $25k, 53.5% for AGIs $25k-50k, 153.7% for AGIs $50k-75k, 402.3% for AGIs $75k-100k, 872.5% for AGIs $100k-200k, 2280.9% for AGIs over 200k)
Earned income credit: $2,040 (reported on 10.4% of returns)
Here:
$2,040
State:
$2,074
(% of AGI for various income ranges: 74.6% for AGIs below $25k, 61.1% for AGIs $25k-50k, 0.7% for AGIs $50k-75k)
Percentage of individuals using paid preparers for their 2020 taxes: 92.5%
Here:
92%
State:
92%
(% for various income ranges: 90.5% for AGIs below $25k, 92.7% for AGIs $25k-50k, 92.9% for AGIs $50k-75k, 92.5% for AGIs $75k-100k, 93.6% for AGIs $100k-200k, 94.5% for AGIs over 200k)
Averages for the 2012 tax year for zip code 95020, filed in 2013:
Average Adjusted Gross Income (AGI) in 2012: $71,209 (Individual Income Tax Returns)
Here:
$71,209
State:
$72,726
Salary/wage: $60,955 (reported on 86.4% of returns)
Here:
$60,955
State:
$59,079
(% of AGI for various income ranges: 80.4% for AGIs below $25k, 81.9% for AGIs $25k-50k, 78.1% for AGIs $50k-75k, 76.8% for AGIs $75k-100k, 80.2% for AGIs $100k-200k, 61.1% for AGIs over 200k)
Taxable interest for individuals: $1,207 (reported on 34.8% of returns)
This zip code:
$1,207
California:
$2,146
(% of AGI for various income ranges: 0.6% for AGIs below $25k, 0.5% for AGIs $25k-50k, 0.5% for AGIs $50k-75k, 0.6% for AGIs $75k-100k, 0.6% for AGIs $100k-200k, 0.6% for AGIs over 200k)
Ordinary dividends: $5,121 (reported on 17.5% of returns)
Here:
$5,121
State:
$9,308
(% of AGI for various income ranges: 0.9% for AGIs below $25k, 0.7% for AGIs $25k-50k, 0.9% for AGIs $50k-75k, 0.9% for AGIs $75k-100k, 0.9% for AGIs $100k-200k, 2.1% for AGIs over 200k)
Net capital gain/loss in AGI: +$16,583 (reported on 15.1% of returns)
Here:
+$16,583
State:
+$30,460
(% of AGI for various income ranges: 0.1% for AGIs $25k-50k, 0.4% for AGIs $50k-75k, 0.4% for AGIs $75k-100k, 1.2% for AGIs $100k-200k, 10.0% for AGIs over 200k)
Profit/loss from business: +$18,700 (reported on 14.5% of returns)
Here:
+$18,700
State:
+$17,064
(% of AGI for various income ranges: 7.7% for AGIs below $25k, 4.2% for AGIs $25k-50k, 4.0% for AGIs $50k-75k, 3.8% for AGIs $75k-100k, 3.1% for AGIs $100k-200k, 3.4% for AGIs over 200k)
Taxable individual retirement arrangement distribution: $17,958 (reported on 7.2% of returns)
95020:
$17,958
California:
$19,557
(% of AGI for various income ranges: 1.5% for AGIs below $25k, 1.8% for AGIs $25k-50k, 2.2% for AGIs $50k-75k, 2.5% for AGIs $75k-100k, 2.0% for AGIs $100k-200k, 1.3% for AGIs over 200k)
Self-employment retirement plans: $22,629 (reported on 0.7% of returns)
95020:
$22,629
California:
$24,530
(% of AGI for various income ranges: 0.4% for AGIs $50k-75k, 0.2% for AGIs $100k-200k, 0.3% for AGIs over 200k)
Total itemized deductions: $33,732 (25% of AGI, reported on 38.8% of returns)
Here:
$33,732
State:
$34,004
Here:
24.6% of AGI
State:
22.7% of AGI
(% of AGI for various income ranges: 9.1% for AGIs below $25k, 11.3% for AGIs $25k-50k, 17.6% for AGIs $50k-75k, 21.5% for AGIs $75k-100k, 22.4% for AGIs $100k-200k, 17.9% for AGIs over 200k)
Charity contributions: $3,497 (reported on 31.6% of returns)
Here:
$3,497
State:
$4,659
(% of AGI for various income ranges: 0.4% for AGIs below $25k, 0.7% for AGIs $25k-50k, 1.1% for AGIs $50k-75k, 1.6% for AGIs $75k-100k, 1.7% for AGIs $100k-200k, 2.0% for AGIs over 200k)
Taxes paid: $13,191 (reported on 38.7% of returns)
95020:
$13,191
State:
$14,448
(% of AGI for various income ranges: 1.8% for AGIs below $25k, 2.6% for AGIs $25k-50k, 5.0% for AGIs $50k-75k, 6.8% for AGIs $75k-100k, 8.4% for AGIs $100k-200k, 9.4% for AGIs over 200k)
Earned income credit: $2,284 (reported on 15.4% of returns)
Here:
$2,284
State:
$2,286
(% of AGI for various income ranges: 5.7% for AGIs below $25k, 1.0% for AGIs $25k-50k)
Percentage of individuals using paid preparers for their 2012 taxes: 63.6%
Here:
64%
State:
64%
(% for various income ranges: 58.9% for AGIs below $25k, 65.2% for AGIs $25k-50k, 66.7% for AGIs $50k-75k, 66.2% for AGIs $75k-100k, 66.1% for AGIs $100k-200k, 70.5% for AGIs over 200k)
Averages for the 2004 tax year for zip code 95020, filed in 2005:
Average Adjusted Gross Income (AGI) in 2004: $63,432 (Individual Income Tax Returns)
Here:
$63,432
State:
$58,600
Salary/wage: $56,628 (reported on 86.8% of returns)
Here:
$56,628
State:
$49,455
(% of AGI for various income ranges: 199.0% for AGIs below $10k, 79.9% for AGIs $10k-25k, 83.9% for AGIs $25k-50k, 82.0% for AGIs $50k-75k, 83.8% for AGIs $75k-100k, 72.2% for AGIs over 100k)
Taxable interest for individuals: $1,737 (reported on 45.1% of returns)
This zip code:
$1,737
California:
$2,365
(% of AGI for various income ranges: 13.2% for AGIs below $10k, 1.5% for AGIs $10k-25k, 0.9% for AGIs $25k-50k, 1.1% for AGIs $50k-75k, 1.0% for AGIs $75k-100k, 1.2% for AGIs over 100k)
Taxable dividends: $2,794 (reported on 21.9% of returns)
Here:
$2,794
State:
$4,746
(% of AGI for various income ranges: 6.3% for AGIs below $10k, 0.9% for AGIs $10k-25k, 0.7% for AGIs $25k-50k, 0.9% for AGIs $50k-75k, 0.6% for AGIs $75k-100k, 1.1% for AGIs over 100k)
Net capital gain/loss: +$16,110 (reported on 19.3% of returns)
Here:
+$16,110
State:
+$23,418
(% of AGI for various income ranges: 0.4% for AGIs below $10k, 0.3% for AGIs $10k-25k, 0.4% for AGIs $25k-50k, 0.9% for AGIs $50k-75k, 1.0% for AGIs $75k-100k, 8.2% for AGIs over 100k)
Profit/loss from business: +$18,843 (reported on 15.7% of returns)
Here:
+$18,843
State:
+$16,826
(% of AGI for various income ranges: 3.8% for AGIs below $10k, 5.6% for AGIs $10k-25k, 4.8% for AGIs $25k-50k, 4.5% for AGIs $50k-75k, 3.9% for AGIs $75k-100k, 4.8% for AGIs over 100k)
IRA payment deduction: $3,380 (reported on 2.5% of returns)
95020:
$3,380
California:
$3,192
(% of AGI for various income ranges: 0.3% for AGIs below $10k, 0.1% for AGIs $10k-25k, 0.2% for AGIs $25k-50k, 0.2% for AGIs $50k-75k, 0.2% for AGIs $75k-100k, 0.1% for AGIs over 100k)
Self-employed pension: $15,168 (reported on 1.2% of returns)
Here:
$15,168
California:
$17,688
(% of AGI for various income ranges: 0.1% for AGIs $10k-25k, 0.1% for AGIs $25k-50k, 0.2% for AGIs $50k-75k, 0.2% for AGIs $75k-100k, 0.4% for AGIs over 100k)
Total itemized deductions: $31,910 (29% of AGI, reported on 45.4% of returns)
Here:
$31,910
State:
$28,113
Here:
29.3% of AGI
State:
25.3% of AGI
(% of AGI for various income ranges: 42.8% for AGIs below $10k, 12.7% for AGIs $10k-25k, 20.1% for AGIs $25k-50k, 26.5% for AGIs $50k-75k, 29.2% for AGIs $75k-100k, 22.0% for AGIs over 100k)
Charity contributions deductions: $2,980 (3% of AGI, reported on 40.1% of returns)
Here:
$2,980
State:
$3,923
Here:
2.6% of AGI
State:
3.3% of AGI
(% of AGI for various income ranges: 1.6% for AGIs below $10k, 0.8% for AGIs $10k-25k, 1.3% for AGIs $25k-50k, 1.9% for AGIs $50k-75k, 2.2% for AGIs $75k-100k, 2.1% for AGIs over 100k)
Total tax: $10,676 (reported on 73.9% of returns)
95020:
$10,676
State:
$10,761
(% of AGI for various income ranges: 6.7% for AGIs below $10k, 3.8% for AGIs $10k-25k, 6.1% for AGIs $25k-50k, 8.0% for AGIs $50k-75k, 8.4% for AGIs $75k-100k, 16.7% for AGIs over 100k)
Earned income credit: $1,780 (reported on 11.7% of returns)
Here:
$1,780
State:
$1,763
Percentage of individuals using paid preparers for their 2004 taxes: 64.5%
Here:
65%
State:
66%
(% for various income ranges: 52.6% for AGIs below $10k, 63.3% for AGIs $10k-25k, 66.1% for AGIs $25k-50k, 68.1% for AGIs $50k-75k, 68.7% for AGIs $75k-100k, 70.0% for AGIs over 100k)
Household received Food Stamps/SNAP in the past 12 months: 1,791 Household did not receive Food Stamps/SNAP in the past 12 months: 18,199
Women who had a birth in the past 12 months: 833 (583 now married, 249 unmarried) Women who did not have a birth in the past 12 months: 14,850 (5,949 now married, 8,898 unmarried)
Housing units in zip code 95020 with a mortgage: 9,899 (1,080 second mortgage, 39 home equity loan, 823 both second mortgage and home equity loan) Houses without a mortgage: 43
Median monthly owner costs for units with a mortgage: $3,619 Median monthly owner costs for units without a mortgage: $820
Residents with income below the poverty level in 2022:
This zip code:
7.4%
Whole state:
12.2%
Residents with income below 50% of the poverty level in 2022:
This zip code:
3.7%
Whole state:
6.2%
Median number of rooms in houses and condos:
Here:
6.9
State:
6.0
Median number of rooms in apartments:
Here:
4.6
State:
3.9
Notable locations in this zip code not listed on our city pages
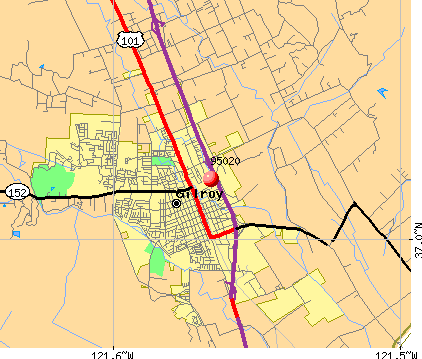
Notable locations in zip code 95020: Gilroy Country Club (A), Redwood Retreat (B), Santa Clara Tunnel (C), Z - Best Composting Facility (D), Pacheco Pass Landfill (E), Thomas Kruse Winery (F), Summerhill Vineyards (G), Sarahs Vineyard (H), Paul Masson Winery (I), Live Oaks Winery (J), Kirigin Cellars (K), Hecker Pass Winery (L), Gilroy Wastewater Treatment Plant (M), Gilroy Golf and Country Club (N), Gavilan College Golf Course (O), Fortino Winery (P), Conrotto Winery (Q), Carrousel Cellars (R), Gilroy Hot Springs (S), CALSTAR 2 Air Ambulance (T). Display/hide their locations on the map
Shopping Centers: Westwood Shopping Center (1), Town Plaza Shopping Center (2), The Outlets at Gilroy Shopping Center (3), South Valley Plaza Shopping Center (4), Pacific West Outlet Shopping Center (5), Horizon Outlet Shopping Center (6), Hecker Pass Shopping Center (7), Hecker Pass Plaza Shopping Center (8), Gilroy Plaza Shopping Center (9). Display/hide their locations on the map
Churches in zip code 95020 include: Apostolic Assembly of the Faith in Christ Jesus Church (A), Bethany Church of God in Christ (B), Christian Assembly Church (C), Christian Church of Gilroy (D), Church of Christ (E), Family Life Center (F), First Baptist Church (G), Foothills Foursquare Church (H), Full Gospel Prayer Tabernacle Church (I). Display/hide their locations on the map
Streams, rivers, and creeks: Bodfish Creek (A), Cañada De Los Osos (B), Elephant Head Creek (C), Little Arthur Creek (D), Live Oak Creek (E), Miller Slough (F), Uvas Creek (G), Tick Creek (H), Tar Creek (I). Display/hide their locations on the map
Parks in zip code 95020 include: Mount Madonna County Park (1), Butcher Park (2), Christmas Hills Park (3), El Roble Park (4), Forest Street Park (5), Las Animas Park (6), Miller Park (7), Ousley Park (8), Renz Park (9). Display/hide their locations on the map
11,147 married couples with children.
4,273 single-parent households (1,163 men, 3,110 women).
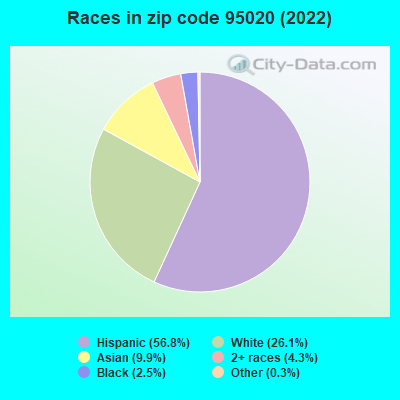
55.7% of residents of 95020 zip code speak English at home.
34.1% of residents speak Spanish at home (61% very well, 18% well, 14% not well, 7% not at all).
3.7% of residents speak other Indo-European language at home (70% very well, 21% well, 7% not well, 1% not at all).
5.8% of residents speak Asian or Pacific Island language at home (57% very well, 29% well, 11% not well, 3% not at all).
0.5% of residents speak other language at home (51% very well, 37% well, 11% not well).
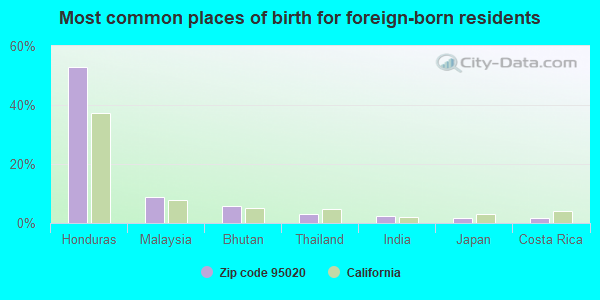
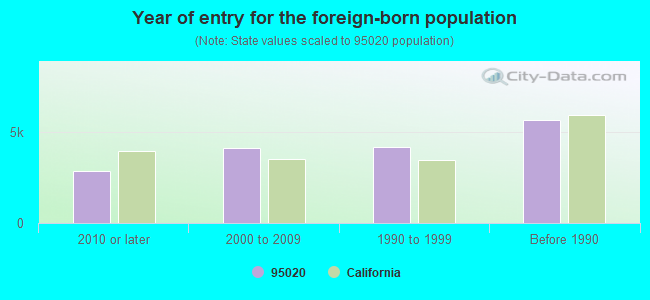
Foreign born population: 16,019 (23.6%) (53.7% of them are naturalized citizens)
Major facilities with environmental interests located in this zip code:
METECH INTERNATIONAL INCORPORATED (6200 ENGLE WY in GILROY, CA)
STATE MASTER (California - Hazardous Waste Tracking) - HAZARDOU WASTE PROGRAM COMPLIANCE ACTIVITY (Tracking inspections of insecticide, fungicide, and rodenticide, and toxic substances) CRITERIA AND HAZARDOUS AIR POLLUTANT INVENTORY (Inventory of air pollution sources) HAZARDOUS WASTE BIENNIAL REPORTER (Resource Conservation and Recovery Act (tracking hazardous waste)) Large Quantity Generators, more that 1000 kg of hazardous waste/month (Resource Conservation and Recovery Act (tracking hazardous waste)) TRI REPORTER (Tracking of toxic chemicals releasing facilities) Business SIC classification: SECONDARY SMELTING AND REFINING OF NONFERROUS METALS; SCRAP AND WASTE MATERIALS Business NAICS classification: HAZARDOUS WASTE TREATMENT AND DISPOSAL. Organizations: METECH INTERNATIONAL, L.L.C. (CONTACT/OPERATOR)
, CAPITAL INVESTMENT CORPORATION (CONTACT/OWNER)
Alternative names: BOLIDEN METECH, BOLIDEN METECH INC. WESTERN DIV., METECH INTERNATIONAL, LLC
GILROY FOODS (1350 PACHECO PASS HWY in GILROY, CA)
STATE MASTER (California - Hazardous Waste Tracking) - HAZARDOU WASTE PROGRAM CRITERIA AND HAZARDOUS AIR POLLUTANT INVENTORY (Inventory of air pollution sources) HAZARDOUS WASTE BIENNIAL REPORTER (Resource Conservation and Recovery Act (tracking hazardous waste)) Large Quantity Generators, more that 1000 kg of hazardous waste/month (Resource Conservation and Recovery Act (tracking hazardous waste)) - notification TRI REPORTER (Tracking of toxic chemicals releasing facilities) Business SIC classification: DRIED AND DEHYDRATED FRUITS, VEGETABLES, AND SOUP MIXES Organizations: CONAGRA INC (CONTACT/OWNER)
Alternative names: CON AGRA FOOD INGREDIENTS-GILROY FOODS, CONAGRA INC DBA GILROY FOODS
GILROY, CITY OF (SOUTH COUNTY REGIONAL WWA in GILROY, CA)
National Pollutant Discharge Elimination System NON-MAJOR (Tracking pollutant discharge elimination systems) - permit National Pollutant Discharge Elimination System NON-MAJOR (Tracking pollutant discharge elimination systems) - permit COMMUNITY WATER SYSTEM (SDWIS) - SDWIS-CA4310004 10T, WATER TREATMENT PLANT Business SIC classification: SEWERAGE SYSTEMS Organizations: SOUTH COUNTY REGIOANAL WASTEWA (CONTACT/OWNER)
Alternative names: CITY OF GILROY
AIR MAJOR (AIRS/AFS) AIR PROGRAM (Clean Air Markets Division Business System) STATE MASTER (California - Hazardous Waste Tracking) - HAZARDOU WASTE PROGRAM CRITERIA AND HAZARDOUS AIR POLLUTANT INVENTORY (Inventory of air pollution sources) Small Quantity Generators, between 100 kg and 1000 kg of hazardous waste/month (Resource Conservation and Recovery Act (tracking hazardous waste)) - notification Business SIC classification: ELECTRIC SERVICES; DRYCLEANING PLANTS, EXCEPT RUG CLEANING Organizations: CALPINE GILROY COGEN L P (CONTACT/OWNER)
, CALPINE CORPORATION (OWNER/OPERATOR)
Alternative names: CALPINE GILROY COGEN L P, GILROY ENERGY CENTER, LLC
GAYLORD CONTAINER CORPORATION (6400 JAMIESON WAY in GILROY, CA)
STATE MASTER (California - Hazardous Waste Tracking) - HAZARDOU WASTE PROGRAM CRITERIA AND HAZARDOUS AIR POLLUTANT INVENTORY (Inventory of air pollution sources) Small Quantity Generators, between 100 kg and 1000 kg of hazardous waste/month (Resource Conservation and Recovery Act (tracking hazardous waste)) TRI REPORTER (Tracking of toxic chemicals releasing facilities) Business SIC classification: CORRUGATED AND SOLID FIBER BOXES Business NAICS classification: CORRUGATED AND SOLID FIBER BOX MANUFACTURING. Organizations: TIN INC DBA TEMPLE-INLAND (CONTACT/OPERATOR)
Alternative names: CROWN ZELLERBACH CORP
INDIAN MOTORCYCLE CORP (7555 RAIL ROAD AVE in GILROY, CA)
STATE MASTER (California - Hazardous Waste Tracking) - HAZARDOU WASTE PROGRAM Large Quantity Generators, more that 1000 kg of hazardous waste/month (Resource Conservation and Recovery Act (tracking hazardous waste)) - notification Business NAICS classification: MOTORCYCLE, BICYCLE, AND PARTS MANUFACTURING.
HOGUE BROTHERS BODY SHOP (8516 CHURCH STREET in GILROY, CA)
STATE MASTER (California - Hazardous Waste Tracking) - HAZARDOU WASTE PROGRAM CRITERIA AND HAZARDOUS AIR POLLUTANT INVENTORY (Inventory of air pollution sources) Small Quantity Generators, between 100 kg and 1000 kg of hazardous waste/month (Resource Conservation and Recovery Act (tracking hazardous waste)) - notification Business SIC classification: TOP, BODY, AND UPHOLSTERY REPAIR SHOPS AND PAINT SHOPS Business NAICS classification: AUTOMOTIVE BODY, PAINT, AND INTERIOR REPAIR AND MAINTENANCE. Organizations: NICK BOFFA (CONTACT/OWNER)
Alternative names: HOGUE BROS
EMPIRE EQUIPMENT CO LP (415 E 9TH ST in GILROY, CA)
STATE MASTER (California - Hazardous Waste Tracking) - HAZARDOU WASTE PROGRAM Small Quantity Generators, between 100 kg and 1000 kg of hazardous waste/month (Resource Conservation and Recovery Act (tracking hazardous waste)) - notification
GILROY AUTOMATIVE MACHINE (7747 EIGLEBERRY in GILROY, CA)
STATE MASTER (California - Hazardous Waste Tracking) - HAZARDOU WASTE PROGRAM Small Quantity Generators, between 100 kg and 1000 kg of hazardous waste/month (Resource Conservation and Recovery Act (tracking hazardous waste)) - notification Organizations: DALE BOOMGARDEN (CONTACT/OWNER)
Alternative names: GILROY AUTOMOTIVE MACHINE INC
INDIAN MOTORCYCLE CORPORTION (200 E TENTH ST in GILROY, CA)
STATE MASTER (California - Hazardous Waste Tracking) - HAZARDOU WASTE PROGRAM CRITERIA AND HAZARDOUS AIR POLLUTANT INVENTORY (Inventory of air pollution sources) Small Quantity Generators, between 100 kg and 1000 kg of hazardous waste/month (Resource Conservation and Recovery Act (tracking hazardous waste)) - notification Business SIC classification: MOTORCYCLES, BICYCLES, AND PARTS Business NAICS classification: MOTORCYCLE, BICYCLE, AND PARTS MANUFACTURING.
MASTER CLEANERS (340 E 10TH ST B in GILROY, CA)
STATE MASTER (California - Hazardous Waste Tracking) - HAZARDOU WASTE PROGRAM CRITERIA AND HAZARDOUS AIR POLLUTANT INVENTORY (Inventory of air pollution sources) Small Quantity Generators, between 100 kg and 1000 kg of hazardous waste/month (Resource Conservation and Recovery Act (tracking hazardous waste)) - notification Business SIC classification: DRYCLEANING PLANTS, EXCEPT RUG CLEANING Organizations: YOUNG LEE (CONTACT/OWNER)
KAISER GILROY MEDL BLDG (7520 ARROYO CR in GILROY, CA)
STATE MASTER (California - Hazardous Waste Tracking) - HAZARDOU WASTE PROGRAM Small Quantity Generators, between 100 kg and 1000 kg of hazardous waste/month (Resource Conservation and Recovery Act (tracking hazardous waste)) - notification Organizations: KAISER FOUNDATION HOSPITALS (CONTACT/OWNER)
Alternative names: KAISER PERMANENTE
GAVILAN JOINT COMM COLLEGE DIST (5055 SANTA TERESA BLVD in GILROY, CA)
STATE MASTER (California - Hazardous Waste Tracking) - HAZARDOU WASTE PROGRAM Small Quantity Generators, between 100 kg and 1000 kg of hazardous waste/month (Resource Conservation and Recovery Act (tracking hazardous waste)) - notification Organizations: GAVILAN JOINT CUMM COLLEGE DIST (CONTACT/OWNER)
Housing units lacking complete plumbing facilities: 0.3% Housing units lacking complete kitchen facilities: 0.8%
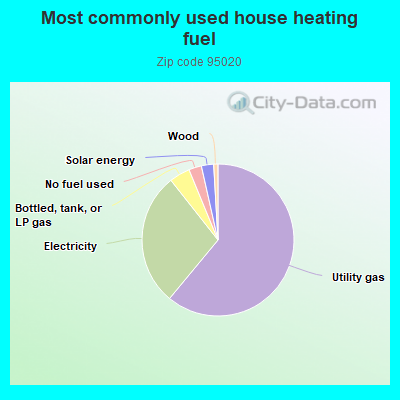
60.9%Utility gas
28.3%Electricity
4.4%Bottled, tank, or LP gas
2.7%No fuel used
2.6%Solar energy
0.9%Wood
Population in 1990: 39,878. Population change in the 1990s: +10,070 (+25.3%).
Place of birth for U.S.-born residents:
This state: 43,920
Northeast: 1,357
Midwest: 1,836
South: 1,820
West: 2,024
50% of the 95020 zip code residents lived in the same house 5 years ago. Out of people who lived in different houses, 78% lived in this county. Out of people who lived in different counties, 50% lived in California.
91% of the 95020 zip code residents lived in the same house 1 year ago. Out of people who lived in different houses, 68% moved from this county. Out of people who lived in different houses, 21% moved from different county within same state. Out of people who lived in different houses, 4% moved from different state. Out of people who lived in different houses, 6% moved from abroad.
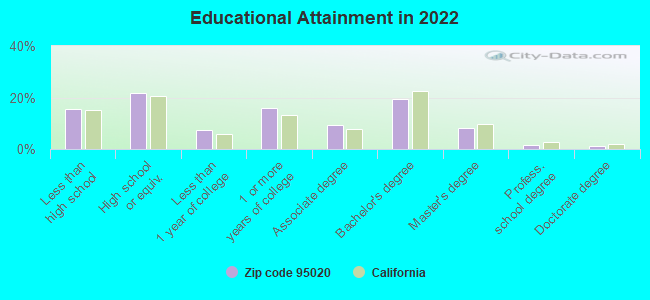
Private vs. public school enrollment:
Students in private schools in grades 1 to 8 (elementary and middle school): 1,145
Here:
13.3%
California:
10.5%
Students in private schools in grades 9 to 12 (high school): 388
Here:
8.4%
California:
8.5%
Students in private undergraduate colleges: 408
Here:
10.6%
California:
15.9%
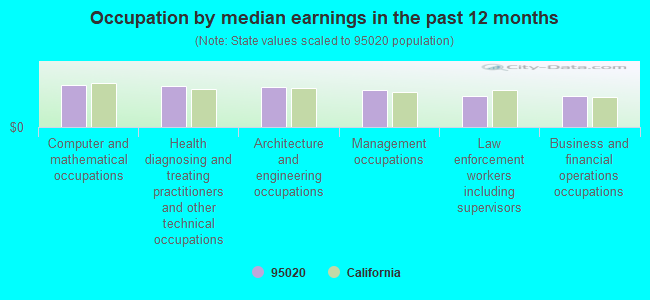
Occupation by median earnings in the past 12 months ($)
147,121Computer and mathematical occupations
144,393Health diagnosing and treating practitioners and other technical occupations
142,871Architecture and engineering occupations
129,937Management occupations
110,743Law enforcement workers including supervisors
109,696Business and financial operations occupations
Companies with federal contracts located in this zip code (GILROY, CA):
SOUTH COUNTY CHRYSLER-PLYMOUTH (6600 CHESTNUT ST)
$37,214 with Navy for Trucks and Truck Tractors, Wheeled. Signed on 2005-09-14. Completion date: 2005-09-14.
DALEO INC (7190 FOREST ST; small business)
$12,093 with Navy for Communications Services. Signed on 2005-08-01. Completion date: 2006-07-31.
HIGGINS, KEITH B & ASSOCIATES (1300B 1ST ST; small business)
$10,540 with Army for Other Professional Services. Signed on 2006-03-22. Completion date: 2006-04-30.
SOLARA ENERGY INC (8882 MURAOKA DRIVE)
$5,879 with Navy for Automated News Services, Data Services, or Other Information Services. Buying data, the electronic equivalent of books, periodicals, newspapers, etc.. Taking place in MD. Signed on 2005-03-02. Completion date: 2005-03-04.
TR ENGINEERING INC (5945 OBATA WAY UNIT D; small business) : $5,804 in 3 contractsin 2003
$6,060 with Army for Power and Hand Pumps. Signed on 2003-12-08. Completion date: 2004-04-09.
$0, same as above.Signed on 2003-11-05. Completion date: 2004-04-09.
-$256, same as above.Signed on 2003-11-05. Completion date: 2004-04-09.
ASCO SERVICE, INC (575 SOUTHSIDE DR STE B; small business)
$4,050 with Navy for Plumbing Fixtures and Accessories. Signed on 2004-06-10. Completion date: 2004-07-16.
Top industries in this zip code by the number of employees in 2005:
2005 - 2018 National Fire Incident Reporting System (NFIRS) incidents
According to the data from the years 2005 - 2018 the average number of fire incidents per year is 248. The highest number of fire incidents - 376 took place in 2007, and the least - 56 in 2006. The data has a growing trend.
When looking into fire subcategories, the most incidents belonged to: Outside Fires (45.6%), and Structure Fires (33.4%).
Fire incident types reported to NFIRS in Zip Code 95020


 Nearest zip codes: 95046, 95037, 95004, 95045, 95076, 95023.
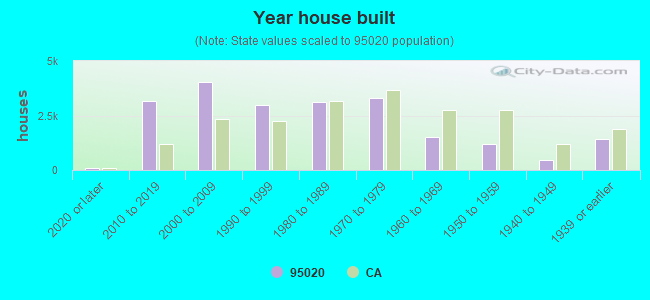


 According to the data from the years 2005 - 2018 the average number of fire incidents per year is 248. The highest number of fire incidents - 376 took place in 2007, and the least - 56 in 2006. The data has a growing trend.
 When looking into fire subcategories, the most incidents belonged to: Outside Fires (45.6%), and Structure Fires (33.4%).