Estimated zip code population in 2022: 16,856 Zip code population in 2010: 15,585 Zip code population in 2000: 13,477
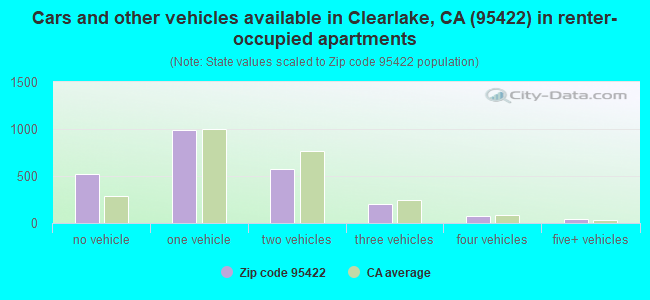
Houses and condos: 8,231 Renter-occupied apartments: 2,401
% of renters here:
39%
State:
44%
March 2022 cost of living index in zip code 95422: 90.4 (less than average, U.S. average is 100)
Land area: 35.2 sq. mi. Water area: 8.6 sq. mi.
Population density: 478 people per square mile
(low).
OSM Map
General Map
Google Map
MSN Map
OSM Map
General Map
Google Map
MSN Map
OSM Map
General Map
Google Map
MSN Map
OSM Map
General Map
Google Map
MSN Map
Please wait while loading the map...
Real estate property taxes paid for housing units in 2022:
This zip code:
0.7% ($1,400)
California:
0.7% ($4,831)
Median real estate property taxes paid for housing units with mortgages in 2022: $1,556 (0.7%) Median real estate property taxes paid for housing units with no mortgage in 2022: $1,138 (0.7%)
Averages for the 2020 tax year for zip code 95422, filed in 2021:
Average Adjusted Gross Income (AGI) in 2020: $36,695 (Individual Income Tax Returns)
Here:
$36,695
State:
$95,910
Salary/wage: $33,492 (reported on 79.5% of returns)
Here:
$33,492
State:
$77,331
(% of AGI for various income ranges: 1200.7% for AGIs below $25k, 3995.6% for AGIs $25k-50k, 7263.3% for AGIs $50k-75k, 10243.5% for AGIs $75k-100k, 15597.7% for AGIs $100k-200k)
Taxable interest for individuals: $596 (reported on 17.0% of returns)
This zip code:
$596
California:
$2,294
(% of AGI for various income ranges: 10.4% for AGIs below $25k, 8.7% for AGIs $25k-50k, 15.7% for AGIs $50k-75k, 42.4% for AGIs $75k-100k, 58.5% for AGIs $100k-200k)
Ordinary dividends: $3,562 (reported on 5.3% of returns)
Here:
$3,562
State:
$10,949
(% of AGI for various income ranges: 9.5% for AGIs below $25k, 28.8% for AGIs $25k-50k, 16.7% for AGIs $50k-75k, 70.6% for AGIs $75k-100k, 232.3% for AGIs $100k-200k)
Net capital gain/loss in AGI: +$10,809 (reported on 5.8% of returns)
Here:
+$10,809
State:
+$49,306
(% of AGI for various income ranges: 2.0% for AGIs below $25k, 22.6% for AGIs $25k-50k, 15.7% for AGIs $50k-75k, 164.1% for AGIs $75k-100k, 2139.2% for AGIs $100k-200k)
Profit/loss from business: +$11,851 (reported on 11.8% of returns)
Here:
+$11,851
State:
+$15,671
(% of AGI for various income ranges: 144.2% for AGIs below $25k, 165.9% for AGIs $25k-50k, 275.9% for AGIs $50k-75k, 319.4% for AGIs $75k-100k, 1008.5% for AGIs $100k-200k)
Taxable individual retirement arrangement distribution: $15,479 (reported on 3.4% of returns)
95422:
$15,479
California:
$23,505
(% of AGI for various income ranges: 18.7% for AGIs below $25k, 36.2% for AGIs $25k-50k, 138.9% for AGIs $50k-75k, 1167.7% for AGIs $100k-200k)
Total itemized deductions: $26,056 (reported on 2.9% of returns)
Here:
$26,056
State:
$39,517
(% of AGI for various income ranges: 37.1% for AGIs below $25k, 63.5% for AGIs $25k-50k, 167.6% for AGIs $50k-75k, 377.6% for AGIs $75k-100k, 1005.4% for AGIs $100k-200k)
Charity contributions: $3,489 (reported on 1.6% of returns)
Here:
$3,489
State:
$12,598
(% of AGI for various income ranges: 1.9% for AGIs below $25k, 21.1% for AGIs $50k-75k, 142.3% for AGIs $100k-200k)
Taxes paid: $6,167 (reported on 2.7% of returns)
95422:
$6,167
State:
$8,807
(% of AGI for various income ranges: 4.9% for AGIs below $25k, 8.6% for AGIs $25k-50k, 33.0% for AGIs $50k-75k, 100.6% for AGIs $75k-100k, 313.8% for AGIs $100k-200k)
Earned income credit: $2,454 (reported on 28.4% of returns)
Here:
$2,454
State:
$2,074
(% of AGI for various income ranges: 144.6% for AGIs below $25k, 108.2% for AGIs $25k-50k, 3.3% for AGIs $50k-75k)
Percentage of individuals using paid preparers for their 2020 taxes: 90.4%
Here:
90%
State:
92%
(% for various income ranges: 89.4% for AGIs below $25k, 91.8% for AGIs $25k-50k, 88.6% for AGIs $50k-75k, 88.9% for AGIs $75k-100k, 95.7% for AGIs $100k-200k, 100.0% for AGIs over 200k)
Averages for the 2012 tax year for zip code 95422, filed in 2013:
Average Adjusted Gross Income (AGI) in 2012: $28,470 (Individual Income Tax Returns)
Here:
$28,470
State:
$72,726
Salary/wage: $24,944 (reported on 80.9% of returns)
Here:
$24,944
State:
$59,079
(% of AGI for various income ranges: 74.3% for AGIs below $25k, 76.5% for AGIs $25k-50k, 71.2% for AGIs $50k-75k, 76.7% for AGIs $75k-100k, 46.9% for AGIs $100k-200k)
Taxable interest for individuals: $1,172 (reported on 18.9% of returns)
This zip code:
$1,172
California:
$2,146
(% of AGI for various income ranges: 0.8% for AGIs below $25k, 0.8% for AGIs $25k-50k, 0.6% for AGIs $50k-75k, 0.9% for AGIs $75k-100k, 0.7% for AGIs $100k-200k)
Ordinary dividends: $2,897 (reported on 7.6% of returns)
Here:
$2,897
State:
$9,308
(% of AGI for various income ranges: 0.7% for AGIs below $25k, 1.0% for AGIs $25k-50k, 0.8% for AGIs $50k-75k, 0.3% for AGIs $75k-100k, 0.8% for AGIs $100k-200k)
Net capital gain/loss in AGI: +$1,685 (reported on 6.2% of returns)
Here:
+$1,685
State:
+$30,460
(% of AGI for various income ranges: 0.3% for AGIs $25k-50k, 0.9% for AGIs $50k-75k, 1.0% for AGIs $100k-200k)
Profit/loss from business: +$8,889 (reported on 12.7% of returns)
Here:
+$8,889
State:
+$17,064
(% of AGI for various income ranges: 7.7% for AGIs below $25k, 2.9% for AGIs $25k-50k, 0.4% for AGIs $50k-75k, 1.9% for AGIs $75k-100k, 4.7% for AGIs $100k-200k)
Taxable individual retirement arrangement distribution: $11,471 (reported on 4.8% of returns)
95422:
$11,471
California:
$19,557
(% of AGI for various income ranges: 1.3% for AGIs below $25k, 1.6% for AGIs $25k-50k, 2.1% for AGIs $50k-75k, 7.0% for AGIs $75k-100k)
Total itemized deductions: $18,493 (30% of AGI, reported on 15.4% of returns)
Here:
$18,493
State:
$34,004
Here:
30.4% of AGI
State:
22.7% of AGI
(% of AGI for various income ranges: 6.0% for AGIs below $25k, 7.6% for AGIs $25k-50k, 11.3% for AGIs $50k-75k, 16.7% for AGIs $75k-100k, 16.6% for AGIs $100k-200k)
Charity contributions: $2,033 (reported on 10.6% of returns)
Here:
$2,033
State:
$4,659
(% of AGI for various income ranges: 0.3% for AGIs below $25k, 0.6% for AGIs $25k-50k, 0.9% for AGIs $50k-75k, 1.5% for AGIs $75k-100k, 1.2% for AGIs $100k-200k)
Taxes paid: $4,888 (reported on 15.4% of returns)
95422:
$4,888
State:
$14,448
(% of AGI for various income ranges: 1.1% for AGIs below $25k, 1.6% for AGIs $25k-50k, 2.7% for AGIs $50k-75k, 4.9% for AGIs $75k-100k, 6.4% for AGIs $100k-200k)
Earned income credit: $2,456 (reported on 37.3% of returns)
Here:
$2,456
State:
$2,286
(% of AGI for various income ranges: 9.7% for AGIs below $25k, 1.8% for AGIs $25k-50k)
Percentage of individuals using paid preparers for their 2012 taxes: 50.5%
Here:
50%
State:
64%
(% for various income ranges: 45.5% for AGIs below $25k, 54.2% for AGIs $25k-50k, 62.2% for AGIs $50k-75k, 60.0% for AGIs $75k-100k, 81.8% for AGIs $100k-200k)
Averages for the 2004 tax year for zip code 95422, filed in 2005:
Average Adjusted Gross Income (AGI) in 2004: $27,827 (Individual Income Tax Returns)
Here:
$27,827
State:
$58,600
Salary/wage: $24,191 (reported on 79.3% of returns)
Here:
$24,191
State:
$49,455
(% of AGI for various income ranges: 93.9% for AGIs below $10k, 72.4% for AGIs $10k-25k, 75.5% for AGIs $25k-50k, 73.8% for AGIs $50k-75k, 65.0% for AGIs $75k-100k, 38.4% for AGIs over 100k)
Taxable interest for individuals: $1,901 (reported on 29.2% of returns)
This zip code:
$1,901
California:
$2,365
(% of AGI for various income ranges: 3.7% for AGIs below $10k, 2.0% for AGIs $10k-25k, 1.7% for AGIs $25k-50k, 1.8% for AGIs $50k-75k, 0.9% for AGIs $75k-100k, 3.2% for AGIs over 100k)
Taxable dividends: $1,727 (reported on 11.7% of returns)
Here:
$1,727
State:
$4,746
(% of AGI for various income ranges: 2.0% for AGIs below $10k, 0.8% for AGIs $10k-25k, 0.7% for AGIs $25k-50k, 0.7% for AGIs $50k-75k, 0.4% for AGIs $75k-100k, 0.7% for AGIs over 100k)
Net capital gain/loss: +$10,913 (reported on 12.5% of returns)
Here:
+$10,913
State:
+$23,418
(% of AGI for various income ranges: 0.5% for AGIs below $10k, 0.8% for AGIs $10k-25k, 1.4% for AGIs $25k-50k, 1.6% for AGIs $50k-75k, 8.4% for AGIs $75k-100k, 22.1% for AGIs over 100k)
Profit/loss from business: +$11,317 (reported on 14.0% of returns)
Here:
+$11,317
State:
+$16,826
(% of AGI for various income ranges: 5.1% for AGIs below $10k, 5.5% for AGIs $10k-25k, 3.1% for AGIs $25k-50k, 4.6% for AGIs $50k-75k, 3.5% for AGIs $75k-100k, 15.1% for AGIs over 100k)
IRA payment deduction: $2,922 (reported on 2.0% of returns)
95422:
$2,922
California:
$3,192
(% of AGI for various income ranges: 0.2% for AGIs $10k-25k, 0.1% for AGIs $25k-50k, 0.3% for AGIs $50k-75k, 0.5% for AGIs $75k-100k)
Self-employed pension: $17,071 (reported on 0.4% of returns)
Here:
$17,071
California:
$17,688
Total itemized deductions: $16,568 (28% of AGI, reported on 20.7% of returns)
Here:
$16,568
State:
$28,113
Here:
28.5% of AGI
State:
25.3% of AGI
(% of AGI for various income ranges: 6.8% for AGIs below $10k, 6.9% for AGIs $10k-25k, 12.0% for AGIs $25k-50k, 14.1% for AGIs $50k-75k, 20.2% for AGIs $75k-100k, 14.2% for AGIs over 100k)
Charity contributions deductions: $1,754 (3% of AGI, reported on 16.6% of returns)
Here:
$1,754
State:
$3,923
Here:
2.9% of AGI
State:
3.3% of AGI
(% of AGI for various income ranges: 0.6% for AGIs below $10k, 0.4% for AGIs $10k-25k, 1.1% for AGIs $25k-50k, 1.1% for AGIs $50k-75k, 2.3% for AGIs $75k-100k, 1.1% for AGIs over 100k)
Total tax: $3,521 (reported on 63.0% of returns)
95422:
$3,521
State:
$10,761
(% of AGI for various income ranges: 2.9% for AGIs below $10k, 3.4% for AGIs $10k-25k, 5.8% for AGIs $25k-50k, 8.8% for AGIs $50k-75k, 10.5% for AGIs $75k-100k, 18.1% for AGIs over 100k)
Earned income credit: $1,656 (reported on 29.1% of returns)
Here:
$1,656
State:
$1,763
Percentage of individuals using paid preparers for their 2004 taxes: 64.8%
Here:
65%
State:
66%
(% for various income ranges: 56.8% for AGIs below $10k, 66.4% for AGIs $10k-25k, 66.5% for AGIs $25k-50k, 69.8% for AGIs $50k-75k, 75.2% for AGIs $75k-100k, 80.0% for AGIs over 100k)
Household received Food Stamps/SNAP in the past 12 months: 2,269 Household did not receive Food Stamps/SNAP in the past 12 months: 4,153
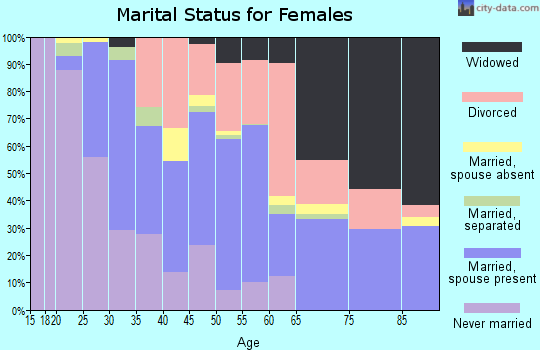
Women who had a birth in the past 12 months: 190 (31 now married, 161 unmarried) Women who did not have a birth in the past 12 months: 3,487 (1,264 now married, 2,228 unmarried)
Housing units in zip code 95422 with a mortgage: 2,040 (97 second mortgage, 70 both second mortgage and home equity loan) Houses without a mortgage: 12
Median monthly owner costs for units with a mortgage: $1,363 Median monthly owner costs for units without a mortgage: $498
Residents with income below the poverty level in 2022:
This zip code:
24.1%
Whole state:
12.2%
Residents with income below 50% of the poverty level in 2022:
This zip code:
13.7%
Whole state:
6.2%
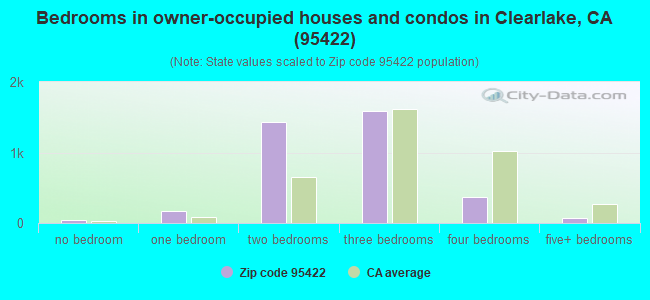
Median number of rooms in houses and condos:
Here:
5.2
State:
6.0
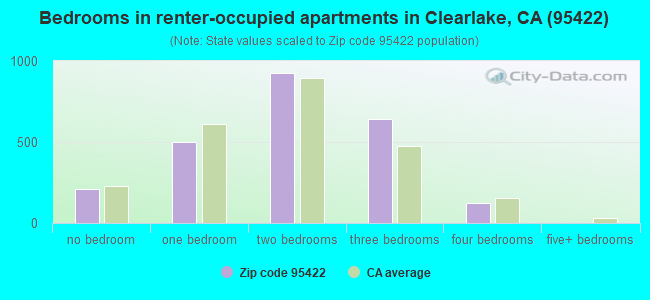
Median number of rooms in apartments:
Here:
4.3
State:
3.9
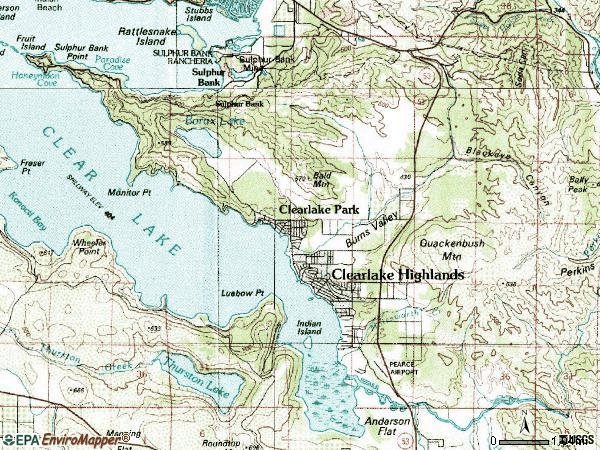
Notable locations in this zip code not listed on our city pages
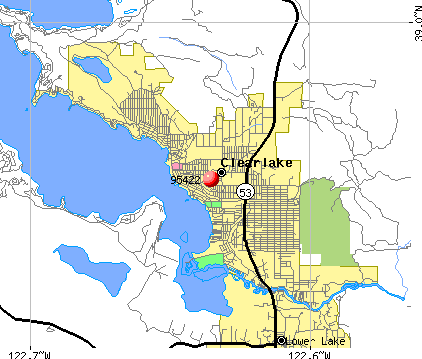
Notable locations in zip code 95422: Sulphur Bank (A), Hrutky Egg Ranch (B), Eastlake Landfill (C), Peachtree Crossing (D), South Shore Senior Citizens Center (E), Redbud Branch Lake County Library (F), Clearlake City Hall (G), Lake County Fire Protection District Station 73 (H), Lake County Fire Protection District Station 72 (I), Lake County Fire Protection District Station 71 (J), Lake County Fire Protection District Station 70 Headquarters (K). Display/hide their locations on the map
Shopping Centers: Burns Valley Mall Shopping Center (1), Highlands Shopping Center (2), Clear Lake Shopping Center (3). Display/hide their locations on the map
Churches in zip code 95422 include: Church of Christ (A), Church of the Nazarene (B), Kingdom Hall of Jehovahs Witnesses (C), Saint Anthonys Catholic Church (D), Apostolic Community Church (E), Calvary Chapel of Clearlake (F), Clearlake Community United Methodist Church (G), First Assembly of God Church (H), First Baptist Church (I). Display/hide their locations on the map
Streams, rivers, and creeks: Burns Valley (A), Dry Creek (B), Herndon Creek (C), Molesworth Creek (D), Perkins Creek (E). Display/hide their locations on the map
1,437 married couples with children.
2,029 single-parent households (859 men, 1,170 women).
78.0% of residents of 95422 zip code speak English at home.
19.9% of residents speak Spanish at home (68% very well, 13% well, 15% not well, 5% not at all).
1.0% of residents speak other Indo-European language at home (70% very well, 17% well, 13% not well).
0.4% of residents speak Asian or Pacific Island language at home (59% very well, 41% not well).
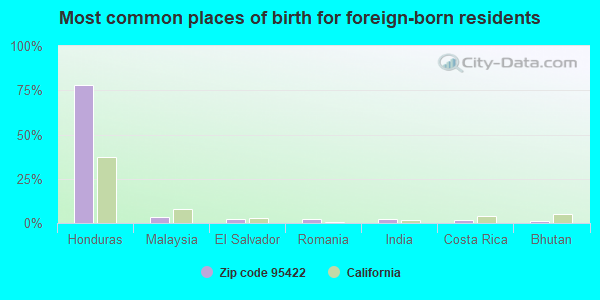
Foreign born population: 1,771 (10.5%) (35.1% of them are naturalized citizens)
This zip code:
10.5%
Whole state:
26.7%
78%Honduras
3%Malaysia
2%El Salvador
2%Romania
2%India
2%Costa Rica
1%Bhutan
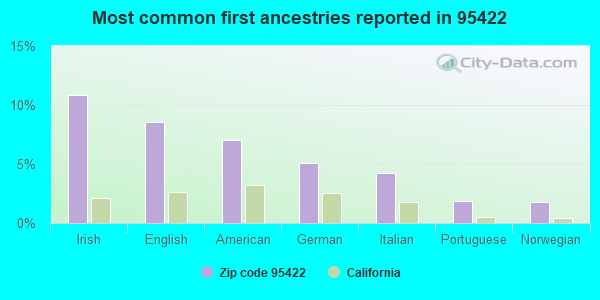
11%Irish
9%English
7%American
5%German
4%Italian
2%Portuguese
2%Norwegian
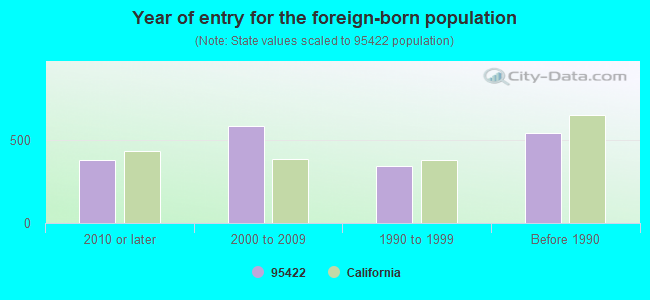
Year of entry for the foreign-born population
3782010 or later
5832000 to 2009
3461990 to 1999
545Before 1990
Facilities with environmental interests located in this zip code:
EAST LAKE SANITARY LANDFILL/BUYBACK DROPOFF (16015 DAVIS AVE in CLEARLAKE, CA)
STATE MASTER (California Solid Waste disposal sites tracking) - REFUSE DISPOSAL CRITERIA AND HAZARDOUS AIR POLLUTANT INVENTORY (Inventory of air pollution sources) REFUSE DISPOSAL (Solid waste facilities tracking) STATE MASTER (California - Used Oil Recycling System ) - USED OIL RECYCLING Business SIC classification: REFUSE SYSTEMS Business NAICS classification: SOLID WASTE LANDFILL. Organizations: COUNTY OF LAKE (CONTACT/OPERATOR)
Alternative names: EASTLAKE SANITARY LANDFILL
ADVENTIST HEALTH REDBUD COMMUNITY HOSP (15630 18TH AVE in CLEARLAKE, CA) . Federal Facility
AIR MINOR (AIRS/AFS) STATE MASTER (California - Hazardous Waste Tracking) - HAZARDOU WASTE PROGRAM CRITERIA AND HAZARDOUS AIR POLLUTANT INVENTORY (Inventory of air pollution sources) Small Quantity Generators, between 100 kg and 1000 kg of hazardous waste/month (Resource Conservation and Recovery Act (tracking hazardous waste)) - notification Business SIC classification: GENERAL MEDICAL AND SURGICAL HOSPITALS Organizations: REDBUD HOSP DIST (CONTACT/OWNER)
Alternative names: ADVENTIST HLTH REDBUD COMMUNITY HOSPITAL, REDBUD COMM HOSP
GENESIS HIGH (6840 SMITH CENTER DR. in CLEARLAKE, CA)
(National Center for Education Statistics) - STATE ID-1730134 Organizations: KONOCTI UNIFIED (SCHOOL DISTRICT)
GRAND CLEANERS (14190 LAKESHORE in CLEARLAKE, CA)
Small Quantity Generators, between 100 kg and 1000 kg of hazardous waste/month (Resource Conservation and Recovery Act (tracking hazardous waste))
LAKE COUNTY PUBLIC HEALTH SERVICE (700 SOUTH CENTER DRIVE in CLEAR LAKE, CA)
Small Quantity Generators, between 100 kg and 1000 kg of hazardous waste/month (Resource Conservation and Recovery Act (tracking hazardous waste)) Alternative names: DOHS-LAKE CO, DOHS LAKE COUNTY PUBLIC HEALTH SERVICE
ADVENTIST HEALTH HOSPITAL (18TH AVE & HWY 53 in CLEARLAKE, CA)
CRITERIA AND HAZARDOUS AIR POLLUTANT INVENTORY (Inventory of air pollution sources) Business SIC classification: OFFICES AND CLINICS OF HEALTH PRACTITIONERS
KONOCTI UNIFIED SCHOOL DISTRICT (50 CENTRAL DR in CLEARLAKE, CA)
COMPLIANCE ACTIVITY (Tracking inspections of insecticide, fungicide, and rodenticide, and toxic substances)
KONOCTI USD (SOUTH CENTRAL DR in CLEARLAKE, CA)
COMPLIANCE ACTIVITY (Tracking inspections of insecticide, fungicide, and rodenticide, and toxic substances)
LACOSAN SE POTW (230A MAIN STREET in CLEARLAKE, CA)
CRITERIA AND HAZARDOUS AIR POLLUTANT INVENTORY (Inventory of air pollution sources) Business SIC classification: SEWERAGE SYSTEMS
MATERIAL SOLUTIONS INCORPORATED (13349 LAKESHORE DRIVE in CLEARLAKE, CA)
TRI REPORTER (Tracking of toxic chemicals releasing facilities) Business SIC classification: ELECTRONIC COMPONENTS
Housing units lacking complete plumbing facilities: 2.8% Housing units lacking complete kitchen facilities: 2.9%
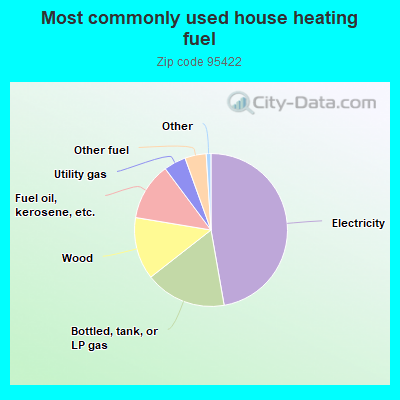
47.3%Electricity
17.2%Bottled, tank, or LP gas
13.2%Wood
12.2%Fuel oil, kerosene, etc.
4.7%Utility gas
4.5%Other fuel
Population in 1990: 12,157. Population change in the 1990s: +1,320 (+10.9%).
Place of birth for U.S.-born residents:
This state: 11,848
Northeast: 418
Midwest: 748
South: 824
West: 1,114
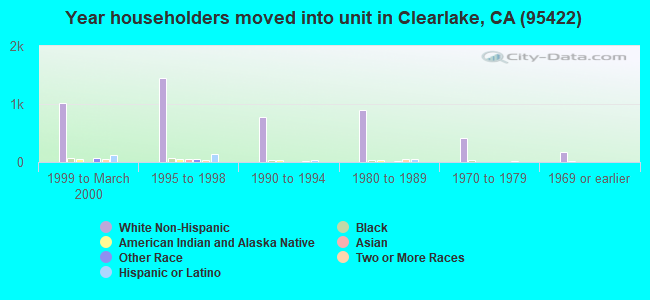
47% of the 95422 zip code residents lived in the same house 5 years ago. Out of people who lived in different houses, 52% lived in this county. Out of people who lived in different counties, 50% lived in California.
91% of the 95422 zip code residents lived in the same house 1 year ago. Out of people who lived in different houses, 59% moved from this county. Out of people who lived in different houses, 31% moved from different county within same state. Out of people who lived in different houses, 8% moved from different state. Out of people who lived in different houses, 2% moved from abroad.
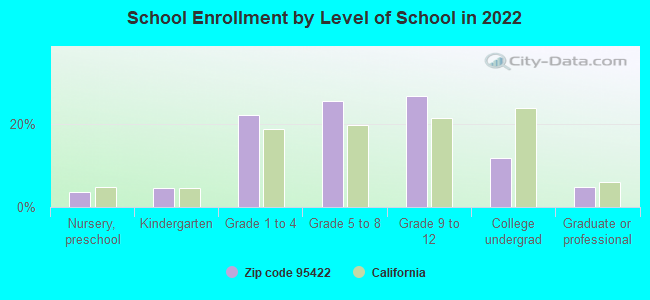
Private vs. public school enrollment:
Students in private schools in grades 1 to 8 (elementary and middle school): 12
Here:
0.6%
California:
10.5%
Students in private schools in grades 9 to 12 (high school): 6
Here:
0.5%
California:
8.5%
Students in private undergraduate colleges: 39
Here:
8.0%
California:
15.9%
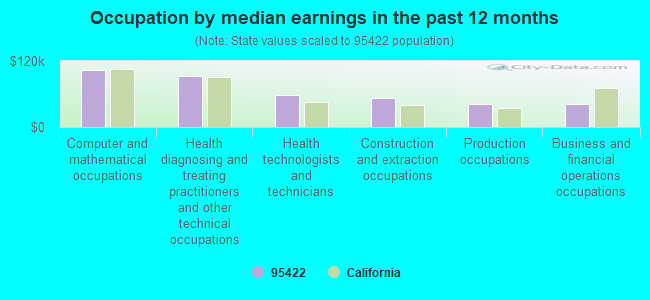
Occupation by median earnings in the past 12 months ($)
103,680Computer and mathematical occupations
91,950Health diagnosing and treating practitioners and other technical occupations
58,766Health technologists and technicians
52,120Construction and extraction occupations
41,137Production occupations
41,058Business and financial operations occupations
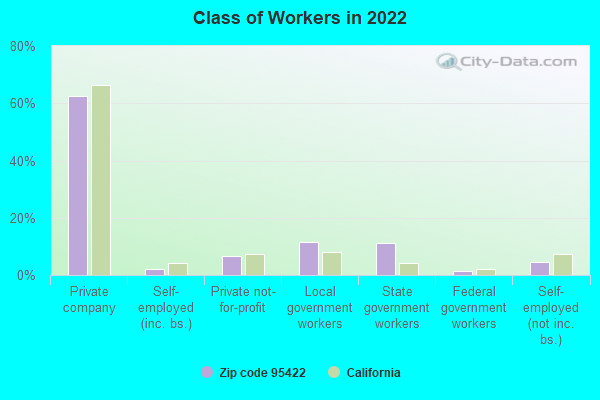
Top industries in this zip code by the number of employees in 2005:
Health Care and Social Assistance: General Medical and Surgical Hospitals (250-499 employees: 1 establishment)
Health Care and Social Assistance: Nursing Care Facilities (100-249: 1)
Health Care and Social Assistance: Child Day Care Services (20-49: 1, 5-9: 2, 1-4: 3)
People in group quarters in 2010:
250 people in other noninstitutional facilities
94 people in nursing facilities/skilled-nursing facilities
59 people in group homes intended for adults
33 people in emergency and transitional shelters (with sleeping facilities) for people experiencing homelessness
15 people in workers' group living quarters and job corps centers
9 people in residential treatment centers for adults
People in group quarters in 2000:
96 people in nursing homes
19 people in other noninstitutional group quarters
3 people in homes for the mentally retarded
Fatal accident statistics in 2012:
Fatal accident count: 2
Vehicles involved in fatal accidents: 5
Fatal accidents caused by drunken drivers: 0
Fatalities: 2
Persons involved in fatal accidents: 6
Pedestrians involved in fatal accidents: 1
Fatal accident statistics in 2011:
Fatal accident count: 2
Vehicles involved in fatal accidents: 3
Fatal accidents caused by drunken drivers: 1
Fatalities: 2
Persons involved in fatal accidents: 4
Pedestrians involved in fatal accidents: 0
2002 - 2018 National Fire Incident Reporting System (NFIRS) incidents
Based on the data from the years 2002 - 2018 the average number of fire incidents per year is 66. The highest number of fire incidents - 138 took place in 2013, and the least - 0 in 2003. The data has a growing trend.
When looking into fire subcategories, the most incidents belonged to: Outside Fires (42.3%), and Structure Fires (38.8%).
Fire incident types reported to NFIRS in Zip Code 95422


 Nearest zip codes: 95423, 95457, 95443, 95451, 95426, 95467.
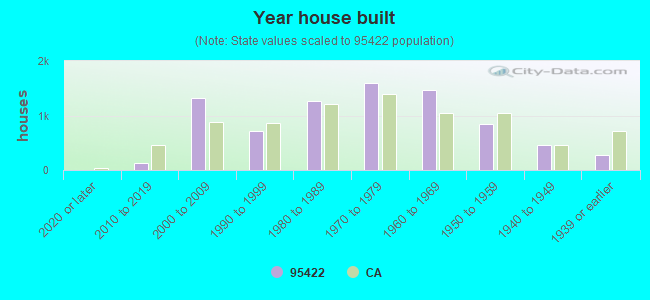


 Based on the data from the years 2002 - 2018 the average number of fire incidents per year is 66. The highest number of fire incidents - 138 took place in 2013, and the least - 0 in 2003. The data has a growing trend.
 When looking into fire subcategories, the most incidents belonged to: Outside Fires (42.3%), and Structure Fires (38.8%).