Estimated zip code population in 2022: 1,111 Zip code population in 2010: 1,222 Zip code population in 2000: 1,196
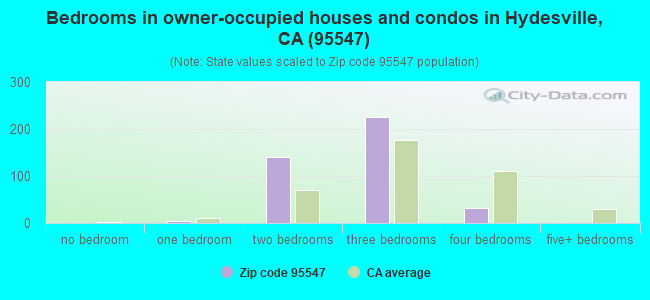
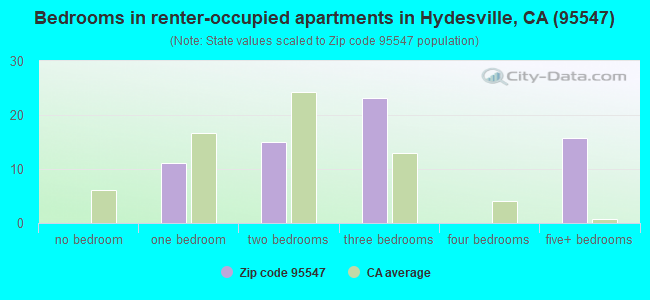
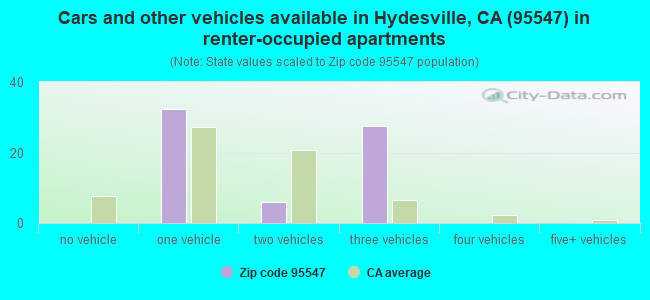
Houses and condos: 527 Renter-occupied apartments: 64
% of renters here:
14%
State:
44%
March 2022 cost of living index in zip code 95547: 99.0 (near average, U.S. average is 100)
Land area: 7.5 sq. mi. Water area: 0.0 sq. mi.
Population density: 147 people per square mile
(very low).
OSM Map
General Map
Google Map
MSN Map
OSM Map
General Map
Google Map
MSN Map
OSM Map
General Map
Google Map
MSN Map
OSM Map
General Map
Google Map
MSN Map
Please wait while loading the map...
Real estate property taxes paid for housing units in 2022:
This zip code:
0.6% ($3,081)
California:
0.7% ($4,831)
Median real estate property taxes paid for housing units with mortgages in 2022: $3,442 (0.7%) Median real estate property taxes paid for housing units with no mortgage in 2022: $2,807 (0.5%)
Business Search- 14 Million verified businesses
Males: 618
(55.6%)
Females: 493
(44.4%)
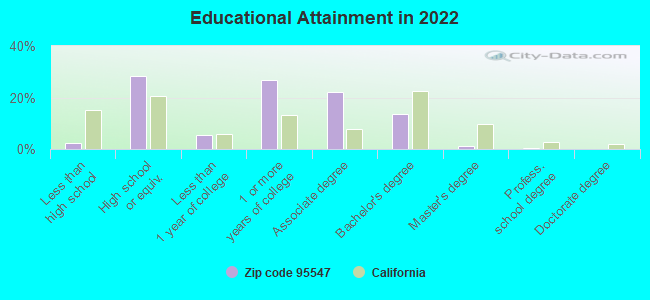
For population 25 years and over in 95547:
High school or higher: 96.0%
Bachelor's degree or higher: 15.0%
Graduate or professional degree: 1.6%
Mean travel time to work (commute): 31.3 minutes
For population 15 years and over in 95547:
Never married: 22.1%
Now married: 50.6%
Separated: 1.7%
Widowed: 6.8%
Divorced: 18.7%
Zip code 95547 compared to state average:
Unemployed percentage significantly below state average.
Black race population percentage significantly below state average.
Hispanic race population percentage significantly below state average.
Median age significantly above state average.
Foreign-born population percentage significantly below state average.
Renting percentage significantly below state average.
Length of stay since moving in significantly above state average.
Percentage of population with a bachelor's degree or higher below state average.
Averages for the 2020 tax year for zip code 95547, filed in 2021:
Average Adjusted Gross Income (AGI) in 2020: $78,060 (Individual Income Tax Returns)
Here:
$78,060
State:
$95,910
Salary/wage: $55,188 (reported on 69.0% of returns)
Here:
$55,188
State:
$77,331
(% of AGI for various income ranges: 1276.7% for AGIs below $25k, 3445.0% for AGIs $25k-50k, 7643.3% for AGIs $50k-75k, 5760.0% for AGIs $75k-100k, 16162.0% for AGIs $100k-200k)
Taxable interest for individuals: $1,903 (reported on 50.0% of returns)
This zip code:
$1,903
California:
$2,294
(% of AGI for various income ranges: 56.7% for AGIs below $25k, 92.0% for AGIs $25k-50k, 136.7% for AGIs $50k-75k, 75.0% for AGIs $75k-100k, 296.0% for AGIs $100k-200k)
Ordinary dividends: $5,709 (reported on 19.0% of returns)
Here:
$5,709
State:
$10,949
(% of AGI for various income ranges: 82.2% for AGIs below $25k, 596.7% for AGIs $50k-75k, 750.0% for AGIs $100k-200k)
Net capital gain/loss in AGI: +$13,945 (reported on 19.0% of returns)
Here:
+$13,945
State:
+$49,306
(% of AGI for various income ranges: 55.0% for AGIs $25k-50k, 166.7% for AGIs $50k-75k, 2858.0% for AGIs $100k-200k)
Profit/loss from business: +$32,633 (reported on 25.9% of returns)
Here:
+$32,633
State:
+$15,671
(% of AGI for various income ranges: 403.3% for AGIs below $25k, 509.0% for AGIs $25k-50k, 2296.7% for AGIs $50k-75k, 6668.0% for AGIs $100k-200k)
Taxable individual retirement arrangement distribution: $12,583 (reported on 10.3% of returns)
95547:
$12,583
California:
$23,505
(% of AGI for various income ranges: 356.0% for AGIs $25k-50k, 997.5% for AGIs $75k-100k)
Total itemized deductions: $30,371 (reported on 12.1% of returns)
Here:
$30,371
State:
$39,517
(% of AGI for various income ranges: 593.0% for AGIs $25k-50k, 3066.0% for AGIs $100k-200k)
Charity contributions: $12,420 (reported on 8.6% of returns)
Here:
$12,420
State:
$12,598
(% of AGI for various income ranges: 1242.0% for AGIs $100k-200k)
Taxes paid: $8,157 (reported on 12.1% of returns)
95547:
$8,157
State:
$8,807
(% of AGI for various income ranges: 157.0% for AGIs $25k-50k, 828.0% for AGIs $100k-200k)
Earned income credit: $2,171 (reported on 12.1% of returns)
Here:
$2,171
State:
$2,074
(% of AGI for various income ranges: 81.1% for AGIs below $25k, 79.0% for AGIs $25k-50k)
Percentage of individuals using paid preparers for their 2020 taxes: 94.8%
Here:
95%
State:
92%
(% for various income ranges: 87.5% for AGIs below $25k, 100.0% for AGIs $25k-50k, 87.5% for AGIs $50k-75k, 100.0% for AGIs $75k-100k, 100.0% for AGIs $100k-200k, 100.0% for AGIs over 200k)
Averages for the 2012 tax year for zip code 95547, filed in 2013:
Average Adjusted Gross Income (AGI) in 2012: $55,988 (Individual Income Tax Returns)
Here:
$55,988
State:
$72,726
Salary/wage: $47,255 (reported on 67.9% of returns)
Here:
$47,255
State:
$59,079
(% of AGI for various income ranges: 57.5% for AGIs below $25k, 56.7% for AGIs $25k-50k, 53.4% for AGIs $50k-75k, 56.3% for AGIs $75k-100k, 59.1% for AGIs $100k-200k)
Taxable interest for individuals: $1,182 (reported on 50.0% of returns)
This zip code:
$1,182
California:
$2,146
(% of AGI for various income ranges: 0.8% for AGIs below $25k, 1.4% for AGIs $25k-50k, 2.5% for AGIs $50k-75k, 0.4% for AGIs $75k-100k, 0.8% for AGIs $100k-200k)
Ordinary dividends: $2,992 (reported on 23.2% of returns)
Here:
$2,992
State:
$9,308
(% of AGI for various income ranges: 1.3% for AGIs below $25k, 1.7% for AGIs $25k-50k, 1.7% for AGIs $50k-75k, 1.5% for AGIs $75k-100k, 0.8% for AGIs $100k-200k)
Net capital gain/loss in AGI: +$791 (reported on 19.6% of returns)
Here:
+$791
State:
+$30,460
(% of AGI for various income ranges: 0.9% for AGIs $100k-200k)
Profit/loss from business: +$29,079 (reported on 25.0% of returns)
Here:
+$29,079
State:
+$17,064
(% of AGI for various income ranges: 17.6% for AGIs below $25k, 13.6% for AGIs $25k-50k, 17.3% for AGIs $50k-75k, 15.7% for AGIs $100k-200k)
Taxable individual retirement arrangement distribution: $11,843 (reported on 12.5% of returns)
95547:
$11,843
California:
$19,557
Total itemized deductions: $25,890 (26% of AGI, reported on 35.7% of returns)
Here:
$25,890
State:
$34,004
Here:
26.4% of AGI
State:
22.7% of AGI
(% of AGI for various income ranges: 20.6% for AGIs below $25k, 15.9% for AGIs $25k-50k, 16.7% for AGIs $50k-75k, 15.6% for AGIs $75k-100k, 16.3% for AGIs $100k-200k)
Charity contributions: $3,181 (reported on 28.6% of returns)
Here:
$3,181
State:
$4,659
(% of AGI for various income ranges: 1.1% for AGIs $25k-50k, 2.5% for AGIs $50k-75k, 1.7% for AGIs $75k-100k, 1.8% for AGIs $100k-200k)
Taxes paid: $8,585 (reported on 35.7% of returns)
95547:
$8,585
State:
$14,448
(% of AGI for various income ranges: 3.4% for AGIs below $25k, 3.1% for AGIs $25k-50k, 4.4% for AGIs $50k-75k, 4.4% for AGIs $75k-100k, 7.4% for AGIs $100k-200k)
Earned income credit: $2,000 (reported on 17.9% of returns)
Here:
$2,000
State:
$2,286
(% of AGI for various income ranges: 5.1% for AGIs below $25k, 1.5% for AGIs $25k-50k)
Percentage of individuals using paid preparers for their 2012 taxes: 67.9%
Here:
68%
State:
64%
(% for various income ranges: 52.4% for AGIs below $25k, 76.9% for AGIs $25k-50k, 71.4% for AGIs $50k-75k, 83.3% for AGIs $75k-100k, 77.8% for AGIs $100k-200k)
Averages for the 2004 tax year for zip code 95547, filed in 2005:
Average Adjusted Gross Income (AGI) in 2004: $47,037 (Individual Income Tax Returns)
Here:
$47,037
State:
$58,600
Salary/wage: $38,672 (reported on 80.4% of returns)
Here:
$38,672
State:
$49,455
(% of AGI for various income ranges: 97.3% for AGIs below $10k, 73.9% for AGIs $10k-25k, 66.9% for AGIs $25k-50k, 72.7% for AGIs $50k-75k, 75.2% for AGIs $75k-100k, 54.6% for AGIs over 100k)
Taxable interest for individuals: $1,751 (reported on 58.5% of returns)
This zip code:
$1,751
California:
$2,365
(% of AGI for various income ranges: 7.6% for AGIs below $10k, 2.3% for AGIs $10k-25k, 2.0% for AGIs $25k-50k, 1.3% for AGIs $50k-75k, 1.7% for AGIs $75k-100k, 2.7% for AGIs over 100k)
Taxable dividends: $2,029 (reported on 25.1% of returns)
Here:
$2,029
State:
$4,746
(% of AGI for various income ranges: 8.1% for AGIs below $10k, 2.1% for AGIs $10k-25k, 1.9% for AGIs $25k-50k, 0.8% for AGIs $50k-75k, 0.9% for AGIs $75k-100k, 0.4% for AGIs over 100k)
Net capital gain/loss: +$8,705 (reported on 20.7% of returns)
Here:
+$8,705
State:
+$23,418
(% of AGI for various income ranges: -4.6% for AGIs below $10k, 1.8% for AGIs $10k-25k, -0.3% for AGIs $25k-50k, -0.4% for AGIs $50k-75k, 0.0% for AGIs $75k-100k, 11.1% for AGIs over 100k)
Profit/loss from business: +$19,901 (reported on 18.6% of returns)
Here:
+$19,901
State:
+$16,826
(% of AGI for various income ranges: 21.1% for AGIs below $10k, 6.4% for AGIs $10k-25k, 10.3% for AGIs $25k-50k, 11.6% for AGIs $50k-75k, 8.2% for AGIs over 100k)
IRA payment deduction: $2,571 (reported on 2.6% of returns)
95547:
$2,571
California:
$3,192
Total itemized deductions: $20,798 (26% of AGI, reported on 39.3% of returns)
Here:
$20,798
State:
$28,113
Here:
26.0% of AGI
State:
25.3% of AGI
(% of AGI for various income ranges: 17.6% for AGIs $10k-25k, 17.2% for AGIs $25k-50k, 15.8% for AGIs $50k-75k, 19.0% for AGIs $75k-100k, 18.2% for AGIs over 100k)
Charity contributions deductions: $2,916 (4% of AGI, reported on 32.8% of returns)
Here:
$2,916
State:
$3,923
Here:
3.6% of AGI
State:
3.3% of AGI
(% of AGI for various income ranges: 1.9% for AGIs below $10k, 1.9% for AGIs $25k-50k, 1.8% for AGIs $50k-75k, 3.5% for AGIs $75k-100k, 2.1% for AGIs over 100k)
Total tax: $6,672 (reported on 77.7% of returns)
95547:
$6,672
State:
$10,761
(% of AGI for various income ranges: 4.9% for AGIs below $10k, 4.4% for AGIs $10k-25k, 7.1% for AGIs $25k-50k, 8.3% for AGIs $50k-75k, 11.3% for AGIs $75k-100k, 16.4% for AGIs over 100k)
Earned income credit: $1,518 (reported on 15.7% of returns)
Here:
$1,518
State:
$1,763
Percentage of individuals using paid preparers for their 2004 taxes: 59.4%
Here:
59%
State:
66%
(% for various income ranges: 46.5% for AGIs below $10k, 58.5% for AGIs $10k-25k, 59.9% for AGIs $25k-50k, 61.0% for AGIs $50k-75k, 58.0% for AGIs $75k-100k, 83.3% for AGIs over 100k)
Likely homosexual households (counted as self-reported same-sex unmarried-partner households)
Lesbian couples: 0.9% of all households
Gay men: 0.0% of all households
Household received Food Stamps/SNAP in the past 12 months: 64 Household did not receive Food Stamps/SNAP in the past 12 months: 405
Women who had a birth in the past 12 months: 18 (18 now married, 0 unmarried) Women who did not have a birth in the past 12 months: 155 (62 now married, 93 unmarried)
Housing units in zip code 95547 with a mortgage: 232 (41 second mortgage, 24 both second mortgage and home equity loan) Median monthly owner costs for units with a mortgage: $2,125 Median monthly owner costs for units without a mortgage: $584
Residents with income below the poverty level in 2022:
This zip code:
23.4%
Whole state:
12.2%
Residents with income below 50% of the poverty level in 2022:
This zip code:
15.9%
Whole state:
6.2%
Median number of rooms in houses and condos:
Here:
5.3
State:
6.0
Median number of rooms in apartments:
Here:
6.7
State:
3.9
Notable locations in this zip code not listed on our city pages
In group quarters: 2 (-1 institutionalized population)
Size of family households: 167 2-persons, 41 3-persons, 67 4-persons, 8 5-persons, 4 6-persons
Size of nonfamily households: 122 1-person, 59 2-persons
103 married couples with children.
54 single-parent households (25 men, 29 women).
96.5% of residents of 95547 zip code speak English at home.
0.5% of residents speak Spanish at home (100% not well).
2.4% of residents speak Asian or Pacific Island language at home (23% very well, 38% well, 38% not well).
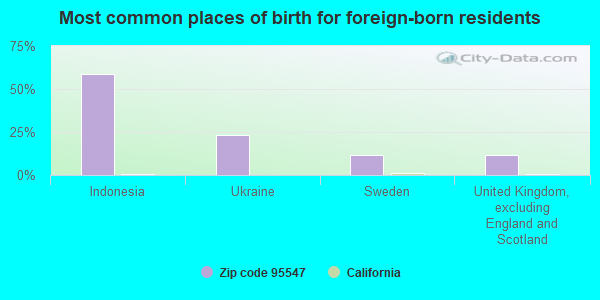
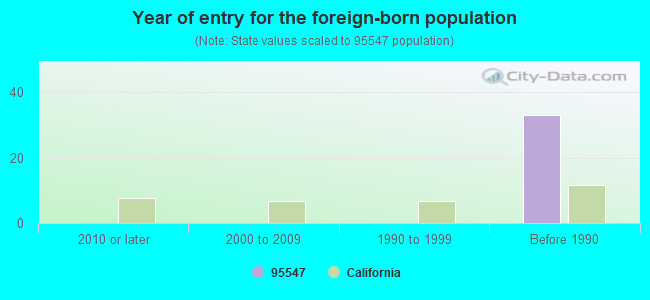
Foreign born population: 35 (3.2%) (85.9% of them are naturalized citizens)
This zip code:
3.2%
Whole state:
26.7%
59%Indonesia
24%Ukraine
12%Sweden
12%United Kingdom, excluding England and Scotland
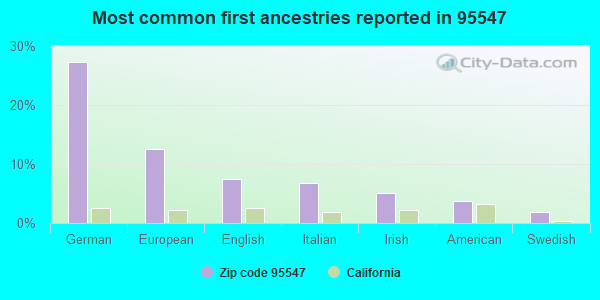
27%German
12%European
7%English
7%Italian
5%Irish
4%American
2%Swedish
Year of entry for the foreign-born population
02010 or later
02000 to 2009
01990 to 1999
33Before 1990
Facilities with environmental interests located in this zip code:
HYDESVILLE ELEMENTARY (3050 JOHNSON ROAD in HYDESVILLE, CA)
(National Center for Education Statistics) - STATE ID-6007942
COMPLIANCE ACTIVITY (Tracking inspections of insecticide, fungicide, and rodenticide, and toxic substances)
Housing units lacking complete plumbing facilities: 7.3% Housing units lacking complete kitchen facilities: 4.7%
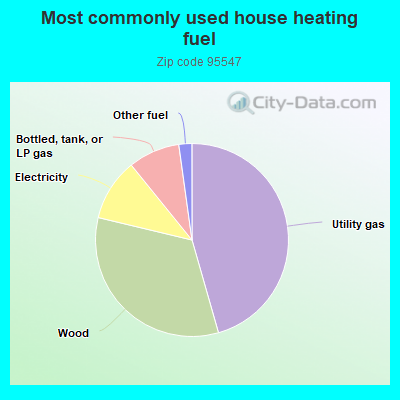
45.9%Utility gas
33.4%Wood
10.5%Electricity
8.7%Bottled, tank, or LP gas
2.2%Other fuel
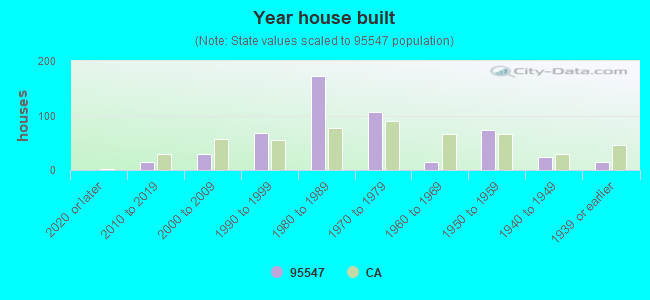
Population in 1990: 919. Population change in the 1990s: +277 (+30.1%).
Place of birth for U.S.-born residents:
This state: 939
Northeast: 22
Midwest: 27
South: 25
West: 61
62% of the 95547 zip code residents lived in the same house 5 years ago. Out of people who lived in different houses, 68% lived in this county. Out of people who lived in different counties, 50% lived in California.
96% of the 95547 zip code residents lived in the same house 1 year ago. Out of people who lived in different houses, 92% moved from this county. Out of people who lived in different houses, 11% moved from different county within same state.
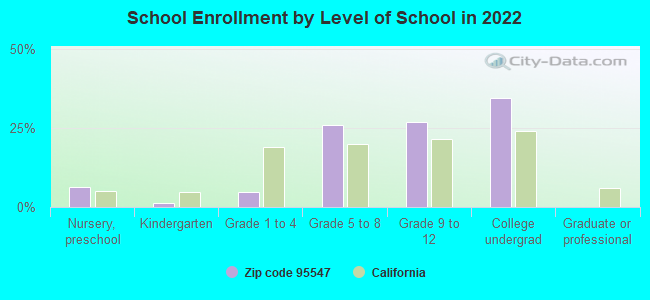
Private vs. public school enrollment:
Students in private schools in grades 1 to 8 (elementary and middle school): 12
Here:
16.1%
California:
10.5%
Students in private schools in grades 9 to 12 (high school):
Here:
0.0%
California:
8.5%
Students in private undergraduate colleges: 20
Here:
23.9%
California:
15.9%
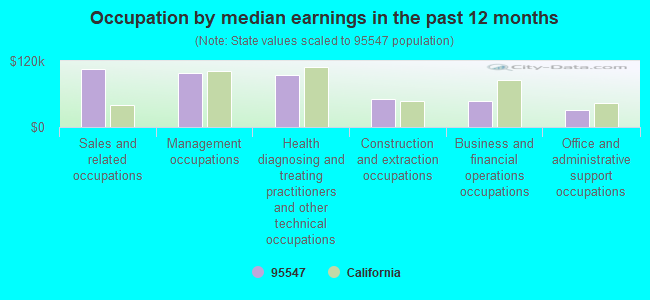
Occupation by median earnings in the past 12 months ($)
105,190Sales and related occupations
98,517Management occupations
93,843Health diagnosing and treating practitioners and other technical occupations
51,794Construction and extraction occupations
46,507Business and financial operations occupations
31,493Office and administrative support occupations
Companies with federal contracts located in this zip code:
DAVID DOOLAEGE (4134 FISHERS RD in HYDESVILLE, CA; small business) : $73,875 in 5 contractsfrom 2004 to 2005
Contracts for Conservation and Development, Other Non-Building Structures by Geological Survey, U.S. Fish and Wildlife Service Signed by year:2000: $0; 2001: $0; 2002: $0; 2003: $0; 2004: $76,875; 2005: -$3,000; 2006: $0.
Biggest contracts:
$58,400 with Geological Survey for Conservation and Development. Taking place in MI. Signed on 2004-02-20. Completion date: 2005-09-30.
$33,700 with U.S. Fish and Wildlife Service for Other Non-Building Structures. Signed on 2004-08-17. Completion date: 2004-09-30.
-$3,000 with Geological Survey for Conservation and Development. Taking place in MI. Signed on 2005-02-17. Completion date: 2005-02-17.
-$6,000, same as above.Signed on 2004-07-09. Completion date: 2005-09-30.
Top industries in this zip code by the number of employees in 2005:
Other Services (except Public Administration): Religious Organizations (20-49 employees: 1 establishment)
Professional, Scientific, and Technical Services: Environmental Consulting Services (10-19: 1)
Construction: New Single-Family Housing Construction (except Operative Builders) (1-4: 3)


 Nearest zip codes: 95540, 95562, 95565, 95528, 95503, 95551.