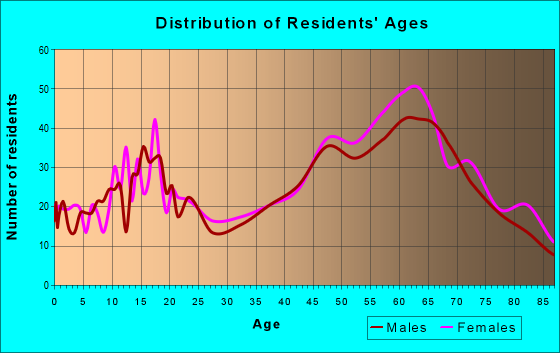
Estimated zip code population in 2022: 4,663 Zip code population in 2010: 4,680 Zip code population in 2000: 4,606
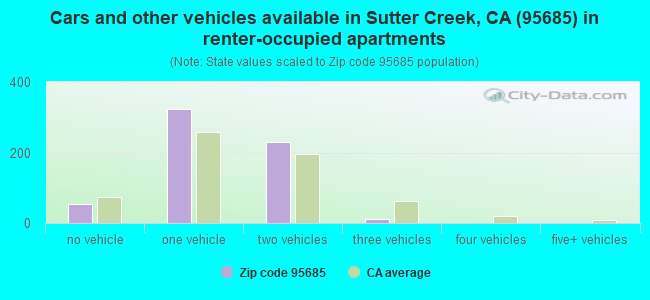
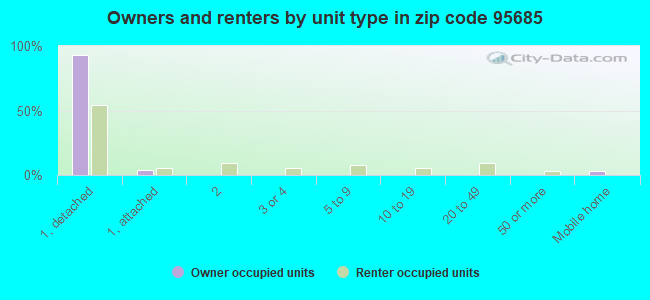
Houses and condos: 2,415 Renter-occupied apartments: 616
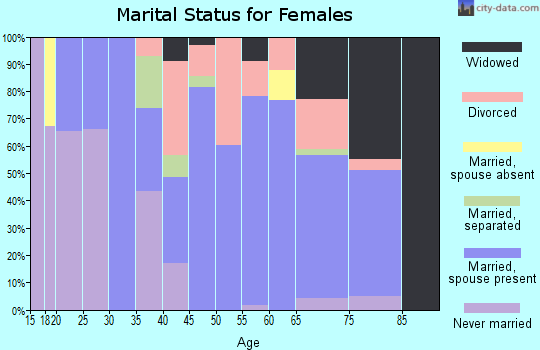
% of renters here:
29%
State:
44%
March 2022 cost of living index in zip code 95685: 101.4 (near average, U.S. average is 100)
Land area: 49.3 sq. mi. Water area: 0.0 sq. mi.
Population density: 95 people per square mile
(very low).
OSM Map
General Map
Google Map
MSN Map
OSM Map
General Map
Google Map
MSN Map
OSM Map
General Map
Google Map
MSN Map
OSM Map
General Map
Google Map
MSN Map
Please wait while loading the map...
Real estate property taxes paid for housing units in 2022:
This zip code:
0.6% ($3,194)
California:
0.7% ($4,831)
Median real estate property taxes paid for housing units with mortgages in 2022: $3,627 (0.6%) Median real estate property taxes paid for housing units with no mortgage in 2022: $2,524 (0.5%)
Averages for the 2020 tax year for zip code 95685, filed in 2021:
Average Adjusted Gross Income (AGI) in 2020: $81,611 (Individual Income Tax Returns)
Here:
$81,611
State:
$95,910
Salary/wage: $64,529 (reported on 68.6% of returns)
Here:
$64,529
State:
$77,331
(% of AGI for various income ranges: 1070.0% for AGIs below $25k, 3618.2% for AGIs $25k-50k, 6614.2% for AGIs $50k-75k, 8692.3% for AGIs $75k-100k, 17529.1% for AGIs $100k-200k, 77673.3% for AGIs over 200k)
Taxable interest for individuals: $1,358 (reported on 48.5% of returns)
This zip code:
$1,358
California:
$2,294
(% of AGI for various income ranges: 36.2% for AGIs below $25k, 67.6% for AGIs $25k-50k, 116.3% for AGIs $50k-75k, 167.7% for AGIs $75k-100k, 185.9% for AGIs $100k-200k, 1043.3% for AGIs over 200k)
Ordinary dividends: $6,132 (reported on 24.9% of returns)
Here:
$6,132
State:
$10,949
(% of AGI for various income ranges: 60.9% for AGIs below $25k, 81.5% for AGIs $25k-50k, 164.2% for AGIs $50k-75k, 301.5% for AGIs $75k-100k, 619.1% for AGIs $100k-200k, 3176.7% for AGIs over 200k)
Net capital gain/loss in AGI: +$15,730 (reported on 23.6% of returns)
Here:
+$15,730
State:
+$49,306
(% of AGI for various income ranges: 24.4% for AGIs below $25k, 57.9% for AGIs $25k-50k, 87.9% for AGIs $50k-75k, 237.7% for AGIs $75k-100k, 1306.4% for AGIs $100k-200k, 16233.3% for AGIs over 200k)
Profit/loss from business: +$20,281 (reported on 18.3% of returns)
Here:
+$20,281
State:
+$15,671
(% of AGI for various income ranges: 142.6% for AGIs below $25k, 200.0% for AGIs $25k-50k, 352.6% for AGIs $50k-75k, 687.7% for AGIs $75k-100k, 1162.3% for AGIs $100k-200k, 10840.0% for AGIs over 200k)
Taxable individual retirement arrangement distribution: $20,711 (reported on 15.3% of returns)
95685:
$20,711
California:
$23,505
(% of AGI for various income ranges: 117.9% for AGIs below $25k, 157.0% for AGIs $25k-50k, 414.7% for AGIs $50k-75k, 750.0% for AGIs $75k-100k, 1305.5% for AGIs $100k-200k, 5650.0% for AGIs over 200k)
Total itemized deductions: $28,311 (reported on 16.2% of returns)
Here:
$28,311
State:
$39,517
(% of AGI for various income ranges: 128.8% for AGIs below $25k, 242.4% for AGIs $25k-50k, 640.5% for AGIs $50k-75k, 1061.5% for AGIs $75k-100k, 1797.7% for AGIs $100k-200k, 8950.0% for AGIs over 200k)
Charity contributions: $5,341 (reported on 11.8% of returns)
Here:
$5,341
State:
$12,598
(% of AGI for various income ranges: 27.9% for AGIs below $25k, 53.7% for AGIs $50k-75k, 93.8% for AGIs $75k-100k, 248.6% for AGIs $100k-200k, 1920.0% for AGIs over 200k)
Taxes paid: $7,919 (reported on 16.2% of returns)
95685:
$7,919
State:
$8,807
(% of AGI for various income ranges: 66.1% for AGIs $25k-50k, 151.6% for AGIs $50k-75k, 292.3% for AGIs $75k-100k, 580.0% for AGIs $100k-200k, 2560.0% for AGIs over 200k)
Earned income credit: $1,732 (reported on 9.6% of returns)
Here:
$1,732
State:
$2,074
(% of AGI for various income ranges: 59.1% for AGIs below $25k, 54.5% for AGIs $25k-50k)
Percentage of individuals using paid preparers for their 2020 taxes: 93.4%
Here:
93%
State:
92%
(% for various income ranges: 89.5% for AGIs below $25k, 96.1% for AGIs $25k-50k, 91.2% for AGIs $50k-75k, 95.7% for AGIs $75k-100k, 94.0% for AGIs $100k-200k, 100.0% for AGIs over 200k)
Averages for the 2012 tax year for zip code 95685, filed in 2013:
Average Adjusted Gross Income (AGI) in 2012: $64,614 (Individual Income Tax Returns)
Here:
$64,614
State:
$72,726
Salary/wage: $50,460 (reported on 68.1% of returns)
Here:
$50,460
State:
$59,079
(% of AGI for various income ranges: 55.2% for AGIs below $25k, 61.9% for AGIs $25k-50k, 57.4% for AGIs $50k-75k, 55.1% for AGIs $75k-100k, 57.8% for AGIs $100k-200k, 36.5% for AGIs over 200k)
Taxable interest for individuals: $1,669 (reported on 47.9% of returns)
This zip code:
$1,669
California:
$2,146
(% of AGI for various income ranges: 3.0% for AGIs below $25k, 1.5% for AGIs $25k-50k, 1.4% for AGIs $50k-75k, 1.7% for AGIs $75k-100k, 0.9% for AGIs $100k-200k, 0.5% for AGIs over 200k)
Ordinary dividends: $5,804 (reported on 25.4% of returns)
Here:
$5,804
State:
$9,308
(% of AGI for various income ranges: 2.7% for AGIs below $25k, 2.1% for AGIs $25k-50k, 1.8% for AGIs $50k-75k, 1.4% for AGIs $75k-100k, 2.8% for AGIs $100k-200k, 2.4% for AGIs over 200k)
Net capital gain/loss in AGI: +$18,383 (reported on 19.2% of returns)
Here:
+$18,383
State:
+$30,460
(% of AGI for various income ranges: 0.4% for AGIs $50k-75k, 1.9% for AGIs $75k-100k, 2.2% for AGIs $100k-200k, 21.5% for AGIs over 200k)
Profit/loss from business: +$15,441 (reported on 18.3% of returns)
Here:
+$15,441
State:
+$17,064
(% of AGI for various income ranges: 8.3% for AGIs below $25k, 5.8% for AGIs $25k-50k, 3.5% for AGIs $50k-75k, 2.3% for AGIs $75k-100k, 7.4% for AGIs $100k-200k)
Taxable individual retirement arrangement distribution: $16,400 (reported on 17.4% of returns)
95685:
$16,400
California:
$19,557
(% of AGI for various income ranges: 4.6% for AGIs below $25k, 4.0% for AGIs $25k-50k, 4.6% for AGIs $50k-75k, 6.1% for AGIs $75k-100k, 4.5% for AGIs $100k-200k, 3.1% for AGIs over 200k)
Self-employment retirement plans: $36,400 (reported on 0.9% of returns)
95685:
$36,400
California:
$24,530
Total itemized deductions: $26,318 (24% of AGI, reported on 39.9% of returns)
Here:
$26,318
State:
$34,004
Here:
24.4% of AGI
State:
22.7% of AGI
(% of AGI for various income ranges: 17.8% for AGIs below $25k, 10.9% for AGIs $25k-50k, 13.9% for AGIs $50k-75k, 15.2% for AGIs $75k-100k, 17.4% for AGIs $100k-200k, 19.6% for AGIs over 200k)
Charity contributions: $3,179 (reported on 33.3% of returns)
Here:
$3,179
State:
$4,659
(% of AGI for various income ranges: 1.1% for AGIs below $25k, 1.0% for AGIs $25k-50k, 1.4% for AGIs $50k-75k, 1.5% for AGIs $75k-100k, 1.6% for AGIs $100k-200k, 2.6% for AGIs over 200k)
Taxes paid: $8,514 (reported on 39.9% of returns)
95685:
$8,514
State:
$14,448
(% of AGI for various income ranges: 3.6% for AGIs below $25k, 2.4% for AGIs $25k-50k, 3.4% for AGIs $50k-75k, 4.5% for AGIs $75k-100k, 6.8% for AGIs $100k-200k, 6.9% for AGIs over 200k)
Earned income credit: $1,772 (reported on 11.7% of returns)
Here:
$1,772
State:
$2,286
(% of AGI for various income ranges: 3.3% for AGIs below $25k, 0.9% for AGIs $25k-50k)
Percentage of individuals using paid preparers for their 2012 taxes: 60.1%
Here:
60%
State:
64%
(% for various income ranges: 52.1% for AGIs below $25k, 55.6% for AGIs $25k-50k, 60.6% for AGIs $50k-75k, 66.7% for AGIs $75k-100k, 71.9% for AGIs $100k-200k, 87.5% for AGIs over 200k)
Averages for the 2004 tax year for zip code 95685, filed in 2005:
Average Adjusted Gross Income (AGI) in 2004: $51,235 (Individual Income Tax Returns)
Here:
$51,235
State:
$58,600
Salary/wage: $42,808 (reported on 72.6% of returns)
Here:
$42,808
State:
$49,455
(% of AGI for various income ranges: 186.5% for AGIs below $10k, 60.8% for AGIs $10k-25k, 66.4% for AGIs $25k-50k, 62.2% for AGIs $50k-75k, 68.9% for AGIs $75k-100k, 52.2% for AGIs over 100k)
Taxable interest for individuals: $2,312 (reported on 60.0% of returns)
This zip code:
$2,312
California:
$2,365
(% of AGI for various income ranges: 29.4% for AGIs below $10k, 4.0% for AGIs $10k-25k, 2.8% for AGIs $25k-50k, 3.8% for AGIs $50k-75k, 2.3% for AGIs $75k-100k, 1.6% for AGIs over 100k)
Taxable dividends: $3,126 (reported on 33.6% of returns)
Here:
$3,126
State:
$4,746
(% of AGI for various income ranges: 19.9% for AGIs below $10k, 2.9% for AGIs $10k-25k, 1.7% for AGIs $25k-50k, 2.0% for AGIs $50k-75k, 1.7% for AGIs $75k-100k, 1.9% for AGIs over 100k)
Net capital gain/loss: +$12,158 (reported on 29.0% of returns)
Here:
+$12,158
State:
+$23,418
(% of AGI for various income ranges: -2.5% for AGIs below $10k, -0.5% for AGIs $10k-25k, 1.0% for AGIs $25k-50k, 2.4% for AGIs $50k-75k, 2.9% for AGIs $75k-100k, 14.7% for AGIs over 100k)
Profit/loss from business: +$16,097 (reported on 20.7% of returns)
Here:
+$16,097
State:
+$16,826
(% of AGI for various income ranges: 18.7% for AGIs below $10k, 8.5% for AGIs $10k-25k, 6.0% for AGIs $25k-50k, 3.3% for AGIs $50k-75k, 7.3% for AGIs $75k-100k, 7.5% for AGIs over 100k)
IRA payment deduction: $3,277 (reported on 4.1% of returns)
95685:
$3,277
California:
$3,192
(% of AGI for various income ranges: 0.4% for AGIs $10k-25k, 0.5% for AGIs $25k-50k, 0.3% for AGIs $50k-75k, 0.3% for AGIs $75k-100k, 0.1% for AGIs over 100k)
Self-employed pension: $11,829 (reported on 1.5% of returns)
Here:
$11,829
California:
$17,688
Total itemized deductions: $21,095 (25% of AGI, reported on 43.3% of returns)
Here:
$21,095
State:
$28,113
Here:
25.2% of AGI
State:
25.3% of AGI
(% of AGI for various income ranges: 77.4% for AGIs below $10k, 20.1% for AGIs $10k-25k, 17.5% for AGIs $25k-50k, 18.2% for AGIs $50k-75k, 19.4% for AGIs $75k-100k, 15.8% for AGIs over 100k)
Charity contributions deductions: $2,288 (3% of AGI, reported on 37.1% of returns)
Here:
$2,288
State:
$3,923
Here:
2.6% of AGI
State:
3.3% of AGI
(% of AGI for various income ranges: 2.6% for AGIs below $10k, 1.3% for AGIs $10k-25k, 1.6% for AGIs $25k-50k, 1.7% for AGIs $50k-75k, 1.7% for AGIs $75k-100k, 1.7% for AGIs over 100k)
Total tax: $7,721 (reported on 81.3% of returns)
95685:
$7,721
State:
$10,761
(% of AGI for various income ranges: 9.9% for AGIs below $10k, 4.9% for AGIs $10k-25k, 7.4% for AGIs $25k-50k, 9.2% for AGIs $50k-75k, 10.5% for AGIs $75k-100k, 17.8% for AGIs over 100k)
Earned income credit: $1,434 (reported on 8.9% of returns)
Here:
$1,434
State:
$1,763
Percentage of individuals using paid preparers for their 2004 taxes: 65.5%
Here:
66%
State:
66%
(% for various income ranges: 53.3% for AGIs below $10k, 65.4% for AGIs $10k-25k, 64.7% for AGIs $25k-50k, 70.2% for AGIs $50k-75k, 68.5% for AGIs $75k-100k, 77.0% for AGIs over 100k)
Likely homosexual households (counted as self-reported same-sex unmarried-partner households)
Lesbian couples: 0.9% of all households
Gay men: 0.0% of all households
Household received Food Stamps/SNAP in the past 12 months: 152 Household did not receive Food Stamps/SNAP in the past 12 months: 1,973
Women who had a birth in the past 12 months: 18 (18 now married, 0 unmarried) Women who did not have a birth in the past 12 months: 841 (335 now married, 505 unmarried)
Housing units in zip code 95685 with a mortgage: 912 (82 second mortgage, 56 both second mortgage and home equity loan) Median monthly owner costs for units with a mortgage: $2,398 Median monthly owner costs for units without a mortgage: $676
Residents with income below the poverty level in 2022:
This zip code:
7.4%
Whole state:
12.2%
Residents with income below 50% of the poverty level in 2022:
This zip code:
3.4%
Whole state:
6.2%
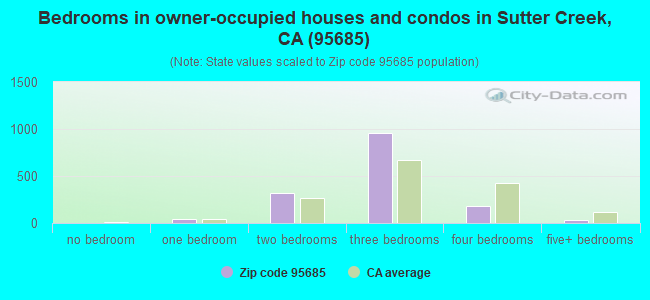
Median number of rooms in houses and condos:
Here:
5.6
State:
6.0
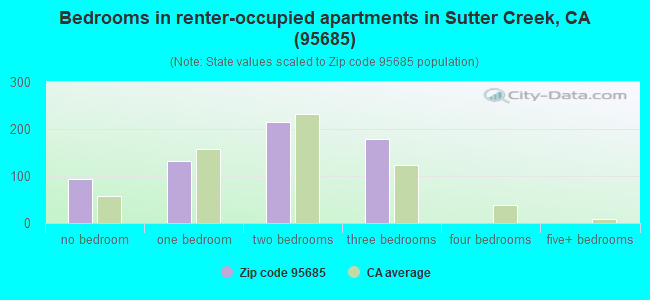
Median number of rooms in apartments:
Here:
4.4
State:
3.9
Notable locations in this zip code not listed on our city pages
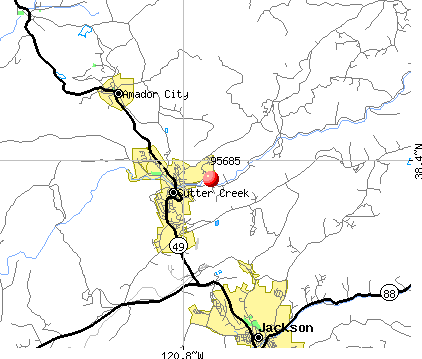
Notable locations in zip code 95685: Rancheria (A), Oneto Ranch (B), Sutter Ridge Vineyards (C), Stoneridge Winery (D), Sutter Creek City Hall (E), Ratto Theatre (F), Weil Building (G), Torres Hall (H), Peyton Building (I), Brignole Building (J), Sutter Creek Fire Protection District Station 2 (K), Sutter Creek Fire Protection District Station 1 Headquarters (L). Display/hide their locations on the map
Churches in zip code 95685 include: Immaculate Conception Catholic Church (A), Trinity Episcopal Church (B), Sutter Creek United Methodist Church (C). Display/hide their locations on the map
Cemeteries: Catholic Cemetery (1), City Cemetery (2), Fiddletown Cemetery (3), Fiddletown Masonic Cemetery (4), Independent Order of Oddfellows Cemetery (5), New Protestant Cemetery (6). Display/hide their locations on the map
In group quarters: 28 (-1 institutionalized population)
Size of family households: 556 2-persons, 367 3-persons, 114 4-persons, 122 5-persons, 8 7-or-more-persons
Size of nonfamily households: 910 1-person, 88 2-persons
433 married couples with children.
284 single-parent households (284 women).
97.5% of residents of 95685 zip code speak English at home.
1.5% of residents speak Spanish at home (88% very well, 12% well).
1.0% of residents speak other Indo-European language at home (59% very well, 41% well).
0.4% of residents speak Asian or Pacific Island language at home (78% very well, 22% well).
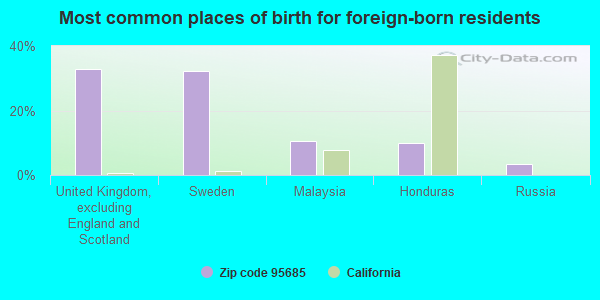
Foreign born population: 180 (3.9%) (48.5% of them are naturalized citizens)
This zip code:
3.9%
Whole state:
26.7%
33%United Kingdom, excluding England and Scotland
32%Sweden
11%Malaysia
10%Honduras
3%Russia
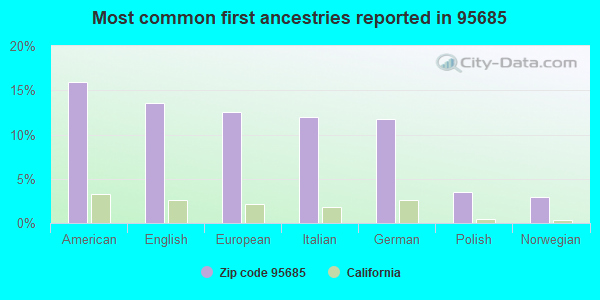
16%American
14%English
13%European
12%Italian
12%German
4%Polish
3%Norwegian
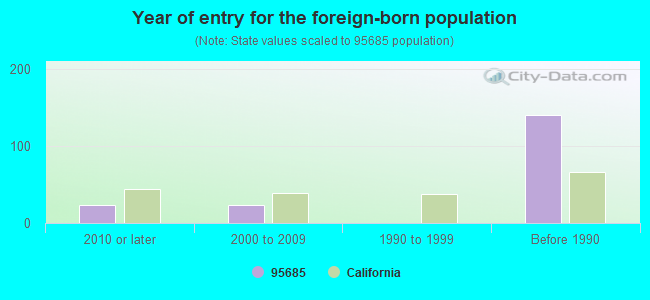
Year of entry for the foreign-born population
232010 or later
232000 to 2009
01990 to 1999
140Before 1990
Facilities with environmental interests located in this zip code:
AMADOR HIGH SCHOOL (330 SPANISH ST in SUTTER CREEK, CA)
STATE MASTER (California - Hazardous Waste Tracking) - HAZARDOU WASTE PROGRAM (National Center for Education Statistics) - STATE ID-0330753 Small Quantity Generators, between 100 kg and 1000 kg of hazardous waste/month (Resource Conservation and Recovery Act (tracking hazardous waste)) - notification Organizations: AMADOR COUNTY SCHOOL DIST (CONTACT/OWNER)
, AMADOR COUNTY UNIFIED (SCHOOL DISTRICT)
GABE GRAU SR (17121 MOON SHINE LN in SUTTER CREEK, CA)
STATE MASTER (California - Hazardous Waste Tracking) - HAZARDOU WASTE PROGRAM TRANSPORTER (Resource Conservation and Recovery Act (tracking hazardous waste)) - notification Business NAICS classification: SOLID WASTE COLLECTION.; HAZARDOUS WASTE COLLECTION. Organizations: LESLIE CHAPIN (CONTACT/OWNER)
AMADOR MOTORS INC (33 MAIN ST in SUTTER CREEK, CA)
STATE MASTER (California - Hazardous Waste Tracking) - HAZARDOU WASTE PROGRAM Small Quantity Generators, between 100 kg and 1000 kg of hazardous waste/month (Resource Conservation and Recovery Act (tracking hazardous waste)) - notification Organizations: WILLIAM HALVORSON (CONTACT/OWNER)
INDEPENDENCE HIGH (CONT.) (525 INDEPENDENCE DRIVE in SUTTER CREEK, CA)
(National Center for Education Statistics) - STATE ID-0330019 Organizations: AMADOR COUNTY UNIFIED (SCHOOL DISTRICT)
GASTON A GRAU (14447 RIDGE RD C in SUTTER CREEK, CA)
FIBREFORM WOOD PRODUCTS (11851 FIBREFORM ROAD in SUTTER CREEK, CA)
CRITERIA AND HAZARDOUS AIR POLLUTANT INVENTORY (Inventory of air pollution sources) Business SIC classification: MILLWORK
CENTRAL EUREKA MINE (HWY 49 AT BRYSON DR. in SUTTER CREEK, CA)
SUPERFUND (Superfund database) Alternative names: MESA DE ORO
Housing units lacking complete kitchen facilities: 3.0%
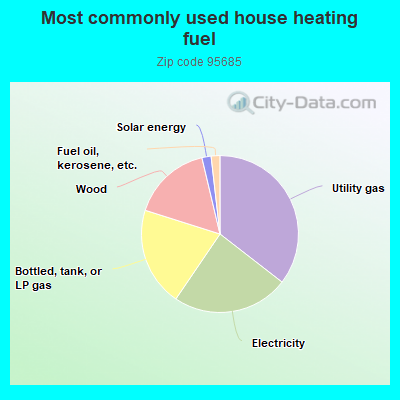
35.5%Utility gas
24.0%Electricity
20.4%Bottled, tank, or LP gas
16.4%Wood
1.9%Solar energy
1.8%Fuel oil, kerosene, etc.
Population in 1990: 5,677.
Place of birth for U.S.-born residents:
This state: 3,650
Northeast: 207
Midwest: 238
South: 216
West: 151
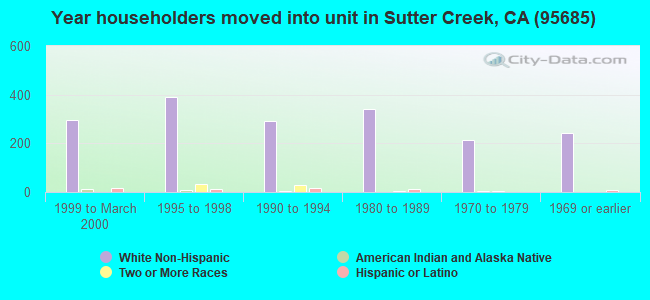
61% of the 95685 zip code residents lived in the same house 5 years ago. Out of people who lived in different houses, 54% lived in this county. Out of people who lived in different counties, 50% lived in California.
94% of the 95685 zip code residents lived in the same house 1 year ago. Out of people who lived in different houses, 77% moved from this county. Out of people who lived in different houses, 21% moved from different county within same state. Out of people who lived in different houses, 2% moved from different state.
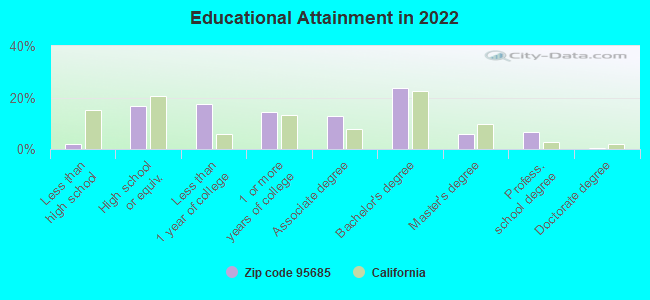
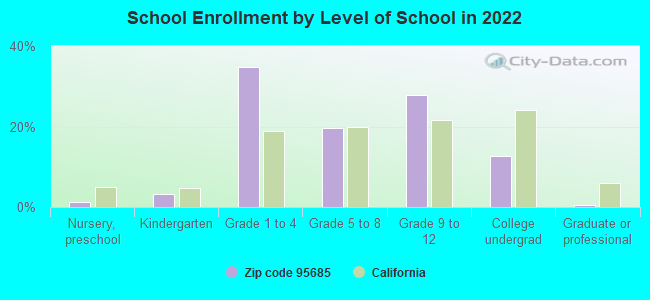
Private vs. public school enrollment:
Students in private schools in grades 1 to 8 (elementary and middle school): 5
Here:
1.2%
California:
10.5%
Students in private schools in grades 9 to 12 (high school):
Here:
0.0%
California:
8.5%
Students in private undergraduate colleges: 46
Here:
44.2%
California:
15.9%
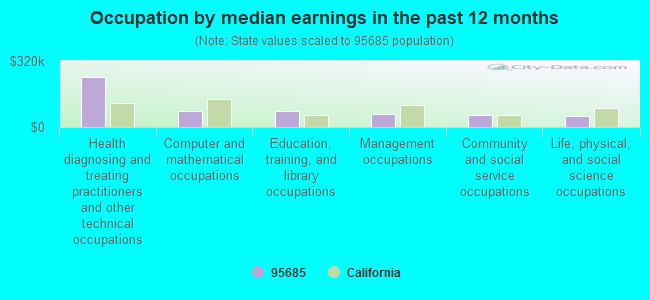
Occupation by median earnings in the past 12 months ($)
241,865Health diagnosing and treating practitioners and other technical occupations
78,577Computer and mathematical occupations
77,145Education, training, and library occupations
63,717Management occupations
57,153Community and social service occupations
51,989Life, physical, and social science occupations
Companies with federal contracts located in this zip code:
EMCO HIGH VOLTAGE CORPORATION (70 FORREST PRODUCTS RD in SUTTER CREEK, CA; small business) : $21,839 in 3 contractsfrom 2004 to 2006
$12,499 with NASA for . Signed on 2005-03-21. Completion date: 2005-03-31.
$5,739, same as above.Signed on 2004-10-25. Completion date: 2004-12-31.
$3,601 with Navy for Electrical Control Equipment. Signed on 2006-04-06. Completion date: 2006-06-09.
Top industries in this zip code by the number of employees in 2005:
Health Care and Social Assistance: Services for the Elderly and Persons with Disabilities (50-99 employees: 1 establishment)
Health Care and Social Assistance: Offices of Dentists (10-19: 1, 5-9: 3, 1-4: 1)
Construction: Site Preparation Contractors (20-49: 1, 1-4: 1)
Wholesale Trade: Stationery and Office Supplies Merchant Wholesalers (20-49: 1)
Accommodation and Food Services: Hotels (except Casino Hotels) and Motels (20-49: 1)
People in group quarters in 2010:
4 people in other noninstitutional facilities
Fatal accident statistics in 2014:
Fatal accident count: 3
Vehicles involved in fatal accidents: 6
Fatal accidents caused by drunken drivers: 0
Fatalities: 3
Persons involved in fatal accidents: 8
Pedestrians involved in fatal accidents: 0
Fatal accident statistics in 2010:
Fatal accident count: 2
Vehicles involved in fatal accidents: 2
Fatal accidents caused by drunken drivers: 0
Fatalities: 3
Persons involved in fatal accidents: 5
Pedestrians involved in fatal accidents: 0
2005 - 2018 National Fire Incident Reporting System (NFIRS) incidents
According to the data from the years 2005 - 2018 the average number of fire incidents per year is 24. The highest number of fires - 46 took place in 2007, and the least - 14 in 2012. The data has a decreasing trend.
When looking into fire subcategories, the most incidents belonged to: Outside Fires (44.9%), and Structure Fires (25.0%).
Fire incident types reported to NFIRS in Zip Code 95685


 Nearest zip codes: 95601, 95699, 95642, 95675, 95629, 95665.
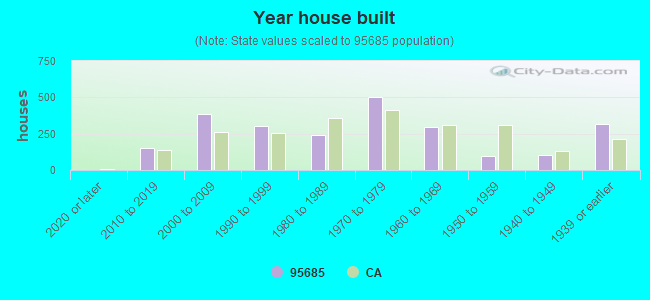


 According to the data from the years 2005 - 2018 the average number of fire incidents per year is 24. The highest number of fires - 46 took place in 2007, and the least - 14 in 2012. The data has a decreasing trend.
 When looking into fire subcategories, the most incidents belonged to: Outside Fires (44.9%), and Structure Fires (25.0%).